
Cancer Prognosis Prediction Using SVM for Hybrid Type and
Imbalanced Data Sets
Yanping Chen
1
, Bingyu Su
2,*
, Le Zou
3
, Xiaoxuan Wu
4
and Songhua Hu
5
1,3,4,5
Department of Computer Science and Technology, Hefei University, China
2,*
Hefei Institute of Intelligence Machines, Chines Academy of Sciences, China
Keywords: Prognosis prediction, hybrid type, imbalanced data, feature selection.
Abstract: Cancer prognosis is one of the hot spots in the study of biological information. There have been many
studies to cancer prognosis prediction using machine learning methods, which have achieved better results.
Among them, the support vector machine (SVM) gets extensive attention as it is suitable to apply in small-
size, high-dimensional data classification questions. However,SVM only performs well in the case
where the class distribution is balanced and the input variables are numerical which are unlikely occurred
in the medical domain. So in this study, we introduce a new prognosis prediction method based on SVM,
which modify the standard SVM models to fit imbalanced class distribution and hybrid type of features. In
details, firstly the similarity of features with nominal and numerical type is redefined in kernel function.
Secondly synthetic minority oversampling technique (SMOTE) method is adopted to balance class
distribution. Lastly the wrapper method SVM-RFE is introduced to select the useful features to improve the
prediction performance. A series of experiments are designed and launched to validate the performance.
The results have proved the effectiveness of the proposed methods.
1 INTRODUCTION
Cancer is a major disease threatening human health.
Traditionally there are three common treatments,
including surgery, chemotherapy and radiation
therapy. So far the selection of different treatment is
based on the TNM stage of the patient, that is using
tumor size, location etc. to select the appropriate
treatment. However, there may be a big difference
that even the patients with the same TNM stage
choose the same treatment. For example, the current
standard of treatment for patients with early-stage
Non-Small-Cell Lung Cancer(NSCLC) is surgical
resection. According to the statistical data, the 5-year
survival rate is only 65-70% even in those patients
whose tumors have undergone complete
resection(Zhu, 2009). So it is very significant to
develop an accurate means of prognosis which can
predict the survival time of each individual patient
after surgical operation based on the characteristics
of patient beside TNM stage information. With the
development of molecular biological medicine and
application of molecular biological diagnostic
techniques, the study of tumor pathology from the
molecular level has become a research hot spot, such
as the use of molecular characteristics to make a
prognosis.(Xu, 2016) Due to the complexity of the
molecular characteristics, machine learning have
absolute advantages compared with traditional
statistical methods.
Machine learning methods have been
successfully applied to the analysis of many different
complex problems in recent years, including many
bio-medical applications.(Jayasurya, 2010) The work
of (Street, 1995) used a self-organizing neural
network to find classes of cases with similar expected
recurrence times. D. Chakraborty, U. Maulik (2014)
approach prognosis as separation problem. The work
of (Zhu, 2009) used SVM for prognosis in Early-
Stage Non-Small-Cell Lung Cancer(NSCLC), which
plotted Kaplan-Meier survival curve to prove the
effectiveness of its method.
Although many different prognosis prediction
methods have been proposed, these methods have
poor performance in case of hybrid type and
imbalanced data sets. For several cancer datasets, on
the one hand, are consist of feature attributes which
are likely prepossessed to hybrid type, numerical and
nominal respectively ; on the other hand, the class
distribution is imbalanced, which will be confronted
with great difficulties in classical machine learning
method. To solve this problem, we propose a novel
Chen, Y., Su, B., Zou, L., Wu, X. and Hu, S.
Cancer Prognosis Prediction Using SVM for Hybrid Type and Imbalanced Data Sets.
In 3rd International Conference on Electromechanical Control Technology and Transportation (ICECTT 2018), pages 13-18
ISBN: 978-989-758-312-4
Copyright © 2018 by SCITEPRESS – Science and Technology Publications, Lda. All rights reserved
13

prognosis prediction method based on nonlinear
classification, which can be implemented using SVM.
We modified the standard SVM module to fit the test
data, which have the imbalanced data set and hybrid
types of feature. We believe that better individual
predictions may be obtained.
The rest of the article is organized as follows. In
Section 2, we firstly give a brief introduction to the
data for Analysis and the method adopted in the
following experiments. Section 3 describes the
experiments and discussion followed by conclusion
in Section 4.
2 MATERIAL AND METHOD
2.1 Data for Analysis
z NSCLC
The data from a series of 196 patients with early
stage NSCLC was adopted in this study(Zhu, 2009).
The prognosis data set is consisted of three parts,
Tissue microarrays (TMA), clinical and pathologic
variables. The process of construction of TMA was
described in (Rosenwald, 2002). Thirty three
molecular markers were chosen for investigation in
the study. All of these markers have been identified
in previous studies with the best candidates for the
prognostic prediction(Duan, 2005). All marks of each
patient is assigned to a score by three pathologists
based on the number and the intensity of stained
tumors cells. Furthermore, four clinical and
pathologic variables are also used, including
sex(male vs. female), age, cancer-cell type and tumor
diameter. Thus each patient is represented by a vector
of 37 dimension and the outcome is described as
survival time after surgery. When patients are
classified as two classes, “ died before 3 years” or
“ not died in 3 yeas” after therapy, the classification
distribution is faced with imbalanced data set with
150 patients died before 3 years against 46 not died
in 3 years.
z WPBC
We also use Wisconsin Prognostic Breast Cancer
(WPBC) in which has 198 instances with 34
attributes (ID, outcome, 32 real-valued input
features) in each instances. The first 30 features are
computed from a digitized image of a fine needle
aspirate (FNA) of a breast mass, they are described
as characteristics of the cell nuclei present in the
image. The last 2 features, which are tumor size and
lymph node status, are observed at time of surgery,
the values for features are re-coded with four
significant digits. At last the outcome is described as
recurrence time and disease-free time if outcome is
recurrence or it is no-recurrence. The class
distribution is faced with imbalanced data set with
151 non-recurrences against 47 recurrence in (Street,
1995).
The two data sets above have the following
characteristics:
1) The training sets are small-size with
redundant features. Specifically, in NSCLC, there
are only 196 samples with a vector of 37 dimensions
in each sample, while in WPBC, there are 198
samples with a vector of 34 dimensions in each
sample. In one hand, some features may be
irrelevant to the prognosis of the patient, in the other
hand, the statistics show a high correlation between
some features. Existence of redundant features will
decrease the performance of methods.
2) Hybrid type is existed in each sample
expressed by a vector, with nominal and numerical
type respectively. Therefore traditional classification
method is hard to work perfectly.
3) The class distribution is imbalanced, with the
ratio of 3:1 roughly. The traditional data mining
algorithm behaves undesirable in the instance of
imbalanced data sets. The class boundary can be
severely skewed towards the majority class which
means nothing to the application.
4) They are more likely to be non-linear
classification problems. It is difficult to find the
relationship between attributes and the outcome.
From the characteristics mentioned above, the
following method and strategies will be adopted in
improving SVM approach to fit the datasets.
2.2 Support Vector Machine
SVM is a useful technique for data classification. A
classification task usually involves separating data
into training and testing sets. Each instance in the
training set contains one “target value” (usually
called class labels) and several “attributes”. The goal
of SVM is to produce a model(based on the training
data) which predicts the target values of the test data
given only the test data attributes.
Given a training set of instance-label pairs
)(
ii
yx, ,
li ,...,1=
where
n
i
Rx ∈
and
}1,1{ −∈y
, the
SVM requires the solution of the following
optimization problem:
ε
,,
min
bw
∑
=
+
i
i
i
T
Cww
1
2
1
ε
ICECTT 2018 - 3rd International Conference on Electromechanical Control Technology and Transportation
14

Subject to
ii
T
i
bxwy
εφ
−>+ 1))((
,
0≥
i
ε
(1)
Function
)(x
φ
is used to map the training vectors
into a higher dimensional space. SVM finds a linear
separating hyper-plane with the maximal margin in
this higher dimensional space. C>0 is the penalty
parameter of the error term.
The above optimization problem (1) can be used
in a linear classification problem. But classification
problem is non-linear generally. In order to solve a
nonlinear classification problem, SVM first maps the
training data to another dot product space (called the
feature space) F via a nonlinear map, thus converting
the non-linear problem in the original space to linear
problems in the F-space. Gaussian RBF kernel
function is among the most commonly used kernels,
which is defined as follows:
0),||||*exp()(
2
,
>−−= gxxgxxK
jiji
(2)
After the kernel function is applied,The above
optimization problem can be expressed by kernel
function, which is defined as follows:
α
max
),(
2
1
)(
1,1
ji
m
ji
jiji
m
i
i
xxKyyw
∑∑
==
−=
αααα
Subject to
∑
=
=
m
i
ii
y
1
0
α
and C
i
≤≤
α
0 (3)
2.3 Modified Kernel function for
hybrid types
The kernel function in (2) is based on the
Euclidean distance between two pairwise samples.
However, when nominal features are faced, this kind
of kernel cannot be worked directly. The similarity of
two vector with nominal type data cannot defined as
Euclidean distance. For example, if one part of the
vector means the location of the cancer, such as
1,2,3, then we cannot find that 3 is far away from 1,
and it is near 2. So a new definition of distance
between two vectors should be given. In details, the
distance between 1 and 3 is equal to the distance
between 2 and 3. In conclusion, if the part of a vector
is nominal, then the distance is a constant which can
be predefined in the beginning when the number is
not equal, while the distance is zero when the number
is equal.
So the distance of two samples with nominal
feature can be redefined as follows:
∑
=
−=−
n
k
k
j
k
iji
xxxx
1
22
)(||||
⎪
⎩
⎪
⎨
⎧
=−
=−
0
1
k
j
k
i
k
j
k
i
xx
xx
(4)
where
k
x
is nominal.
2.4 Feature selection
In our cases of NSCLC, 37 features are used where
some features may be irrelevant to the prognosis of
the patient. Accordingly, we should find ways to
select the useful features to improve the prediction
performance as well as reduce the computational
complexity.
The existing feature selection algorithms can be
generally categorized as wrapper or filter methods
based on criterion functions used in searching for
informative features. In wrapper methods, the
performance of a learning algorithm is employed to
evaluate the goodness of selected feature subsets,
whereas in filter methods, criterion functions
evaluate feature subsets by their information content,
typically measure the cor-relativity of feature subsets
and outcome,having nothing to do with learning
algorithms. In most case, filter methods are
computationally much more efficient but perform
worse than wrapper methods (Xu, 2012).
In this paper, the wrapper method recursive
feature elimination algorithm(RFE) is adopted and
SVM classifier is used as a criterion function. The
SVM-RFE method is a sequential backward selection
process. It starts with a set of all features, and the
least important feature for the classification is
removed from the whole feature set iteratively
according to criteria function which is the sum square
of the weight vector W of all features in support
vectors in SVM model(Chakraborty, 2014).
It should be noted that the combination of the
features ranked ahead can obtain better performance
than the single one. Therefore, SVM-RFE algorithm
can select the combination of identification features.
2.5 Strategies for imbalanced data set
Considering the training instances of one class are
significantly outnumbered by those of the other class,
The class boundary learned by standard SVM can be
severely skewed towards the majority class. As a
result, the false-negative rate can be excessively high,
which may cause the classifier ineffective. Taking
account of the collection of each sample is not easy
to get, in order to get a balanced samples , the
synthetic minority oversampling technique (SMOTE)
is used to address this problem instead of under-
sampling majority class samples.
SMOTE method is a kind of oversampling
technique proposed by Chawla(Wu, 2003). The main
idea of SMOTE is artificially generate virtual
samples to minority class to over-sample the minority
class. For each minority sample, its k (which is set to
5 in SMOTE) nearest neighbors of the same class are
calculated, then some examples are randomly
selected from them according to the over-sampling
rate. After that, new synthetic samples are generated
Cancer Prognosis Prediction Using SVM for Hybrid Type and Imbalanced Data Sets
15
along the line between the minority samples and its
selected nearest neighbors. The process can be
described in formula(5):
)()1,0( xxrandxx
new
−×+=
(5)
Where rand(0,1) denotes random numbers
ranging from 0 to 1,
x
r
is one of the k-nearest.
SMOTE is suitable for samples with numerical
attributes. However, there is a hybrid type in each
sample expressed by a vector in the data set
mentioned above, with nominal and numerical type
respectively. Therefore, we need to modify the
formula(5) to fit hybrid types of feature. Suppose
each feature x is consist of two parts
},{
21
xxx = ,where
1
x are of nominal form and
2
x
are of numerical form, the formula(5) can be turned
as follows:
)]()1,0([)(
2221
xxrandxxrandx
new
−×+= U
(6)
Where
)(
1
xrand denotes the attribute value
which is randomly selected from all of the specific
attribute field.
3 EXPERIMENT RESULTS AND
ANALYSIS
We approach the prognostic prediction as a
classification problem. The following procedure with
proposed method is applied to NSCLC data set and
WPBC data set mentioned in section 2.
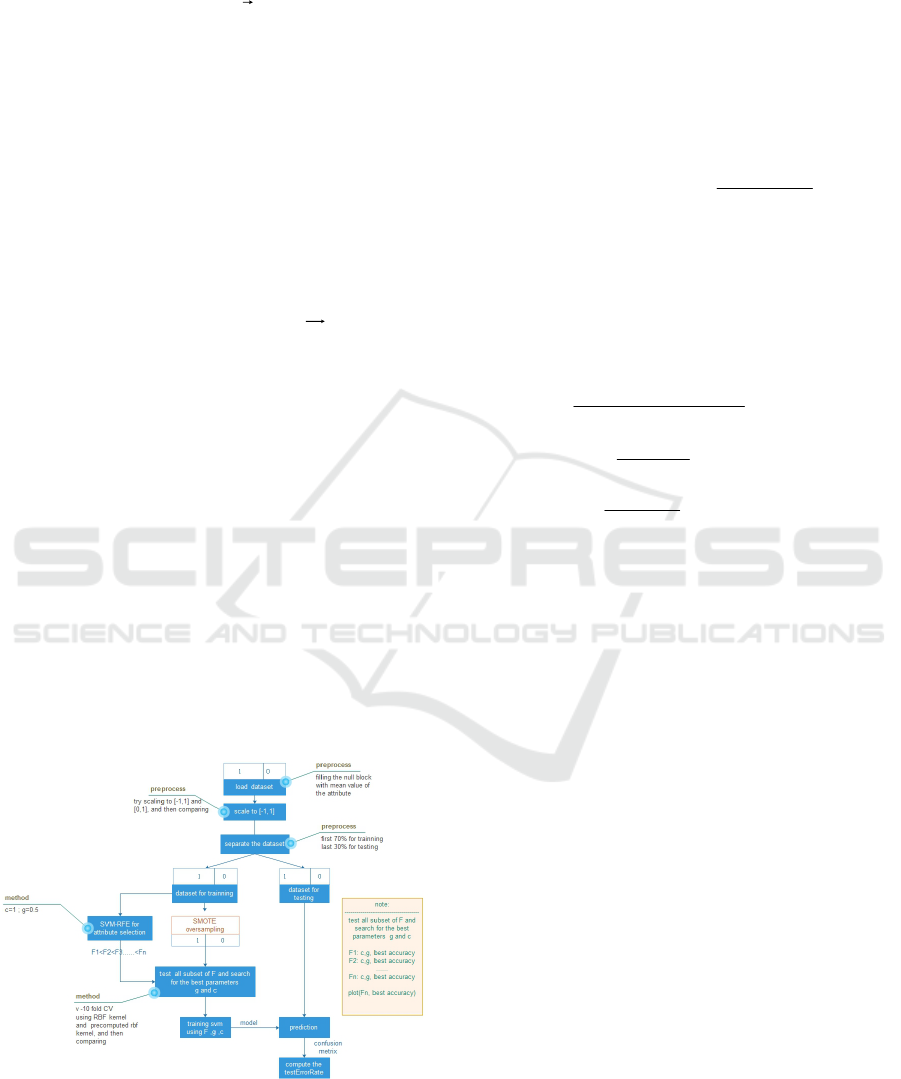
3.1 Experimental procedure
Fig 1 : The procedure of classification by SVM and using
SVM-RFE for attribute selection
Figure 1 shows the whole experimental procedure
and the detail is as following..
5) preprocessing
The standard simple imputation method(mean
among the values in the training set) is used to the
presence of missing values. In order to avoid
attributes in greater numeric ranges dominating those
in smaller numeric ranges, each numerical attribute is
scaled to range [0,1] when
1
max
=y and 0
min
=y by
formula(7).
min
minmax
min
minmax
)(: y
xx
xx
yyyxf +
−
−
×−=→
(7)
6) Classification
The RBF kernel is used as the number of features
is not very large. We use (9) and (10) to validate the
performance of classification instead of (8) because
(9) and (10) are more suitable for imbalanced data
problems.
FP
FN
T
P
T
N
TPTN
Acc
+++
+
=
(8)
FN
T
P
TP
Sn
+
=
(9)
F
P
T
N
TN
Sp
+
=
(10)
In the SVM model building phase, SVM-RFE
method is implemented to order the importance of
each attribute. We test all subset of collection F
computed by SVM-RFE, and search for the best
parameter pair(C,g) with grid-search method
iteratively. The best SVM model can be reached
with the best accuracy.
Finally, testing dataset is input into the model,
after computing, confusion matrix is obtained which
can be used to validate the performance of
classification.
3.2 Application to NSCLC and WPBC
We approach the prognostic prediction of
NSCLC and WPBC data sets as a classification
problem with two classes. The main objective is to
obtain the best predictive model to separate the two
classes with high performance, which can help
doctors and patients to make a treatment decision.
In NSCLC data set, the target value means
whether a patient can survive more than 3 years or
not, that is to say, the category can be defined as true
if the patient survives more than 3 years in the last
check-up, whereas false if the patient have died in 3
years after surgery. After sorting the patients
according to their onset time in NSCLC, front 70%
patients (137 patients) are used as training data and
remaining 30% patients (59 patients) as testing data.
ICECTT 2018 - 3rd International Conference on Electromechanical Control Technology and Transportation
16
While in WPBC, we separated “patients who
recurred in less than three years” from “patients who
were disease free more than three years”, the target
value means whether a patient would recurrent in 3
years or not. Front 70% patients are used as training
data and the remaining 30% as testing data.
3.3 Results and analysis
The first set of experiments is to evaluate the
performance of our proposed SMOTE. Table I and II
show the average accuracy, sensitivity and specificity
whether SMOTE is used or not.
As can be seen from the tables, we get relatively
higher training accuracy but lower testing accuracy
when SMOTE method is not used. Results
significantly biased majority class. the Sn parameter
is only 12.50% in NSCLC, 20% in WPBC, which
makes the classification of minority class samples
meaningless. All features in SVM model are support
vectors, which illustrate that over-fitting is very
serious.
Two sets of results using SMOTE method
demonstrate that when using testing samples, Sn
indicators has been greatly improved, and
classification accuracy is more balanced than no use
of SMOTE, which is displayed with Sn and Sp
indicators , in NSCLC tests, are 65.22% and 61.11%,
while in WPBC tests, are 74.62% and 86.57%
respectively. The experiments validate the
effectiveness of SMOTE strategy when faced with
imbalanced data set.
T
able 1 : Average accuracy whether use SMOTE on
NSCLC
Strateg
y
Training set as test samples Testing set as test samples
Acc Sn Sp Acc Sn Sp
No use
SMOT
E
99.40% 98.80% 100% 60% 12.50
%
91.67
%
use
SMOT
E
77.38% 61.90% 92.85
%
62.71
%
65.22
%
61.11
%
Table 2: Average accuracy whether use SMOTE on
WPBC
Strategy Training set Testing set
Acc Sn Sp Acc Sn Sp
No use
SMOTE
92.39
%
72% 100
%
76.31
%
20% 96.42
%
use
SMOTE
96.54
%
94% 100
%
79.59
%
74.62
%
86.57
%
The second set of experiments is launched to
evaluate the performance of attribute selection.
Training datasets are used to evaluate the importance
of attributes by using SVM-RFE. Grid-search is
employed to find out the best parameter pair(C,g) so
as to obtain the best subset of features with the
highest accuracy. Then we can use the best parameter
pair(C,g) and the best subset of features to train the
SVM classification model. The accuracy in each
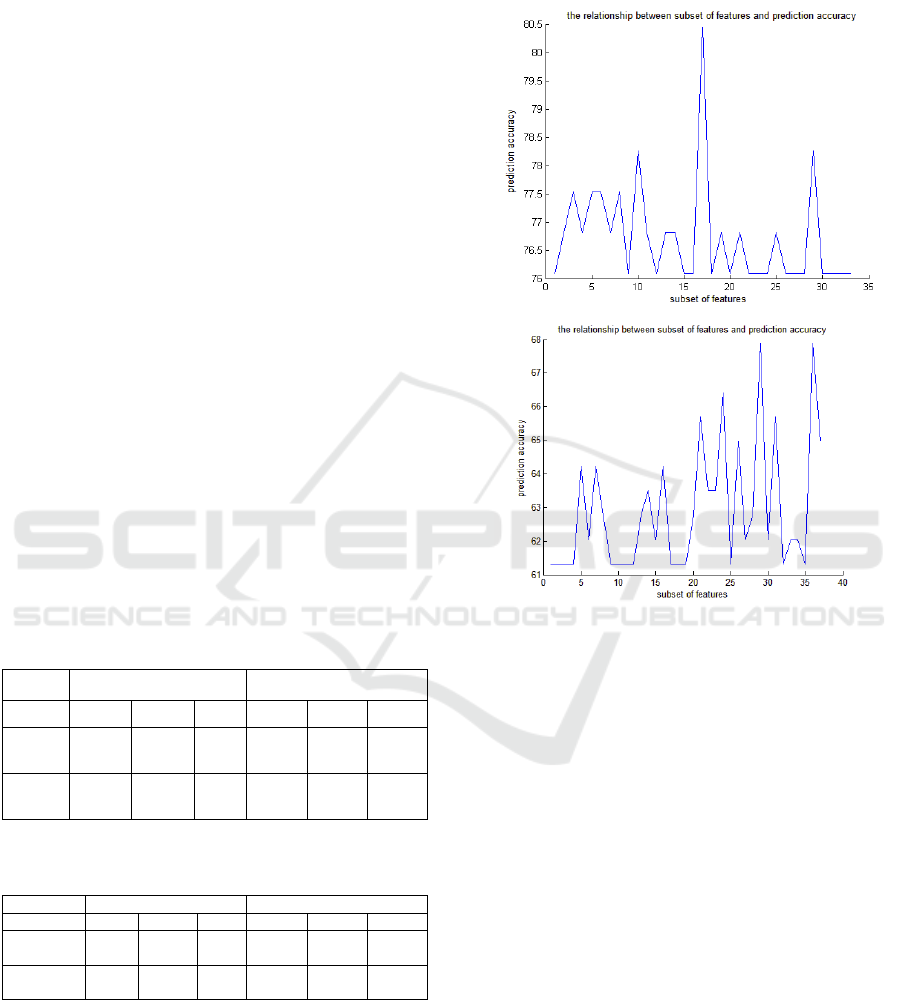
iteration is calculated and shown in Fig.2
Fig 2 :The relationship between a subset of features and
prediction accuracy of WBPC and NSCLC
From this figure it can be seen that we obtained
the optimal attribute subset of WBPC, the front 17
attributes of collection F , with the best accuracy of
80.43%. While worked on NSCLC, we obtained the
optimal attribute subset, the front 28 attributes of
collection F, with the best accuracy of 68.02% .These
results can demonstrate that the feature attribute
subset contains more discriminant information that
can greatly help prognosis prediction.
4 CONCLUSION
Prognosis prediction gives the clinician an unbiased
method to predict treatment effect instead of
traditional methods based on TNM staging. Machine
learning methods have been successfully applied to
the field of prognosis prediction. Its potential
appears to be extremely promising and is worthy of
further research.
Cancer Prognosis Prediction Using SVM for Hybrid Type and Imbalanced Data Sets
17

In this work, we have proposed a novel prognosis
prediction method based on SVM to create
personalized predictive models. Two datasets ,
NSCLC and WPBC, was selected which had small
size, high dimensional characteristics.
The novelty of this work is three-fold. Firstly, we
have modified the standard RBF kernel function in
SVM model to fit the test data, which have hybrid
types of feature. This modification makes the model
meet the needs of practical application. Secondly, we
propose the SMOTE strategy to deal with
imbalanced training-data problems. A series of
experiments have demonstrated the effectiveness of
SMOTE strategy when faced with imbalanced data
set. Thirdly, SVM-RFE is employed to extract
features collection of greatest impact on outcome.
The results demonstrate that with the help of SVM-
RFE, 17 out of 34 attributes of WBPC have been
selected, and 28 out of 37 attributes of NSCLC have
been selected which outperforms the over all attribute
collection.
So far, only SVM models have been employed.
In the future, we are preparing an extensive set of
tests by using other machine learning method, such
as random forest, deep learning, in the same manner
as the SVM procedure.
ACKNOWLEDGMENT
This work has been partially supported by the
National Natural Science Foundation of China(No
31371340) and the Natural Science Foundation of
Education Department of Anhui Province(No.
KJ2017A542)
REFERENCES
Z. H. Zhu, B. Y. Sun, Y. Ma, J. Y. Shao, H. Long, X.
Zhang, ... & P. Ling, “Three immunomarker support
vector machines–based prognostic classifiers for stage
IB non–small-cell lung cancer,” Journal of clinical
oncology, Vol.27, pp.1091-1099, 2009.
K. Jayasurya, G. Fung, S. Yu, C. Dehing-Oberije, D. De
Ruysscher, A. Hope, ... & A. L. A. J. Dekker,
“Comparison of Bayesian network and support vector
machine models for two-year survival prediction in
lung cancer patients treated with radiotherapy,”
Medical physics, Vol.37, pp.1401-1407, 2010.
G. Wu, E.Y. Chang, “Class-boundary alignment for
imbalanced dataset learning,” In ICML 2003
workshop on learning from imbalanced data sets II,
Washington, DC, pp. 49-56, August 2003.
W. N. Street, O. L. Mangasarian, W. H. Wolberg, “An
inductive learning approach to prognostic prediction,”
In ICML, Tahoe City, California, USA, pp.522-530,
July 1995.
D. Chakraborty, U. Maulik, “Identifying cancer
biomarkers from microarray data using feature
selection and semisupervised learning,” IEEE journal
of translational engineering in health and
medicine, Vol.2, pp.1-11, 2014.
X. Xu, Y. Zhang, L. Zou, M. Wang, ... & A. Li, “A gene
signature for breast cancer prognosis using support
vector machine,” In BMEI, Chongqing, China, pp.
928-931, October 2012
A. Rosenwald, G. Wright, W. C. Chan, “The use of
molecular profiling to predict survival after
chemotherapy for diffuse large-B-cell lymphoma,”
New England Journal of Medicine, Vol.346, pp.1937-
1947, 2002.
K. B. Duan, J. C. Rajapakse, H. Wang, et al. “Multiple
SVM-RFE for gene selection in cancer classification
with expression data,” NanoBioscience, IEEE
Transactions on, Vol.4, pp.228-234, 2005.
Xu T, Le T D, Liu L, et al. “Identifying cancer subtypes
from mirna-tf-mrna regulatory networks and
expression data,” PloS one, Vol.11(4): e0152792,
2016.
ICECTT 2018 - 3rd International Conference on Electromechanical Control Technology and Transportation
18
