
Proposing a Holistic Framework for the Assessment and Management of
Manufacturing Complexity through Data-centric and Human-centric
Approaches
Dominik Kohr
1
, Mussawar Ahmad
2
, Bugra Alkan
2
, Malarvizhi Kaniappan Chinnathai
2
,
Lukas Budde
1
, Daniel Vera
2
, Thomas Friedli
1
and Robert Harrison
2
1
University of St. Gallen, Institute of Technology Management, Dufourstrasse 40a, 9000 St. Gallen, Switzerland
2
Automation Systems Group, WMG, University of Warwick, CV4 7AL, Coventry, West Midlands, U.K.
M.Kaniappan-Chinnathai.1@warwick.ac.uk, lukas.budde@unisg.ch, D.A.Vera@warwick.ac.uk, thomas.friedli@unisg.ch,
Robert.Harrison@warwick.ac.uk
Keywords:
Complexity Management, Manufacturing Complexity, Production, Complexity Drivers.
Abstract:
A multiplicity of factors including technological innovations, dynamic operating environments, and globalisa-
tion are all believed to contribute towards the ever-increasing complexity of manufacturing systems. Although
complexity is necessary to meet functional needs, it is important to assess and monitor it to reduce life-cycle
costs by simplifying designs and minimising failure modes. This research paper identifies and describes two
key industrially relevant methods for assessing complexity, namely a data-centric approach using the informa-
tion theoretic method and a human-centric approach based on surveys and questionnaires. The paper goes on
to describe the benefits and shortcomings of each and contributes to the body of knowledge by proposing a
holistic framework that combines both assessment methods.
1 INTRODUCTION
Complexity is induced through a multiplicity of fac-
tors such as technological innovations, dynamic ope-
rating environments, and globalisation, and is belie-
ved to be one of the main causes of the current chal-
lenges in manufacturing, which are lengthy and cos-
tly system design processes, high life cycle costs,
and the existence of numerous failure modes (Alkan
et al., 2016a). According to (Schuh and Schwenk,
2001), complexity in the context of manufacturing,
can be grouped into two categories: i) internal and
ii) external. Internal complexity mainly occurs as
a result of high product variety due to the need to
meet market demands (Chinnathai et al., 2017; Al-
kan et al., 2016b), whereas external complexity re-
sults from market dynamics, political and institutional
complexities (G
¨
otzfried, 2013). There are three main
dimensions of internal complexity: i) structural (sta-
tic) complexity, ii) operational (dynamic) complexity
and iii) organisational complexity (Lindemann et al.,
2008). Structural complexity is related to the no-
tion of the architecture of the manufacturing system,
which is a network that is composed of a set of inte-
racting components/parts. Operational complexity is
driven by the manufacturing systems operational cha-
racteristics (Alkan et al., 2016a). Accordingly, a ma-
nufacturing system can be deemed complex, if its be-
haviours are difficult to describe or predict effectively
(Calinescu et al., 1998). It should be noted that, sy-
stem behaviours are often connected to the underlying
system architecture, hence dynamic complexity has a
strong positive correlation with structural manufactu-
ring system complexity (Sinha et al., 2017). Organi-
sational complexity, on the other hand, is manifested
in organisational structures, systems, processes and in
communication flows (Kohr et al., 2017).
An increase in complexity results in various pro-
blems including: production bottlenecks, reliability
issues and a lack of stability (Efthymiou et al., 2016).
Therefore the management of complexity is a non-
negligible aspect of an organisation’s operation and
thus, a strategy should be in place in order to remain
competitive (Budde et al., 2015). One of the key ele-
ments in effective management of complexity is its
assessment, which should provide a clear picture of
the underlying problems (Alkan et al., 2017). Howe-
ver, the diverse causes and effects of complexity are
hard to evaluate. Furthermore, the methods chosen to
manage them should be chosen based on the indivi-
86
Kohr, D., Ahmad, M., Alkan, B., Kaniappan Chinnathai, M., Budde, L., Vera, D., Friedli, T. and Harrison, R.
Proposing a Holistic Framework for the Assessment and Management of Manufacturing Complexity through Data-centric and Human-centric Approaches.
DOI: 10.5220/0006692000860093
In Proceedings of the 3rd International Conference on Complexity, Future Information Systems and Risk (COMPLEXIS 2018), pages 86-93
ISBN: 978-989-758-297-4
Copyright
c
2019 by SCITEPRESS – Science and Technology Publications, Lda. All rights reserved

dual complexity drivers of the company.
In this research, two complementary methods for
assessing manufacturing complexity have been des-
cribed in detail. The first method is an information
theoretic measure developed by (Frizelle and Wood-
cock, 1995) defining complexity as the uncertainty
in identifying the required information to define the
overall state of a manufacturing system. The second
method is a survey based approach identifying manu-
facturing/organisation complexity based on elicitation
and aggregation/pooling of expert opinions. The ad-
vantages and disadvantages of the selected methods
have been identified based on a number of criteria,
and the authors provide insight for future researchers
of this topic. The combined use of a human-centric
and a data-centric approach is further discussed and a
framework exploiting the advantages of both methods
is proposed.
2 INFORMATION THEORETIC
APPROACH
A practical approach to quantify complexity based on
an entropic model of a factory was developed by (Fri-
zelle and Woodcock, 1995). In this method, the follo-
wing assumptions are made: ”each sub-system is an
immigration-emigration process, reliability is inver-
sely proportional to complexity, cycle time is directly
dependant on complexity and complex processes have
more probability to become bottlenecks” (Calinescu
et al., 1998). Accordingly, two types of complexity
are identified, i.e. static and dynamic.
2.1 Static Complexity Assessment
Static complexity emerges as a result of the impact
of the product on the resource domain. It is defined
as the amount of information required to define the
state of the production system (S) and is formulated
as follows:
H
S
static
= −
M
∑
i=1
N
∑
j=1
p
i j
log
2
p
i j
(1)
where, M is the quantity of resource existing in sy-
stem S, N is the number of possible states for the i
th
resource and p
i j
is the probability of state j occurring
in resource i. In this context, states of resources can
be defined subjectively (e.g. busy, idle and breakdown
etc.). Static complexity is essentially a measure of the
inherent complexity of a production process within
a specified time-frame, usually a year. According to
(Calinescu, 2002), static complexity reduces when re-
dundant resources are removed and product design is
simplified.
2.2 Dynamic Complexity Assessment
In contrast to static complexity, dynamic complex-
ity is a measure of a system’s operational behaviour,
especially corresponding to queues. The sources of
dynamic complexity can vary from internal to exter-
nal sources, and identifying the underlying reason for
queueing helps determine the issues in a process. The
dynamic complexity of a facility is obtained using
an expression similar to that for structural complex-
ity, except that instead of calculating probabilities for
the states as scheduled, the probabilities are estimated
from actual observations.
H
S
dynamic
= −
M
∑
i=1
N
a
∑
j=1
p
0
i j
log
2
p
0
i j
(2)
where, the p
0
i j
indicates probability estimates based
on observed states and N
a
is the number of observed
(actual) states.
Depending on whether the state of an operation
was planned or unprecedented, they can be classified
as programmable (e.g. run, set-up, idle, etc.) and
non-programmable (e.g. rework, breakdown, etc.) re-
spectively. It should be noted that non-value adding
activities such as rework, can potentially create bottle-
necks in a system. Dynamic complexity assessment in
the information theoretic approach necessitates pro-
cess observations at regular time intervals for all va-
riants available. Therefore, the information from pro-
cess should be used to determine the various parame-
ters of assessment, such as frequency and time-frame
of the measurements.
2.3 The Application of Information
Theoretic Approach
In order to assist with the understanding of the in-
formation theoretic approach, a discrete-event simu-
lation study is performed by routing two different
product variants through a battery assembly system.
The assembly system in Figure 1 produces two bat-
tery variants, of which the variant A is designed to
provide high power, whereas the variant B provides
more energy, therefore, the number and type of cells,
bus-bars, cooling system vary widely. The assem-
bly line in consideration, however, is designed to ac-
commodate both variants. The components for both
variants are available at each of the stations and the
operator is instructed to fit the parts according to the
Proposing a Holistic Framework for the Assessment and Management of Manufacturing Complexity through Data-centric and
Human-centric Approaches
87
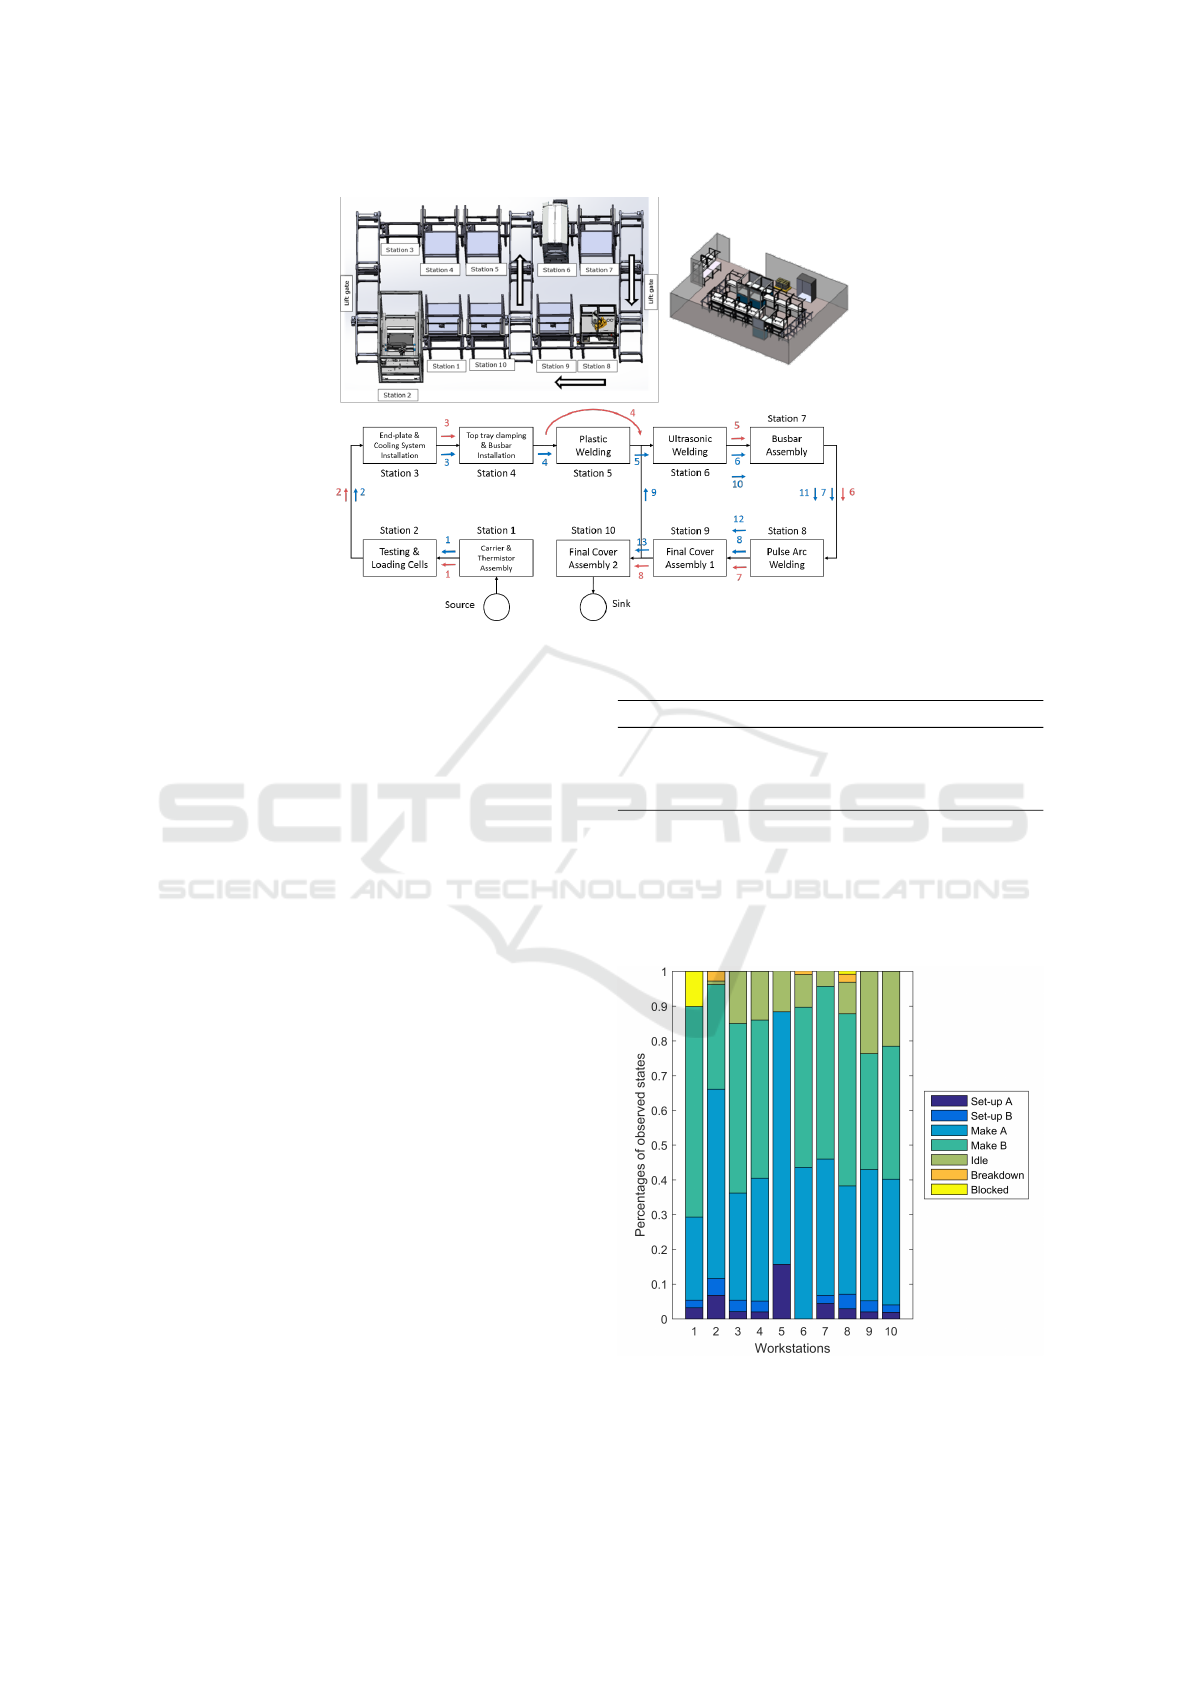
Figure 1: Battery assembly line layout.
work instructions. There are 7 manual stations which
are operated by 4 people. There are 3 automatic sta-
tions, which are for cell loading, ultrasonic welding
and pulse arc welding. As the variants are conveyed
through the line, an RFID reader reads the recipe pre-
sent on the pallet to determine the necessary opera-
tions that need to be performed at any station. The-
refore, the automatic stations change their configura-
tion depending on the variant in consideration. Some
of the stations do not perform any operation for the
considered variant. In this situation, the pallet is by-
passed through the station. The stations are reasona-
ble balanced to avoid potential queueing. The sig-
nificant tasks that are performed manually across the
seven stations are as follows: carrier assembly, cool-
ing system install, fastening the carrier plates, plas-
tic welding, bus-bar installation, visual inspection of
welds, assembly of insulator cover. To understand the
challenges in mixed model assembly of a battery as-
sembly line with the above-mentioned characteristics,
discrete-event simulations of the system was model-
led. Various parameters were introduced and tweaked
around to visualise the flow of the products in the sy-
stem.
The annual net demand for product variants are
defined as 500 for each, and the available time per
year is 1920 time unit (48 time unit per week). Pro-
duct and resource information are given in Table 1
and 2, respectively. It should be noted that, variant A
is run a week, followed by running variant B for two
weeks, thus, the set-up time is calculated depending
on the next product to run. The generic states for sta-
tic complexity is determined as: set-up, make and idle
and each state is defined by specifying the product as-
Table 1: Product information.
Variant A Variant B
Operations CA × (OP1A+ +OP3B+OP4B+OP5B
OP2A+OP3A+OP4A OP3B+OP4B+OP5B
+OP6A+OP7A+OP8A+ +2×OP6B+2×OP7B+
OP9A+OP10A) 2×OP8B+2×OP9B+OP10B)
Annual net demand 500 500
sociated to it (Table 2). Then, the probability of each
state is calculated (Table 3) and corresponding infor-
mation content is calculated in Table 4. Accordingly,
the static complexity of the assembly system is found
as 14.00325 bits.
Figure 2: The percentage distribution of observed states for
each workstation.
The operational complexity is analysed using dis-
COMPLEXIS 2018 - 3rd International Conference on Complexity, Future Information Systems and Risk
88
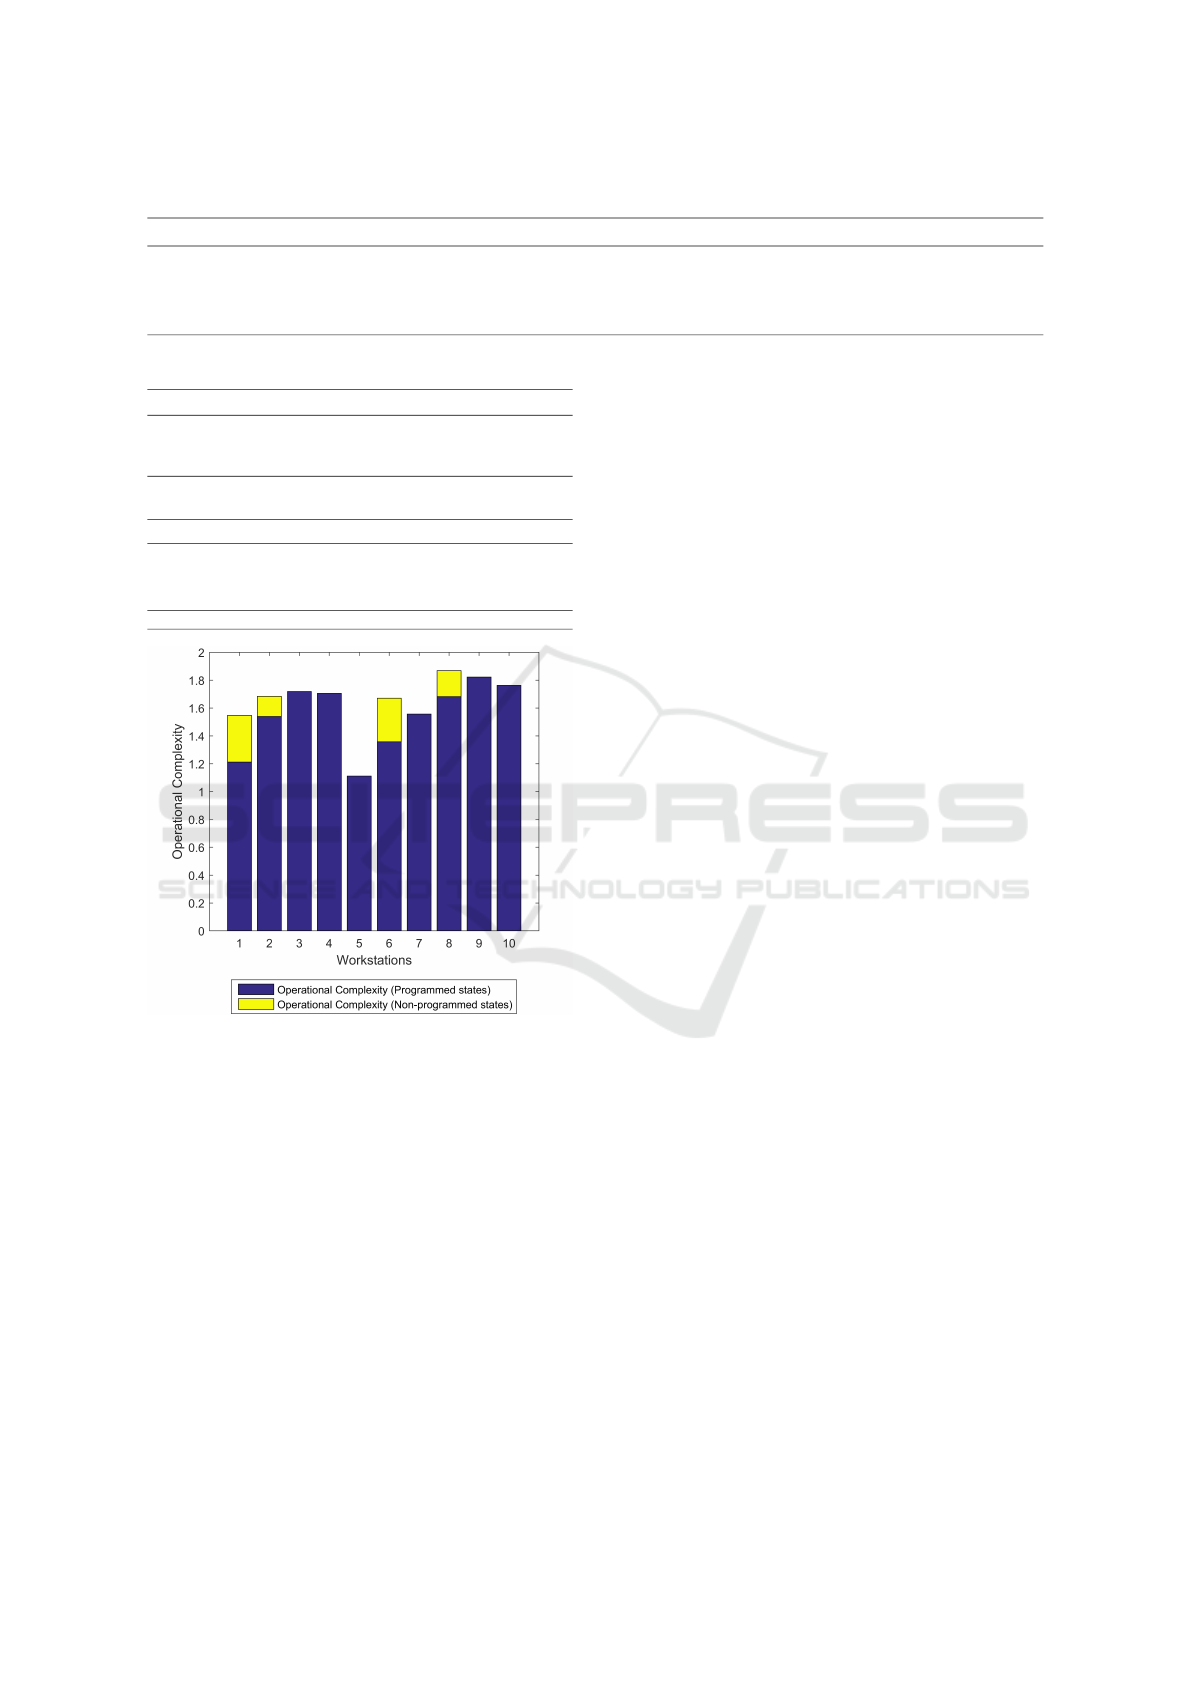
Table 2: Resource information (All values are given in time unit).
Stations
1 2 3 4 5 6 7 8 9 10
Operations OP1A OP1B OP2A OP2B OP3A OP3B OP4A OP4B OP5A OP6A OP6B OP7A OP7B OP8A OP8B OP9A OP9B OP10A OP10B
Set-up 0.3 0.2 0.6 0.4 0.2 0.3 0.2 0.3 0.6 0.0 0.0 0.4 0.2 0.3 0.4 0.2 0.3 0.2 0.2
Total set-up 4.0 5.4 9.6 12.8 2.4 9.6 3.2 8.0 8.8 0.0 0.0 6.4 6.4 4.8 12.8 3.2 9.6 2.4 6.4
Make 1.0 2.4 4.2 2.2 2.0 3.0 2.3 2.8 3.0 4.0 4.0 2.5 3.0 3.0 4.5 3.0 2.5 2.5 2.5
Total make 500 1200 2075 1075 1000 1500 1150 1400 1500 2000 4000.0 1250 3000 1500 4500 1500 2500 1250 2500
Capacity 1.0 2.0 2.0 2.0 1.0 4.0 3.0 4.0 3.0 2.0
Idle 210.6 322.6 658.0 633.8 411.2 420.0 490.5 402.4 573.9 36.2
Table 3: Resource/state probabilities.
Stations
1 2 3 4 5 6 7 8 9 10
Set-up A 0.002 0.005 0.001 0.002 0.005 0.000 0.003 0.003 0.002 0.001
Set-up B 0.003 0.007 0.005 0.004 0.000 0.000 0.003 0.007 0.005 0.003
Make A 0.260 0.540 0.260 0.299 0.781 0.260 0.217 0.195 0.260 0.326
Make B 0.625 0.280 0.391 0.365 0.000 0.521 0.521 0.586 0.434 0.651
Idle 0.110 0.168 0.343 0.330 0.214 0.219 0.255 0.210 0.299 0.019
Table 4: Static complexity calculation.
Stations
1 2 3 4 5 6 7 8 9 10
Set-up A 0.019 0.038 0.012 0.015 0.036 - 0.027 0.022 0.015 0.012
Set-up B 0.024 0.048 0.038 0.033 - - 0.027 0.048 0.038 0.027
Make A 0.505 0.480 0.505 0.521 0.278 0.505 0.478 0.460 0.505 0.527
Make B 0.424 0.514 0.530 0.531 - 0.490 0.490 0.452 0.523 0.403
Idle 0.350 0.432 0.529 0.528 0.476 0.480 0.503 0.472 0.521 0.108
Total (Resource) 1.322 1.513 1.615 1.628 0.790 1.475 1.526 1.454 1.602 1.078
Total (System) 14.003 bits
Figure 3: Operational complexity results of individual sta-
tions.
crete event simulation model due to the absence of ac-
tual production system data. A statistical model, e.g
normal distribution, is used to represent the demand
profile of both the variants and this introduces com-
plexity which can be compared to that introduced due
to market fluctuations. This significantly increases
the time spent for set-up for each variant on proces-
sors. Moreover, the machine breakdown parameters
(a negative exponential distribution is used for mean
time between failure (MTBF) and mean time to repair
(MTTR) behaviours) are also introduced in the auto-
matic stations, namely 2, 6 and 8. Therefore, two ad-
ditional non-programmable states, which are blocked,
breakdown (including repair) are also tracked during
the model run, for which the warm up time is 200 time
units and run time is 1920 time units. Please note that,
process-flow interruptions due to decision-making are
not modelled. Figure 2 shows the percentage of the
observed states per resource. The operational com-
plexity results in Figure 3 are obtained by analysing
the data gathered from the discrete event simulation
model. Accordingly, operational complexity of the
system is recorded as 16.224 bits, indicating that the
complexity occurring due to the programmable states
significantly contributes the overall operational com-
plexity.
3 SURVEY BASED APPROACH
In this section, based on an iterative cycle consisting
of literature research and discussions with practitio-
ners, a human-centric complexity assessment metho-
dology is developed to systematically identify the root
causes of complexity within an organizational struc-
ture.
3.1 Methodology
The actual methodology of the human-centric com-
plexity assessment is divided into three main steps.
3.1.1 Step 0: Identification of Complexity
Drivers
In order to develop the human-centric complexity as-
sessment methodology, a representative set of com-
plexity drivers were identified. Therefore, we con-
ducted an interview study and a literature review. The
survey draft was peer reviewed by experienced acade-
mics. A final review was carried out by industry ex-
perts of a reduced sample of nine manufacturing com-
panies to improve the survey validity. Based on the
feedback the items and the format of the questionnaire
were refined. As a result, a set of 20 complexity dri-
vers were defined in order to evaluate the individual
complexity situation of manufacturing companies. In
the end it served as a complexity measurement tool
in a benchmarking, with 137 participating companies
from different sectors of the manufacturing industry.
Proposing a Holistic Framework for the Assessment and Management of Manufacturing Complexity through Data-centric and
Human-centric Approaches
89

3.1.2 Step 1: Complexity Driver Analysis
The methodology of the survey based measurement
of complexity begins with the evaluation of the com-
plexity drivers regarding their influence on the com-
pany’s complexity. The survey encompasses com-
plexity drivers which affect the whole company. In
order to estimate the perceived complexity of the spe-
cific complexity drivers within the company, the par-
ticipants are asked to rate their influence based on a
self-assessment.
3.1.3 Step 2: Calculation of Complexity Index of
Complexity Driver k
In the second step, based on the rating of the parti-
cipants a normalized complexity index is calculated.
The complexity index of each driver k is the result of
the relation of the rating of the individual complexity
driver (CD
k
) and the sum of the rating over all com-
plexity drivers (
∑
n
1
CD
i
).
CI
k
=
CD
k
∑
n
1
CD
i
(3)
where:
• CI
k
: the relative rating of the complexity driver k,
• n: total number of complexity drivers,
• CD
i
: the rating of complexity driver i.
The normalization allows an evaluation which
complexity driver has the strongest influence on the
complexity within the company. Furthermore, for
evaluation purposes the complexity drivers are clus-
tered in product complexity, production complex-
ity, supply complexity, organizational complexity and
market complexity. Hence, an evaluation for each
complexity cluster can be conducted in order to de-
rive suitable methods for management.
3.1.4 Step 3: Validation of the Method
For validation purposes, the results of the assessment
tool’s complexity evaluation are discussed in a semi-
structured interview with the industry experts of the
international companies. In these interviews, an un-
derstanding is built up (based on participant percep-
tion) of the causes of complexity. Detailed discussi-
ons and explanations regarding the static and dynamic
factors reveal the challenges of the company to handle
the complexity. The results of the questionnaire and
the interview facilitate the assessment of the percei-
ved complexity of the company.
3.2 The Application of the Approach:
Precision Manufacturing (PM) Inc.
In the following, the survey based methodology is ap-
plied to the Precision Manufacturing Inc. to measure
their perceived complexity.
• Rating of the complexity drivers at PM Inc.: First,
the company rated the 19 complexity drivers on a
Likert scale (1-5). The result is shown in Table 5.
These numbers served as input for the next step in
order to normalize the complexity drivers.
• Calculation of complexity index of PM Inc.: In
this phase, each complexity driver is normalised,
as depicted in Table 5. The drivers with the big-
gest influence are product variety and program dy-
namics as well as number of customers and the
variety of customer demands.
• Validation of the complexity in a semi-structured
interview study: In a short semi-structured inter-
view, we build up an understanding of the main
complexity drivers of PM Inc. The focus of PM
Inc.’s complexity management approach is divi-
ded in product related and process related targets.
The company aims at reducing the product com-
plexity while at the same time extend their product
portfolio. Furthermore, lower production costs
and as well as a lower process variation needs to
be achieved.
Due to the high variety of customer demands and
the number of customers, PM Inc. needed to choose
suitable methods to lower the resulted high product
complexity. The activities aim at reducing the num-
ber of parts for specific existing products. By means
of modularization, the company achieved higher rates
of carry over parts and standardization within their ex-
isting product portfolio. Upcoming new products are
designed based on existing components and therefore
contribute to sustain a low number of parts.
Product variety, one of the complexity drivers with
the strongest impact on the company, also required
some changes within the assembly process. Through
modularization of the assembly process, PM Inc. ma-
naged to reduce their process variety and to establish
standardized processes. Employees designated to as-
sembly are now qualified to perform four to five pro-
ducts instead of being specialized to only one product.
Furthermore, employees from the production depart-
ment are involved in the design and approval process
of new products in order to lower the effort in the as-
sembly process.
COMPLEXIS 2018 - 3rd International Conference on Complexity, Future Information Systems and Risk
90

Table 5: Evaluation of complexity driver of Precision Engineering Inc.
Cluster Class Driver Rating Normalisation
1 Product complexity Product variety 5 0.8
(Product) Program dynamics 5 0.8
Product structure 3 0.05
Product technology dynamics 3 0.05
Total 16 0.06
2 Production complexity Number of value added steps 4 0.06
Production technology dynamics 3 0.05
Total 7 0.05
3 Supply chain complexity Number of suppliers 4 0.06
Uncertainty regarding delivery dates 3 0.05
Uncertainty regarding delivery quality 2 0.03
Number of distribution levels 3 0.05
Total 12 0.05
4 Organisational complexity Crosslingking degree of company processes 5 0.08
Organisational structure 4 0.06
Cooperate culture 2 0.03
Total 11 0.06
5 Market complexity Legal factors 1 0.02
Political conditions 2 0.03
Number of customers and customer groups 5 0.08
Variety of customer requirements 5 0.08
Volatility of customer demands 4 0.06
Competitive dynamics 3 0.05
Total 20 0.06
Total sum of complexity drivers 66
4 DISCUSSION
4.1 The Comparison of Two Methods
Up to this point, the authors have demonstrated the
two key sources of data for assessing complexity i.e.
objective sources such as data models/machine data
and subjective sources such as surveys and question-
naires. Furthermore, there has also been a description
as to how such sources can be transformed into tools
for assessing complexity. The data-centric approach
has been described through an example.
The data-centric complexity assessment approach
is defined in this research as a means to derive com-
plexity solely through objective means. In truth, this
is not entirely possible as any manufacturing com-
plexity assessment model is ultimately designed by
humans, and the factors that would be chosen for as-
sessment are at the whim of the assessor. Neverthe-
less, the sources of the data are inherently objective.
This means that for a given assessment model, pro-
vided the relevant factors have been included, a sys-
tems complexity can be assessed and then monitored
as changes are made to control or manage it. Further-
more, data-centric approaches for complexity asses-
sment can be automated, whether by extracting data
from models e.g. CAD, virtual engineering models,
or from shop-floor machines e.g. through operati-
onal equipment effectives (OEE) calculations. This
reduces the effort of assessing complexity and there-
fore reduces the barriers associated with managing it.
In addition, such objective approaches offer compari-
sons between designs (product, process or machine),
becoming an additional metric to aid selection.
On the other hand, data-centric approaches, by de-
coupling somewhat from the human, suffer from an
inability to provide an insight into the humans per-
ception of complexity. In fact, in some cases, the
data-centric approach offers a skewed human percep-
tion of complexity as it can be expression of what the
complexity data-model designer perceives should be
included within the assessment of complexity. This
very issue can result, perhaps most critically, in a sy-
stem being deemed to be un-complex from an ob-
jective point of view but highly complex from a user
or operational point of view. One way to extract this
information is to directly ask the user. This results in a
human-centric assessment of complexity. Complexity
assessment through this lens allows one to understand
what people deem to be the sources of complexity.
This is not only a useful source of information to be-
gin the management process, but also empowers those
people asked as they are able to see how concerns rai-
sed are being addressed. Furthermore, many of the
nuances that can be picked up from an interview or a
survey are difficult to obtain from data-centric appro-
aches as the latter is a model and therefore, by defini-
tion, a simplification of reality. Despite these benefits,
surveys and questionnaires can be time-consuming
and therefore complex exercises and there is often
more work that needs to be done to derive an asses-
sment.
Proposing a Holistic Framework for the Assessment and Management of Manufacturing Complexity through Data-centric and
Human-centric Approaches
91

4.2 A Framework for the Combined
Use of Human and Data Centric
Complexity Assessment
The authors have examined the literature and to date
they have been unable to identify works that appreci-
ate the need to assess and manage complexity. The
authors therefore believe there is a significant gap in
the literature that needs to be addressed to i) extend
the use of data models to assess complexity in in-
dustrial settings and ii) combine the use of data mo-
dels and questionnaires/surveys to assess and there-
fore manage complexity through multiple levels of
an organisation. To address this gap, a framework
is proposed (Figure 4) that combines human-centric
and data-centric complexity assessment in combina-
tion with complexity management.
The framework consists of three layers, with a sin-
gle research pillar spanning all layers. The lowest
layer of the framework is the Data Layer. This layer
represents the core data that exists in both the minds
of humans as well as that which exists in engineering
data models. This data could exist either internal or
external to the organisation as well as at almost any
level i.e. from management down to operators. As a
result of the myriad of data sources, it is necessary to
determine what data models and which people should
be interviewed in order to get the right data. For this
reason, the research pillar exists to help identify the
relevant sources or drivers of complexity. At the data
layer there exists the information necessary to assess
complexity, but at its most raw, unprocessed form. It
is necessary for some perspective to be added to the
data in order for it to be used to assess complexity.
Note that given a different perspective, a different cri-
teria concerning an enterprise could be synthesised.
Above the Data Layer there is the Assessment
Layer. At this layer the data sources are processed
so that complexity can be assessed. If the complexity
data source is a data model, then a complexity model
is used. On the other hand, if the perceptions of hu-
mans need to be used as a complexity assessor, then
the surveys or questionnaires are used on the relevant
stakeholders. At this layer again the research pillar
is fundamental in either applying or developing the
right complexity model for the relevant data source or
asking the right questions of the given stakeholder.
Based on the results of the assessment it is neces-
sary to apply the right management strategy. This is
carried out in the Management Layer. Note that at the
Data and Assessment Layers there is a distinction be-
tween the data sources and the assessment methods.
However, at the Management Layer the framework
aims to combine the complexity assessment to un-
derstand i) how they interact, and ii) to therefore im-
plement a management strategy that complements the
assessment. The research pillar is essential in deter-
mining what management strategies exist and which
are most relevant to the results derived from the com-
plexity assessment. Once the management strategy
has been identified it is implemented which closes the
loop and allows further data to be taken from the Data
Layer to understand the impact of the management
strategy. This impact is carried out through the evalu-
ation link from the Assessment layer to the Manage-
ment layer.
The framework brings together only the ele-
ments necessary to begin to combine data-centric and
human-centric complexity assessment methods. Ho-
wever, considerable work needs to be done to deter-
mine how the data should be combined i.e. the tri-
angle spanning the left and right columns in Figure 4
representing the two complexity assessment methods.
The authors’ are still investigating a robust method to
address this problem
5 CONCLUSION
This paper has described two of the key methods as-
sociated with deriving an assessment of complexity,
namely data-centric and human centric approaches.
These two classifications have not, to the best of the
knowledge of the authors, been used to categorise
complexity assessment methods previously. The re-
spective approaches are discussed and compared with
the strengths and weaknesses being identified. This
evaluation leads to the formation of an entirely no-
vel framework that combines the two assessment met-
hods into one. As well as assessing complexity, the
framework is holistic in that it appreciates the need
to manage complexity, close the loop between asses-
sment and management, and for continuously resear-
ching to identifying new complexity sources, asses-
sment methods, and management methods. The aut-
hors strongly believe that the combination of the two
assessment methods are complementary and funda-
mental to complexity management. This idea is to
be tested as part of the case study with the industrial
partner and is on-going work.
ACKNOWLEDGEMENT
The authors gratefully acknowledge the supports of
the Commission for Technology and Innovation in
Switzerland (CTI) through the project Complexity 4.0
(ref: 18993.1), the UK EPSRC through the KDCM
COMPLEXIS 2018 - 3rd International Conference on Complexity, Future Information Systems and Risk
92
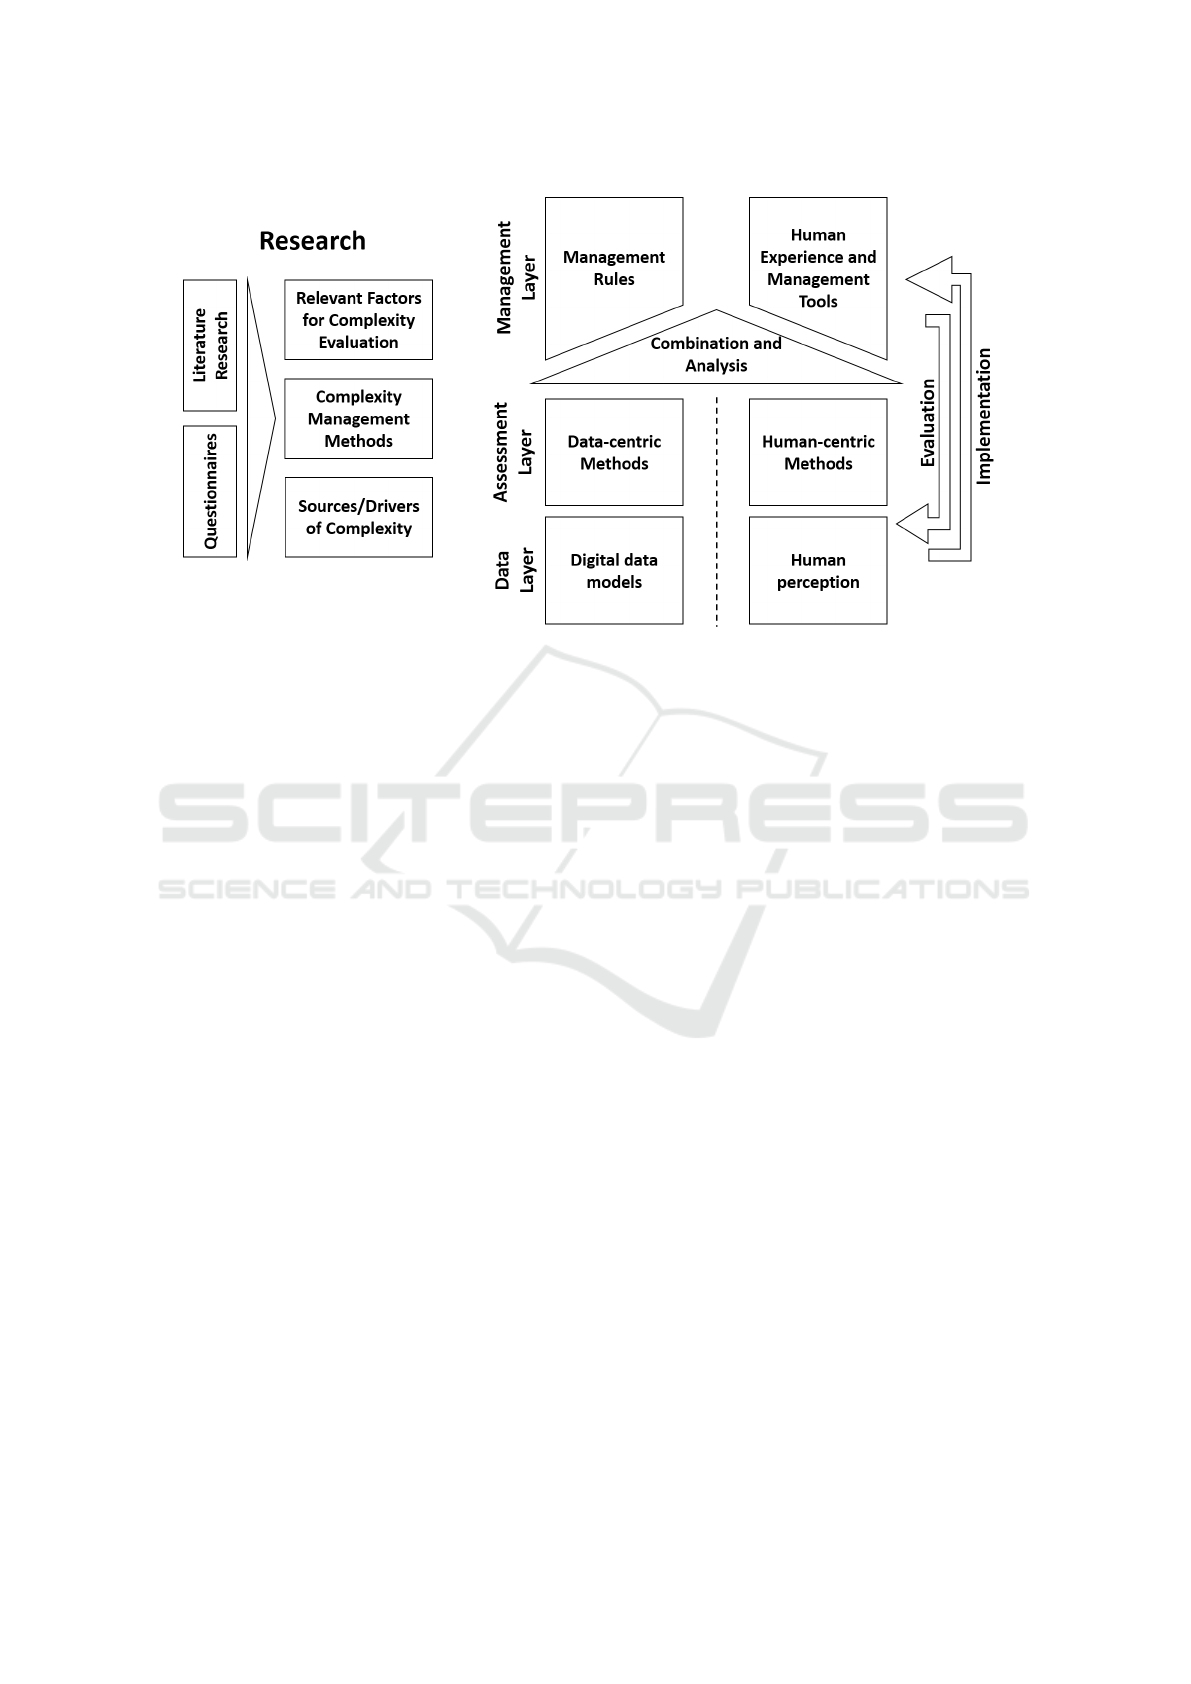
Figure 4: Holistic Framework for combining human-centric and data-centric complexity assessment for management.
research project, and the Innovate UK through the
AMPLiFII project (ref: 102490).
REFERENCES
Alkan, B., Vera, D., Ahmad, M., Ahmad, B., and Harrison,
R. (2016a). Design evaluation of automated manufac-
turing processes based on complexity of control logic.
Procedia CIRP, 50:141–146.
Alkan, B., Vera, D., Ahmad, M., Ahmad, B., and Harri-
son, R. (2016b). A model for complexity assessment
in manual assembly operations through predetermined
motion time systems. Procedia CIRP, 44:429–434.
Alkan, B., Vera, D., Kaniappan Chinnathai, M., and Harri-
son, R. (2017). Assessing complexity of component-
based control architectures used in modular automa-
tion systems. International Journal of Computer and
Electrical Engineering, 9(1):393–402.
Budde, L., Nagler, O., and Friedli, T. (2015). A method to
set up a complexity index to improve decision-making
performance. Procedia CIRP, 36:53–58.
Calinescu, A. (2002). Manufacturing complexity: An inte-
grative information-theoretic approach. PhD thesis,
University of Oxford.
Calinescu, A., Efstathiou, J., Schirn, J., and Bermejo, J.
(1998). Applying and assessing two methods for me-
asuring complexity in manufacturing. Journal of the
Operational Research Society, 49(7):723–733.
Chinnathai, M. K., Alkan, B., and Harrison, R. (2017). Con-
vertibility evaluation of automated assembly system
designs for high variety production. Procedia CIRP,
60:74–79.
Efthymiou, K., Mourtzis, D., Pagoropoulos, A., Papakostas,
N., and Chryssolouris, G. (2016). Manufacturing sy-
stems complexity analysis methods review. Internati-
onal Journal of Computer Integrated Manufacturing,
29(9):1025–1044.
Frizelle, G. and Woodcock, E. (1995). Measuring complex-
ity as an aid to developing operational strategy. Inter-
national Journal of Operations & Production Mana-
gement, 15(5):26–39.
G
¨
otzfried, M. (2013). Managing Complexity Induced
by Product Variety in Manufacturing Companies.
Complexity Evaluation and Integration in Decision-
Making. PhD thesis, University of St. Gallen.
Kohr, D., Budde, L., and Friedli, T. (2017). Identifying
complexity drivers in discrete manufacturing and pro-
cess industry. Procedia CIRP, 63:52–57.
Lindemann, U., Maurer, M., and Braun, T. (2008). Struc-
tural Complexity Management: An Approach for the
Field of Product Design.
Schuh, G. and Schwenk, U. (2001). Produktkomplexit
¨
at
managen–strategien. Methoden, Tools, M
¨
unchen,
Wien.
Sinha, K., Shougarian, N. R., and de Weck, O. L.
(2017). Complexity management for engineered sy-
stems using system value definition. In Complex Sy-
stems Design & Management, pages 155–170. Sprin-
ger.
Proposing a Holistic Framework for the Assessment and Management of Manufacturing Complexity through Data-centric and
Human-centric Approaches
93
