
Dimensionality Reduction with Evolutionary Shephard-Kruskal
Embeddings
Oliver Kramer
Department of Computer Science, University of Oldenburg, Oldenburg, Germany
Keywords:
Dimensionality Reduction, Iterative Learning, Evolutionary Optimization, Shephard-Kruskal Measure.
Abstract:
This paper introduces an evolutionary iterative approximation of Shephard-Kruskal based dimensionality re-
duction with linear runtime. The method, which we call evolutionary Shephard-Kruskal embedding (EvoSK),
iteratively constructs a low-dimensional representation with Gaussian sampling in the environment of the la-
tent positions of the closest embedded patterns. The approach explicitly optimizes the distance preservation
in low-dimensional space, similar to the objective solved by multi-dimensional scaling. Experiments on a
small benchmark data set show that EvoSK can perform better than its famous counterparts multi-dimensional
scaling and isometric mapping and outperforms stochastic neighbor embeddings.
1 INTRODUCTION
Dimensionality reduction (DR) is the important prob-
lem class in machine learning that offers methods
for reducing the data dimensionality to a reason-
able degree, e.g., for preprocessing in classifica-
tion or for data space visualization (Lee and Verley-
sen, 2007). Many DR methods compute a point-
wise embedding of high-dimensional patterns based
on different criteria. Prominent examples are princi-
pal component analysis (PCA) (Jolliffe, 1986), ker-
nel PCA (Sch
¨
olkopf et al., 1998), multi-dimensional
scaling (MDS) (Borg and Groenen, 2005), isomet-
ric mapping (ISOMAP) (Tenenbaum et al., 2000),
and t-distributed stochastic neighbor embedding (t-
SNE) (van der Maaten and Hinton, 2008). With grow-
ing data set sizes, methods are required that scale well
with the number of patterns.
In dimensionality reduction we seek for low-
dimensional representations z
i
∈ R
q
for each high-
dimensional pattern x
i
∈ R
d
with i = 1, . . . , N and d <
q without losing essential information. This infor-
mation can be distances between patterns, or neigh-
borhoods of patterns, which should be maintained in
low-dimensional space. This paper presents an ap-
proach that iteratively constructs a low-dimensional
representation with evolutionary Gaussian sampling
for minimizing the Shepard-Kruskal measure in each
step.
The paper is structured as follows. Section 2 gives
an introduction to related work while introducing a
short taxonomy of iterative evolutionary embedding
methods. Section 3 introduces the novel EvoSK ap-
proach. It is experimentally evaluated in Section 4
and compared to MDS, ISOMAP, and t-SNE. Con-
clusions are drawn in Section 5 with an overview of
prospective future work.
2 RELATED WORK
Many DR algorithms have been introduced that pro-
cess data sets pattern by pattern. They are also known
as incremental or streaming methods. But for the
class of DR methods, only few variants have been in-
troduced in the past, e.g., a variant of PCA that is able
to process streaming data (Mitliagkas et al., 2013).
MDS computes the embeddings based on a Cholesky
or singular value decomposition resulting in eigenval-
ues, whose eigenvectors with the q-largest eigenval-
ues are the low-dimensional embeddings.
The line of research on methods that iteratively
construct a solution with stochastic sampling has
recently been established (Kramer, 2015a; Kramer,
2015b). It began as variant of unsupervised regres-
sion. Figure 1 shows a small taxonomy of this
emerging field. All variants have in common that
they iteratively construct an embedding based on ran-
domly sampling in the environment using Gaussian
sampling. The latent positions of the closest em-
bedded patterns are the origin of this sampling pro-
478
Kramer, O.
Dimensionality Reduction with Evolutionary Shephard-Kruskal Embeddings.
DOI: 10.5220/0006645904780481
In Proceedings of the 7th International Conference on Pattern Recognition Applications and Methods (ICPRAM 2018), pages 478-481
ISBN: 978-989-758-276-9
Copyright © 2018 by SCITEPRESS – Science and Technology Publications, Lda. All rights reserved

[e.g. Shepard-Kruskal,
co-ranking]
mapping
unsupervised regression
DR measures
supervised regression
iterative evolutionary embeddings
[e.g. UKR, UNN]
[e.g. nearest neighbors]
Figure 1: Taxonomy of iterative evolutionary embedding.
cess. Methods from the three branches differ in
the selection criterion they employ. The left part of
the taxonomy is based on the reconstruction error
of unsupservised regression. Unsupervised regres-
sion maps patterns from the low-dimensional space
to the high-dimensional space using a multi-label re-
gression method (Meinicke et al., 2005). The op-
timization problem is to optimally reconstruct the
high-dimensional patterns. Unsupervised nearest
neighbors (Kramer, 2015b) employs nearest neigh-
bor regression, while unsupervised kernel regression
(UKR) is based on the Nadaraya-Watson estimator.
The middle part of the taxonomy is based on the
optimization of embeddings using label information.
Instead of the reconstruction error, it makes use of the
regression error, i.e., the low-dimensional patterns are
optimized to achieve the same regression error as their
high-dimensional counterparts (Kramer, 2015a).
The right part of the taxonomy is new and the first
approach in this line of research is introduced in this
paper. We propose the employment of DR measures
like the Shephard-Kruskal measure or the co-ranking
matrix (Hastie et al., 2009).
3 SHEPHARD-KRUSKAL
EMBEDDINGS
This section introduces the evolutionary Shephard-
Kruskal embedding approach, which is called EvoSK
in the following. Similar to the approaches that have
been introduced for the iterative evolutionary embed-
dings of unsupervised regression, the mechanism is
introduced inductively.
Let X = [x]
N
i=1
be the patterns that have to be em-
bedded. The first pattern x
1
is embedded at an arbi-
trary position in latent space, e.g., at the origin z
1
= 0.
At this time the current latent matrix is Z = [z
1
] with
a corresponding pattern matrix X = [x
1
]. Now, let
x
1
, . . . , x
n−1
be the sequence of embedded patterns
with corresponding latent positions z
1
, . . . , z
n−1
. Pat-
tern x
n
with n ≤ N is embedded by first searching for
the closest embedded pattern
x
∗
= arg min
x=x
n−k
,...,x
n
kx
n
− xk
2
(1)
among the last k embedded patterns X = [x
j
]
n−1
j=n−k
.
We call parameter k window size in the following.
Based on its latent position z
∗
, µ candidate positions
z
∗
1
, . . . , z
∗
µ
are sampled using the Gaussian distribu-
tion
ˆ
z
l
∼ N (0, σ) with
z
∗
l
= z
∗
+
ˆ
z
l
(2)
for l = 1, . . . , µ. For preservation of distances between
patterns in low-dimensional space the standard devi-
ation σ = kx
n
− x
∗
k is used for the sampling process,
i.e., large distances result in large σ, small distances
in sample close to z
∗
.
From the µ candidate latent positions, the one
leading to the lowest Shepard-Kruskal error E
sk
is se-
lected. E
sk
measures the maintenance of distances in
the low dimensional space (Hastie et al., 2009). Let
D
X
be the distance matrix in data space and D
Z
be the
distance matrix in the low-dimensional space. Both
contain the pairwise Euclidean distances and are con-
sidered as normalized. The Shepard-Kruskal measure
is defined as the norm of the differences of the nor-
malized distance matrixes
E
sk
= kD
X
− D
Z
k
2
F
. (3)
A low Shepard-Kruskal measure is preferable. For
example, if distances are completely preserved, the
Shepard-Kruskal measure is zero.
Figure 1 shows the pseudocode of the EvoSK ap-
proach. The search for the closest pattern in Line 4 re-
duces to a constant runtime, if window size k does not
depend on N, as the number of considered compar-
isons in high-dimensional space does not grow with
the number of embedded patterns. Further, the inner
loop of µ sampling steps obviously also require a con-
stant time.
Algorithm 1: Pseudo-code of EvoSK.
Require: X, µ
Z = [0], X = [x
1
]
for n = 2 to N do
choose x
n
select closest pattern x
∗
among X = [x
j
]
n−1
j=n−k
with latent position z
∗
for l = 1 to µ do
z
∗
l
∼ σ · N (z
∗
, 1) with σ = kx
n
− x
∗
k
2
end for
choose z
n
= arg min
z=z
∗
1
,...,z
∗
µ
E([Z, z])
Z = [Z, z
n
], X = [X, x
n
]
end for
return Z
For k = n the approach has quadratic runtime of
O(N
2
). If data structures are applicable like ball-trees
Dimensionality Reduction with Evolutionary Shephard-Kruskal Embeddings
479
that allow a neighborhood search in log(N) the run-
time reduces to O(N log N). For a constant window
size of k the search can be performed in k or even
log(k) steps offering a linear runtime of O(N).
4 EXPERIMENTS
In this section, we analyze the DR pipeline evolu-
tion experimentally on a small set of benchmark prob-
lems. For this sake, we concentrate on an experimen-
tal comparison between EvoSK, MDS, ISOMAP, and
t-SNE. The control methods and data sets (with ex-
ception of the Wind data set) are based on SCIKIT-
LEARN (Pedregosa et al., 2011).
Table 1 shows the Shephard-Kruskal measure E
sk
of EvoSK with best, mean, standard deviation, and
worst values of 100 runs and a comparison to MDS,
ISOMAP, and t-SNE. The experiments use a window
size of k = 50 and all data sets use the first N = 200
patterns. The results show that EvoSK performs bet-
ter in mean than MDS and ISOMAP on Digits, and
on Friedman. On Image, only some runs, in partic-
ular the best one of EvoSK is better than the MDS
and the ISOMAP result. However, on Housing and
on the Wind data set, MDS and ISOMAP outper-
form EvoSK, while t-SNE is clearly outperformed by
EvoSK on all data sets.
Our further experimental analysis has shown that
the choice of k has no significant impact on the
achieved Shephard-Kruskal measure as of 10% of N.
Obviously the orientation to the last few embedded
patterns is sufficient, as the sampling process is more
important for the decision, at which position the pat-
terns should be embedded.
80
60
0 5 10
70
E
sk
15 2520 30
50
40
μ
EvoSK
(a) Digits
25
0 5 10
35
E
sk
15 2520 30
15
5
μ
EvoSK
(b) Image
Figure 2: Analysis of number µ of sampling steps in each
iteration on the data sets Digits and Image.
An analysis of the search effort invested into the
sampling process shows Figure 2. For the data sets
Digits and Image, E
sk
is shown depending on the
number µ of sampling steps in each iteration. It turns
out that E
sk
is decreasing significantly with increasing
µ. Few more sampling steps are beneficial and more
lead to less improvements. The best and worst E
sk
de-
velopments deviate from the mean only slightly on all
data sets indicating that this dependency is significant.
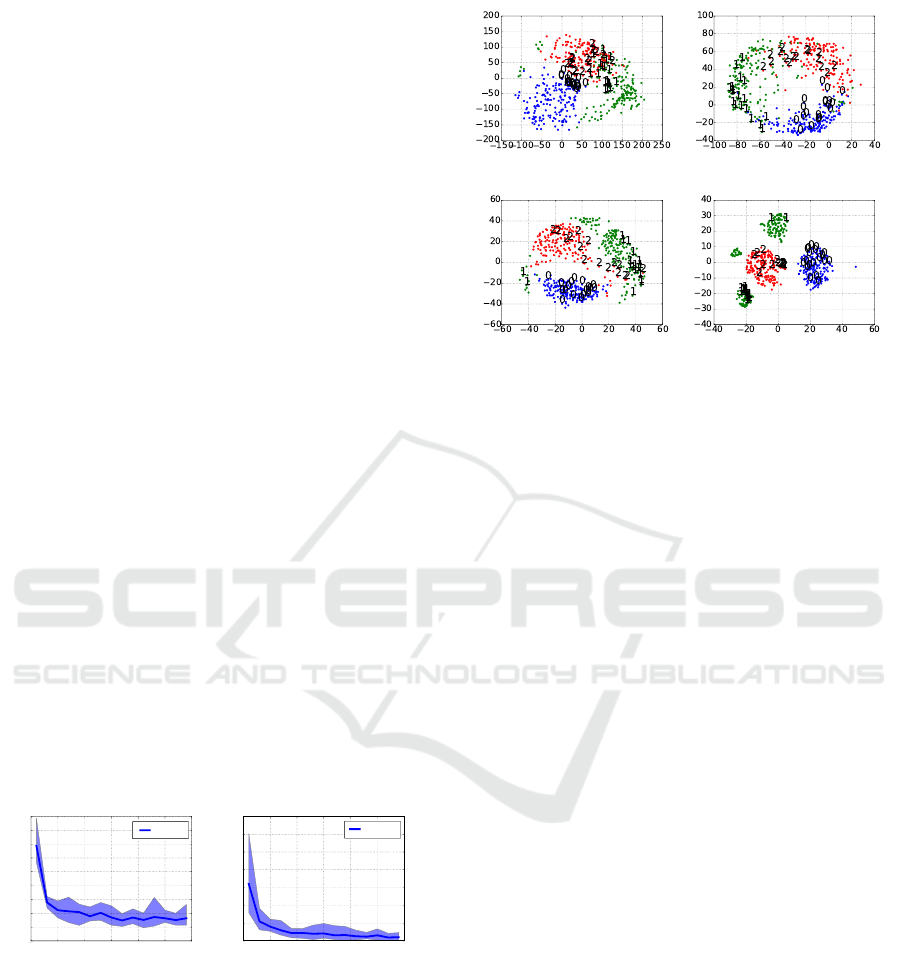
(a) EvoSK, µ = 2 (b) EvoSK, µ = 10
(c) MDS (d) t-SNE
Figure 3: Visualization of embeddings of the Digits data set
with EvoSK employing µ = 2, 10 sampling steps in compar-
ison to MDS and t-SNE.
In Figure 3 we visualize the embeddings of
EvoSK. The plots show a comparison between the
embeddings of EvoSK with the sampling sizes µ =
2, 10 with MDS and t-SNE on the Digits data set
with three classes and N = 537 patterns to a two-
dimensional space. Colors and figures indicate the la-
bel assignment, i.e., the three digits the data contains.
The plots show that EvoSK is clearly able to separate
patterns from different classes with only few outliers.
The observation that spending more effort into the
search process is advantageous can also be confirmed
by the visual inspection of the embeddings. For µ = 2,
i.e., only two alternatives in each step, the worst low-
dimensional representation is computed with overlap-
ping regions, while the embeddings with µ = 10 have
similar shapes like the MDS result. t-SNE computes
low-dimensional representations with completely dif-
ferent shapes and three small areas for digit ’1’.
EvoSK has numerous advantages in comparison
to MDS and t-SNE. With only few and uncomplicated
adaptations, it is applicable to large data sets. For
embedding a novel pattern, the search for the clos-
est embedded pattern lasts longer with growing data
sets. The search can be accelerated with efficient data
structures like ball-trees. A stochastic shortcut is to
restrict the neighborhood search by sampling µ times
from the embedded patterns and choosing the closest
pattern x
∗
with counterpart z
∗
.
Further, EvoSK can easily be employed to incom-
plete data sets. Let x
−i
be a pattern that has to be
embedded with missing value x
i
. The best position
for y can still be computed ignoring the dimensions,
in which parts are missing, e.g., we define the error as
E
sk,−i
= kD
X,−i
− D
Z,−i
k
2
F
, (4)
ICPRAM 2018 - 7th International Conference on Pattern Recognition Applications and Methods
480

Table 1: Experimental analysis of EvoSK and control methods on benchmark problem set mapping to a q = 2-dimensional
space in terms of E
sk
. The best results in each line are shown in bold numbers.
EvoSK control
problem best mean dev worst MDS ISOMAP t-SNE
Digits 44.17 45.25 0.89 46.52 48.50 46.91 100.01
Housing 0.27 0.63 0.26 1.01 0.08 0.36 33.52
Image 4.09 4.54 0.34 5.10 4.24 4.30 32.89
Friedman 82.14 83.45 1.63 86.66 92.07 91.65 140.52
Wind 22.32 26.52 3.23 30.17 16.11 14.41 84.98
where D
X,−i
and D
Z,−i
are the distance matrices with
the i-th columns and rows missing.
5 CONCLUSIONS
The iterative evolutionary variant of MDS approx-
imates a low-dimensional representation that mini-
mizes the Shepard-Kruskal measure, i.e., optimizes
the maintenance of distances of the high-dimensional
space in its low-dimensional counterpart. This op-
timization objective is inspired by MDS. EvoSK is
an approximation heuristic with random elements, in
particular based on Gaussian sampling. The outcome
of the DR result depends on the order the patterns are
embedded. But the randomness is the key property to
achieve a linear runtime.
In the line of research of iterative constructive em-
beddings, EvoSK is the first variant that considers
only the last n embedded patterns resulting in linear
runtime and turning out to be sufficient for minimiza-
tion of the Shephard-Kruskal measure. Experimen-
tal results have shown that the introduced variants can
compete with the related method MDS, ISOMAP, and
with t-SNE.
The runtime of EvoSK is linear when employing
a window size k. For a choice of k = 50, the embed-
dings turn out to show good characteristics. But the
results show that EvoSK significantly depends on the
effort µ invested into the sampling process.
REFERENCES
Borg, I. and Groenen, P. (2005). Modern Multidimensional
Scaling: Theory and Applications. Springer.
Hastie, T., Tibshirani, R., and Friedman, J. (2009). The
Elements of Statistical Learning. Springer, Berlin.
Jolliffe, I. (1986). Principal component analysis. Springer
series in statistics. Springer, New York.
Kramer, O. (2015a). Supervised manifold learning with in-
cremental stochastic embeddings. In European Sym-
posium on Artificial Neural Networks (ESANN), pages
243–248.
Kramer, O. (2015b). Unsupervised nearest neighbor re-
gression for dimensionality reduction. Soft Comput.,
19(6):1647–1661.
Lee, J. A. and Verleysen, M. (2007). Nonlinear Dimension-
ality Reduction. Springer.
Meinicke, P., Klanke, S., Memisevic, R., and Ritter, H.
(2005). Principal surfaces from unsupervised kernel
regression. IEEE Transactions on Pattern Analysis
and Machine Intelligence, 27(9):1379–1391.
Mitliagkas, I., Caramanis, C., and Jain, P. (2013). Memory
limited, streaming PCA. In Advances in Neural Infor-
mation Processing Systems (NIPS), pages 2886–2894.
Pedregosa, F., Varoquaux, G., Gramfort, A., Michel, V.,
Thirion, B., Grisel, O., Blondel, M., Prettenhofer,
P., Weiss, R., Dubourg, V., Vanderplas, J., Passos,
A., Cournapeau, D., Brucher, M., Perrot, M., and
Duchesnay, E. (2011). Scikit-learn: Machine learning
in Python. Journal of Machine Learning Research,
12:2825–2830.
Sch
¨
olkopf, B., Smola, A., and Mller, K.-R. (1998). Nonlin-
ear component analysis as a kernel eigenvalue prob-
lem. Neural Computation, 10(5):1299–1319.
Tenenbaum, J. B., Silva, V. D., and Langford, J. C. (2000).
A global geometric framework for nonlinear dimen-
sionality reduction. Science, 290:2319–2323.
van der Maaten, L. and Hinton, G. E. (2008). Visualiz-
ing high-dimensional data using t-sne. Journal of Ma-
chine Learning Research, 9:2579–2605.
Dimensionality Reduction with Evolutionary Shephard-Kruskal Embeddings
481
