
Road Surface Scanning using Stereo Cameras for Motorcycles
Joerg Deigmoeller
1
, Nils Einecke
1
, Oliver Fuchs
2
and Herbert Janssen
1
1
Honda Research Institute Europe, Carl-Legien-Strasse 30, 63073 Offenbach, Germany
2
Honda R&D Europe (Germany), Carl-Legien Strasse 30, 63073 Offenbach, Germany
Keywords:
Stereo, Depth Estimation, Plane Fitting, Road Surface Reconstruction, Motorcycle, Suspension Adaptation.
Abstract:
Active and semi-active suspension systems for vehicles became quite popular in the recent years as they
allow for a smoother and safer ride compared to conventional suspension systems. The performance of an
active/semi-active suspension system can be even more improved if the road condition in front of the vehicle
is known. Currently only a few luxury cars combine fully active suspension with stereo cameras for such a
predictive adaptation. However, we are not aware of any existing system for motorcycles. In this work, we
present an algorithm that can cope with the rolling movement of a motorcycle. In addition, it can robustly
reconstruct the road profile within a single time step and does not require temporal integration which allows
real-time processing up to very high speeds at a precision in the order of millimeters. The complete system
has been successfully tested on a German highway and a precise road laser scan has been used for evaluation.
1 INTRODUCTION
To use a suspension system to its full extent it is indis-
pensable to predict the road condition in front of the
vehicle and to adapt to it accordingly. For cars this
improves the comfort whereas for motorcycles this
has also an influence on the stability of the vehicle
especially at high speeds. That means, single irregu-
larities on a highway like bridge joints have a strong
impact on the handle bar. In case of semi-active sus-
pension systems, that have much faster adaptation
times than active suspension systems (approximately
30 ms (Savaresi et al., 2010)), it still requires a scan-
ning of at least 4m ahead to cope with speeds up to
200km/h. As the visual appearance of the scene dras-
tically changes at such high velocities, temporal inte-
gration is quite difficult and it is required to develop a
system that can create a precise road profile in as few
time steps as possible.
To detect the road in front of a vehicle, the most
promising sensors are nowadays laser scanners and
cameras. As the space for sensors is very limited on a
motorcycle, it is desirable to use one sensor for mul-
tiple applications, like sign recognition, lane assist or
collision warning, which is only achievable by cam-
eras. In addition, laser scanners would require a fairly
dense and fast one-dimensional scan arrangement to
achieve similar performance as cameras.
Using cameras for road reconstruction, one could
use a structure from motion approach (one camera)
or a stereo camera system. A major problem apply-
ing structure from motion is the optical flow compu-
tation at high speeds. Because of huge displacements,
strong perspective transformations and motion blur, it
is impossible to meet the real-time requirements. In
addition, the monocular approach is limited in preci-
sion and has a higher latency compared to the stereo
vision system for this scenario.
In this work, we present a stereo vision system that
meets all the previously mentioned requirements. It is
able to work despite very strong vibrations of a mo-
torcycle which are much higher than the vibrations
of a car and caused serious problems for the stereo
processing. The biggest challenge in developing such
a system is to reach a level of sufficient robustness
within a single time step while preserving precise re-
construction and the possibility to also work in lean-
ing position.
2 RELATED WORK
The closest application that is already on market is the
Magic Body Control that is available in the Mercedes
Benz S-Class. It adapts the suspension in advance by
using a stereo camera that scans the road condition in
front, which is called Road Surface Scan (Weist et al.,
2013). Details about the method are not stated, but
Deigmoeller, J., Einecke, N., Fuchs, O. and Janssen, H.
Road Surface Scanning using Stereo Cameras for Motorcycles.
DOI: 10.5220/0006614805490554
In Proceedings of the 13th International Joint Conference on Computer Vision, Imaging and Computer Graphics Theory and Applications (VISIGRAPP 2018) - Volume 5: VISAPP, pages
549-554
ISBN: 978-989-758-290-5
Copyright © 2018 by SCITEPRESS – Science and Technology Publications, Lda. All rights reserved
549

from the article it can be extracted that sparse fea-
tures are used for depth estimation. In a second step,
the ego-motion is used to integrate those features over
time and by this get a precise road surface reconstruc-
tion. It seems that Road Surface Scan does not focus
on single road irregularities, but on continuous road
shapes that might bring the vehicle into oscillating up
and down movements. This can be avoided by a pre-
dictive suspension adaptation.
A similar idea in using ego-motion information
has been published in (Sugimoto et al., 2013). They
compute the 3D surface of a ground area by minimiz-
ing the photometric error assuming that in small areas
the pixel transformation follows a homography. Com-
bining all homographies in a mesh, they optimize the
surface including a smoothness term. The final out-
put is a Digital Elevation Map (DEM). The drawback
of this approach is the high computational effort and
as for Road Surface Scan, the precision of the recon-
struction is reached by integrating multiple time steps,
which is difficult at high speeds.
In (Shen et al., 2014), the authors use a multi pur-
pose camera to also compute an elevation map of the
road in front. For this they assume a pitch angle
and height of the mounted camera. They adapt for
changes in the pitch angle from 3D coordinates from
a certain area where the road is assumed to be flat.
Additionally, they cannot cope with roll angles. Nev-
ertheless, they state height measurement variances of
1.2cm at a distance of 5-8m which is too imprecise
for our application.
A combination of elevation map computation,
obstacle and curb detection has been published
in ((Oniga and Nedevschi, 2010),(Oniga et al.,
2008),(Oniga et al., 2007)). This approach focuses on
separating those three types instead of precise surface
reconstruction. For this purpose they use a quadratic
road surface model, because they are interested in a
large road area. For our purpose, as we are interested
only in a narrow path in front of the vehicle, a planar
model is enough. Nevertheless, they run there algo-
rithm in real-time and within a range of cm-precision.
The authors of (Siegemund et al., 2011) and
(Siegemund et al., 2010) also focus on curb detection
by using a third order polynomial and temporal inte-
gration. Even if the result looks promising, we cannot
rely on temporal integration and we assume a simple
planar model.
3 SYSTEM OVERVIEW
After image rectification, the system consists of two
parts. First, the reconstruction of the road profile and
second, the computation of a height map. The latter
provides the basis for the detection of road irregulari-
ties.
The disparity computation used in this work is the
Summed Normalized Cross-Correlation method (Ei-
necke and Eggert, 2010) that is a good combination
in terms of precision and computation time. The in-
formation from previous time steps about the road ge-
ometry in front is used to further improvethe disparity
precision.
Finally, an elevation map is computed by assum-
ing that the road is optimally planar and irregularities
on the road deviate from this model assumption. This
allows for a simple thresholding on the elevation map
to make a decision whether the suspension should be
adapted or not. The adaptation itself is not part of this
work. There are several ways to integrate both sys-
tems, but this is beyond the scope of this paper.
In the remainder of this paper, we focus on the
feasibility to detect bumpy road conditions in such
extreme conditions as on a motorcycle at high pre-
cision. We first discuss the disparity computation in
Section 4. The elevation map and post processing
are discussed in Section 5. To evaluate the system,
we give an insight into its performance by comparing
against an offline generated laser scan of a German
highway road profile in Section 6.
4 DISPARITY COMPUTATION
The Summed Normalized Cross-Correlation (SNCC)
method provides a dense disparity map which is very
robust against illumination changes as it is based on
the approved NCC computation. An improvement to
the standard method has been shown by reducing the
fattening effect that is caused by strong intensity con-
trasts that usually occur at depth discontinuities (Ei-
necke and Eggert, 2010). To overcome this, the cor-
relation value
¯
ρ
i
at a certain pixel coordinate (x
i
, y
i
)
T
is estimated by summing up the correlation values of
the neighbouring pixels ρ
j
:
¯
ρ
i
=
1
|N(i)|
∑
jεN(i)
ρ
j
. (1)
By this, the SNCC method achieves similar pre-
cision as the standard SGM (Hirschmueller, 2008)
method at lower computation time (Scharstein et al.,
2017).
The neighbourhood N(i) is defined by the desired
patch dimensions used for the correlation measure. In
case of a flat road, the best quantization in depth can
be achieved by using a flat patch. On the other hand,
VISAPP 2018 - International Conference on Computer Vision Theory and Applications
550
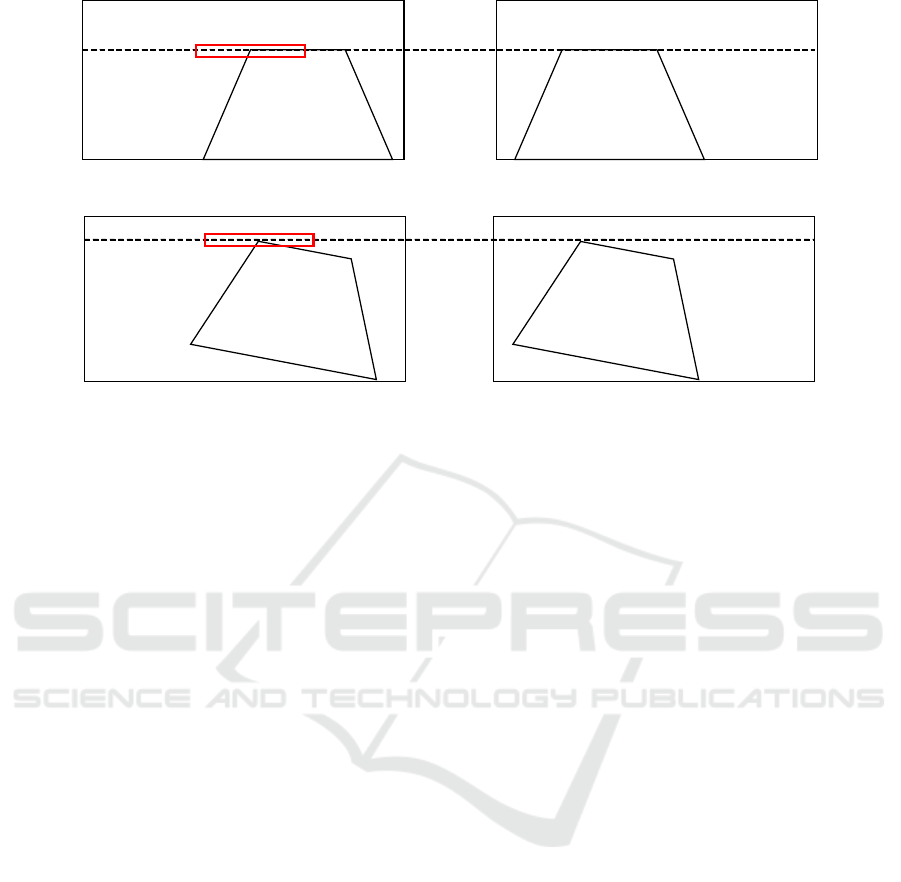
Figure 1: Correlation measure between left and right stereo image using a rectangular patch (red) along the epipolar line
(dashed line). If the motorcycle is in upright position, (top image) the search direction is aligned with the road geometry
(pixels with same disparity lie on the epipolar line). If the motorcycle is in leaning position (bottom image), the search
direction is not aligned with the road geometry. Hence, no proper match is found.
to ensure sufficient statistics for the correlation mea-
sure, the patch should be wide in order to compensate
the flatness (see Fig. 1, top image).
If the motorcycle is in upright position, such a
rectangular patch provides robust matches at high res-
olution in depth. This is due to the fact that the
search direction of the disparity measure - which is
the epipolar line - is aligned with the road geometry.
In other words, disparities with the same value lie one
a horizontal line on the road as the epipolar line does.
On the other hand, the good quantization in depth
by the flat patch worsens the correlation measure in
leaning position of the motorcycle. This is because
the epiploar line and the pixels with same disparities
on the road are rotated against each other (see Fig. 1,
bottom image). Hence, there will be no proper match
between the left and right image.
As we will see in the next section, we estimate
the road geometry assuming a planar structure. That
means, we roughly know the rotation between epipo-
lar line and road already. With this knowledge, we
could rotate the patch - which is very inefficient in
terms of computation time - or we warp the image
content.
The latter one can be done very efficient by back-
ward warping and bilinear interpolation. This presup-
poses that the image content is purely planar which
is true for our application. Instead of compensating
for the rotation, which would mean that we have to
rotate both images and we would destroy the epiploar
geometry, we choose the method of warping only one
image and compensate the offset along the epipolar
line (Einecke and Eggert, 2013). Assuming we have
a rough estimate of the plane parameters q
1
, q
2
and
q
3
from a previous time step, the disparity d
i
between
left and right image can be expressed by:
d
i
= q
1
(x
i
− c
x
) + q
2
(y
i
− c
y
) + q
3
, (2)
where c
x
and c
y
is the principal point. This re-
lation allows to reduce the pixel offset between both
images before the correlation measure is done. This
means that d
i
= 0 if we have the perfect plane param-
eters. As this is usually not the case, because we use
the parameters from the previous time step, we can at
least bring both regions of interest close to each other
where the road assumption is fulfilled.
The reduction of disparity increases the confi-
dence for the correlation measure, because both im-
ages are close to congruent instead of beeing rotated
to each other. Fig. 2 shows the effect of warping one
stereo image by the planar model compared to the
conventional approach without warping.
A nice side effect of this compensation is less
computational effort because the disparity search
range is drastically reduced.
5 ELEVATION MAP
After the disparities have been computed, we first es-
timate the current plane parameters q
1
, q
2
and q
3
from
Equation 2 in the latest stereo image pair and we reuse
it for the next time step as described in Section 4.
For the model fitting, the robust regression method
RANSAC is used (Fischler and Bolles, 1981). To ex-
tract the plane normal vector (n
x
, n
y
, n
z
)
T
and distance
Road Surface Scanning using Stereo Cameras for Motorcycles
551
3m
4m
6m
5m
7m
reconstruction of road patch without image warping
reconstruction of road patch with image warping
0.05m
0.0m
-0.05m
0.05m
0.0m
-0.05m
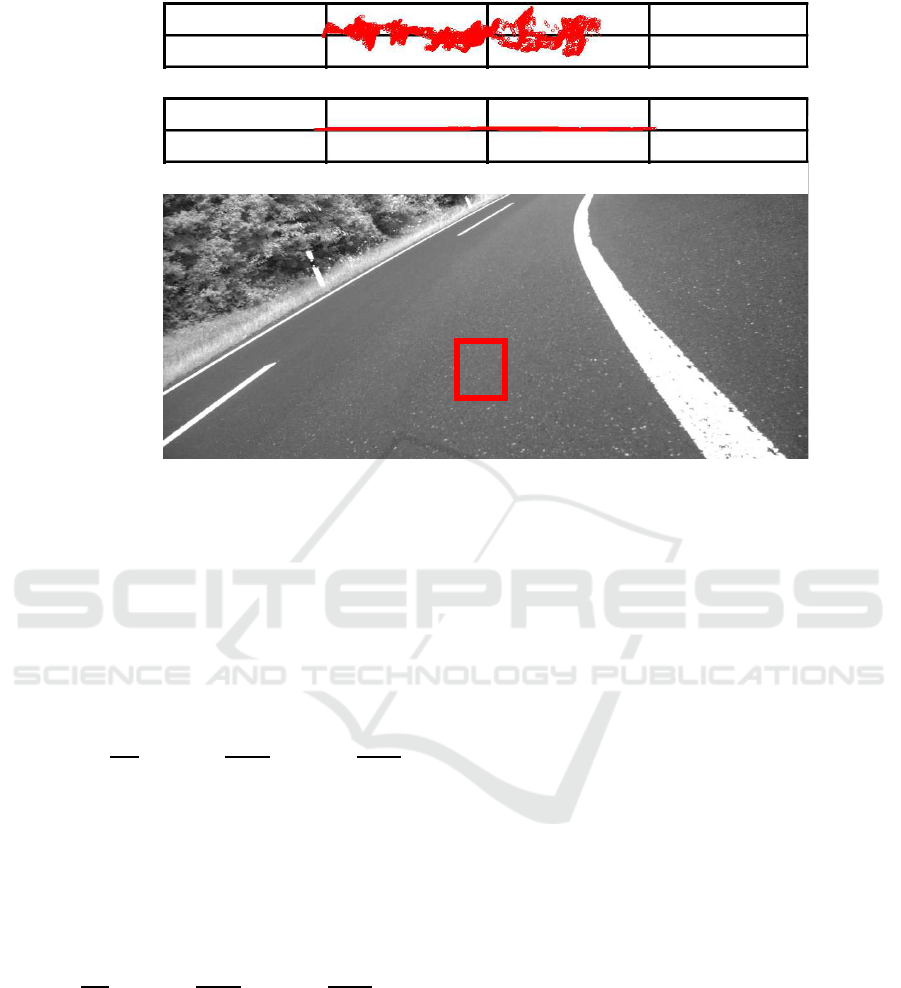
Figure 2: Influence of image warping in leaning position on the elevation map. The disparity is only computed within the red
rectangle marked in the image as this is the part of the road the front wheel will pass. Other areas are not of interest. In the
upper part of the image the elevation maps are shown with and without warping for distances from 3m-7m. The upper graph
illustrates the influence of leaning on the disparity computation as discussed in Fig. 1. The lower graph shows a nice and flat
reconstruction because the image warping has been applied before the disparity computation.
d
p
to the plane, Equation 2 can be rewritten as fol-
lows:
d
i
= q
1
(x− c
x
) + q
2
(y− c
y
) + q
3
(3)
= −
n
x
b
d
p
(x− c
x
) −
n
y
bf
x
d
p
f
y
(y− c
y
) −
n
z
bf
x
d
p
,
where b is the baseline and f
x
, f
y
are the focal
lengths.
The elevation map can be derived by computing
the distance of each triangulated image point to the
plane which is simply d
p
. Rearranging Equation 3 for
d
p
gives:
d
p,i
= −
n
x
b
d
i
(x− c
x
) −
n
y
bf
x
d
i
f
y
(y− c
y
) −
n
z
bf
x
d
i
. (4)
To evaluate the system a thresholding is applied
on the elevation map. If the distance d
p,i
exceeds a
certain threshold t
p
and the number of exceeding dis-
tances hits a minimum quantity Q
P
, the system de-
tects an irregularity on the road. The final output is
the maximal detected elevation d
p,max
and the corre-
sponding depth Z
max
within the current time step.
6 EXPERIMENTAL RESULTS
Many different output formats of the system are pos-
sible, starting from a single maximum value to the
whole road profile or even a profile model. To be able
to evaluate the system on public roads, we decided
to use Z
max
and d
p,max
and match them to our ground
truth data.
The ground truth data was a 1km long 3D laser
scan of the German highway A3 available in the open
format CRG (OpenCRG, 2017). If the system returns
a detection, we check if the ground truth 3D scan also
contains an irregularity and if the measured distance
Z
max
matches. To localize the motorcycle within the
CRG data, we equipped the motorcycle with a GPS
sensor and a stroke sensor at the front wheel.
As the track contains three bridge joints, which are
easy to detect in the recorded stroke data and in the
CRG data, we can synchronize both data. The GPS
information is used for rough positioning at the be-
ginning and the speed information is used to localize
the motorcycle between the bridge joints.
To quantify the system, we used the Receiver Op-
erating Characteristic (ROC) curve. A true positive is
defined as a detected irregularity that matches with the
distance given in the CRG data. A false positive is any
VISAPP 2018 - International Conference on Computer Vision Theory and Applications
552
100 200 300 400 500 600 700 800
-10
-5
0
5
10
100 200 300 400 500 600 700 800 900 1000
7.5
8
8.5
9
9.5
10
10.5
road profile
derivative of stroke over time
distance [m]
height [m]
stroke [mm]
t
samples @ 30Hz
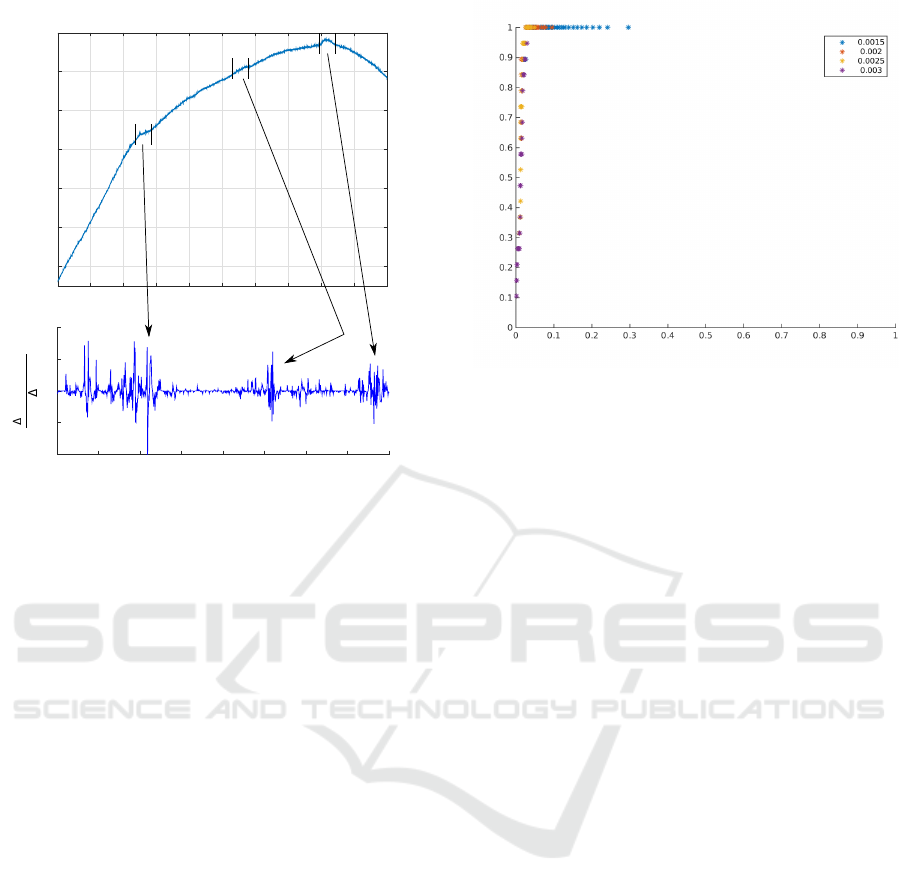
Figure 3: CRG data of German highway A3 (top image)
and corresponding stroke data (bottom image).
detection if there is no irregularity in the CRG data.
In addition to the straight track, we used a curve at an
exit containing an irregularity that is clearly visible in
the stroke sensor. As it is difficult to get comprehen-
sive CRG data sets from public roads, we were limited
to this one data set. We used one half of the recording
for parameter training and the remaining data for test-
ing. On the 1km long test track there are 19 events, in-
cluding the three bridge joints with a maximal height
of 3cm. The smallest event is in a range of 5mm. This
makes an overall number of 80 events within 8033
stereo image pairs.
The training data is used to find the best values for
the threshold t
p
on the elevation map and the mini-
mum quantity threshold Q
P
. From the ROC curve in
Fig. 4 those corresponds to t
p
= 2.5mm and Q
P
= 40
pixels if we are interested in as many detections as
possible at low false positive rate. Applying this pa-
rameter set on the testing data gives a true positive
rate of 97.3% and a false positive rate of 2%.
The system runs on an Intel i7 processor at a run-
time of approximately 20ms on a region of interest of
50x200 pixels. The images are captured at 30 frames
per second and a resolution of 2048x1088 pixels. Our
evaluation has shown that the performance on half
resolution is similar to the full resolution at much less
computation time.
The testing data contained speeds in a range from
100-150km/h. Unfortunately, the highway section we
used for our evaluation has been renewed soon after
our first recording session so that we could not eval-
true positive rate
false positive rate
Figure 4: ROC curves of the system for the training data.
Applying the optimal working point from the training data
on the testing data - in terms of true positive detections -
gives a true positive rate of 97.3% and a false positive rate
of 2%.
uate 200km/h, rain and night conditions. At least,
we can state that in all cases the algorithm still de-
livers plausable results. For the night riding we had
to mount a brighter front light, because the standard
light on our motorcycle was too weak for proper de-
tection by our cameras.
7 CONCLUSION
We presented a road-scanning system based on stereo
cameras for predictive suspension adaptation. It can
cope with high dynamic movementsof the motorcycle
as leaning.
To ensure low latency we did not use any tempo-
ral integration of the 3D reconstruction. The major
influence on the robustness is the big patch size for
the disparity measure. The shape of the patches have
been chosen to optimally fit to the geometry of the
road at low computational effort.
The evaluation has shown that the precision of the
system is in the order of millimeters up to high speeds
of 150 km/h. The system also works at 200km/h and
higher, at night and in rainy conditions. Unfortu-
nately, we cannot provide numbers for latter scenar-
ios as the test track with ground truth has been recon-
structed during our evaluation period.
In future, the system will be integrated into a semi-
active suspension system. The extremely vibration re-
sistant camera set-up for motorcycles can also be used
for any other vision application that requires one or
two cameras.
Road Surface Scanning using Stereo Cameras for Motorcycles
553

REFERENCES
Einecke, N. and Eggert, J. (2010). A two-stage correlation
method for stereoscopic depth estimation. In DICTA,
pages 227–234.
Einecke, N. and Eggert, J. (2013). Stereo image warping for
improved depth estimation of road surfaces. In IEEE
Intelligent Vehicles Symposium, pages 89–194.
Fischler, M. A. and Bolles, R. C. (1981). Random sample
consensus: a paradigm for model fitting with appli-
cations to image analysis and automated cartography.
Communications of the ACM.
Hirschmueller, H. (2008). Stereo processing by semi-global
matching and mutual information. In IEEE Transac-
tions on Pattern Analysis and Machine Intelligence,
pages 328–341.
Oniga, F. and Nedevschi, S. (2010). Processing Dense
Stereo Data Using Elevation Maps: Road Surface,
Traffic Isle, and Obstacle Detection. IEEE Transac-
tions on Vehicular Technology, pages 1172–1182.
Oniga, F., Nedevschi, S., and Meinecke, M. (2008). Curb
Detection Based on a Multi-Frame Persistence Map
for Urban Driving Scenarios. In IEEE Conference on
Intelligent Transportation Systems, pages 67–72.
Oniga, F., Nedevschi, S., Meinecke, M. M., and To, T. B.
(2007). Road Surface and Obstacle Detection Based
on Elevation Maps from Dense Stereo. In IEEE Con-
ference on Intelligent Transportation Systems, pages
859–865.
OpenCRG (2017). Opencrg. http://opencrg.org. [Online;
accessed 07. November 2017].
Savaresi, S. M., Poussot-Vassal, C., Spelta, C., Sename,
O., and Dugard, L. (2010). Semi-Active Suspension
Control Design for Vehicles. Butterworth-Heinemann,
Oxford.
Scharstein, D., Szeliski, R., and Hirschmller, H.
(2017). Middlebury stereo vision page.
http://vision.middlebury.edu/stereo/. [Online;
accessed 07. November 2017].
Shen, T., Schamp, G., and Haddad, M. (2014). Stereo Vi-
sion Based Road Surface Preview. In IEEE Confer-
ence on Intelligent Transportation Systems.
Siegemund, J., Franke, U., and Forstner, W. (2011). A tem-
poral filter approach for detection and reconstruction
of curbs and road surfaces based on Conditional Ran-
dom Fields. In IEEE Intelligent Vehicles Symposium,
pages 637–642.
Siegemund, J., Pfeiffer, D., Franke, U., and Forstner, W.
(2010). Curb reconstruction using Conditional Ran-
dom Fields. In IEEE Intelligent Vehicles Symposium,
pages 203–210.
Sugimoto, S., Motooka, K., and Okutomi, M. (2013). Di-
rect Generation of Regular-Grid Ground Surface Map
from In-Vehicle Stereo Image Sequences. In 2013
IEEE International Conference on Computer Vision
Workshops (ICCVW), pages 600–607.
Weist, U., Missel, J., Cytrynski, S., Mehren, D., Schwarz,
D. T., and Kern, S. (2013). Fahrkomfort der extrak-
lasse. ATZextra, 18.
VISAPP 2018 - International Conference on Computer Vision Theory and Applications
554
