
Assessment of Gait Harmony in Older and Young People
Manuel Gnucci, Marco Flemma, Marco Tiberti, Mariachiara Ricci,
Antonio Pallotti and Giovanni Saggio
Dept. of Electronic Engineering, University of Rome Tor Vergata, via del Politecnico 1, 00133 Rome, Italy
Keywords: Gait Analysis, Golden Ratio.
Abstract: Recent studies have found that in normal human walking the stance and swing phases are approximately in
proportion to
, the golden ratio. This could provide an interesting tool in human gait analysis, in diagnosing
pathological conditions or in analysing the walking performance of a subject. However, the assessment of gait
harmony was provided in previous studies by means of optical systems, which are not ideal for clinicians,
because of non-portability, high-costs, and necessity of expert supervisor skills. In addition, the assessment
regarded mostly middle-aged or aged people. Differently, this work is based on wearable technology to sense
human walking, and reports a comparison between elder and young people. Results demonstrate how elders
adopt a walking style which better minimizes the energy expenditure.
1 INTRODUCTION
Human walking is extensively studied in different
research fields, such as physiology, computer
animation (Multon et al., 1999), control theory,
biomechanics (Cappellini et al., 2006; Bauby and
Kuo, 2000), and so on. Gait analysis supports medical
diagnosis (Jankovic, 2008) and allows developing
humanoid robot locomotion (Ames et al., 2012).
Nevertheless human walking is still far to be
completely understood, and new findings are more
than welcome.
Walking is a succeeding of movements,
periodically repeated (Figure 1), named gait cycle
(Ayyappa, 1997), which can be essentially related to
two main phases: a stance phase (or, simply, stance)
and a swing phase (or, simply, swing). The stance is
when the foot is in contact with the ground, the swing
is when the foot in in the air moving forward. During
walking one leg is in stance and the other leg in swing.
The stance is, in turn, divided into three phases:
hell-strike, foot-flat, foot-off. Analogously, the swing
consists of: acceleration, mid swing, deceleration.
Recent studies suggested how in normal human
gait of healthy adults (4919yo) the stance and swing
ratio of a gait cycle seems to be close to
, feature
named “Gait Harmony” (Iosa et al., 2013), with
being the “golden ratio”, an irrational number.
This ratio seems to be altered in adults
(67.23±10.65yo) suffering from pathological
conditions affecting the walking movements, such as
Parkinson disease (Iosa et al., 2016b). Morehover the
closeness to
was associated to a walking with
minimal energy expenditure (Serrao et al., 2017).
All those works were based on measurements
made by means of video-capturing and video-motion
analisys systems, which are meaningfully considered
as a standard-gold, but with the drawbacks to be very
expensive, highly technical, non-portable, not-
practical for clinical environments or multisite
clinical trial equipments. In addition, all those works
did not considered very young people, mainly
investigating middle-aged or aged people.
Differently, useful objective measures of human
walking need to be cost-effective, portable and easy
to andle, as in can be by means of wearable
electronics (Greene et al., 2015; Hsu et al., 2014;
Spain et al., 2012; Solomon et al., 2015; Bonora et al.,
2015), and have to take into account a wider age-
range, including young people.
Therefore, our work is devoted to consider the
evidence of the presence of
, if any, according to
measures acquired by means of inertial wearable
sensors in healthy people ranging from young to aged.
Gnucci, M., Flemma, M., Tiberti, M., Ricci, M., Pallotti, A. and Saggio, G.
Assessment of Gait Harmony in Older and Young People.
DOI: 10.5220/0006572701550160
In Proceedings of the 11th International Joint Conference on Biomedical Engineering Systems and Technologies (BIOSTEC 2018) - Volume 4: BIOSIGNALS, pages 155-160
ISBN: 978-989-758-279-0
Copyright © 2018 by SCITEPRESS – Science and Technology Publications, Lda. All rights reserved
155
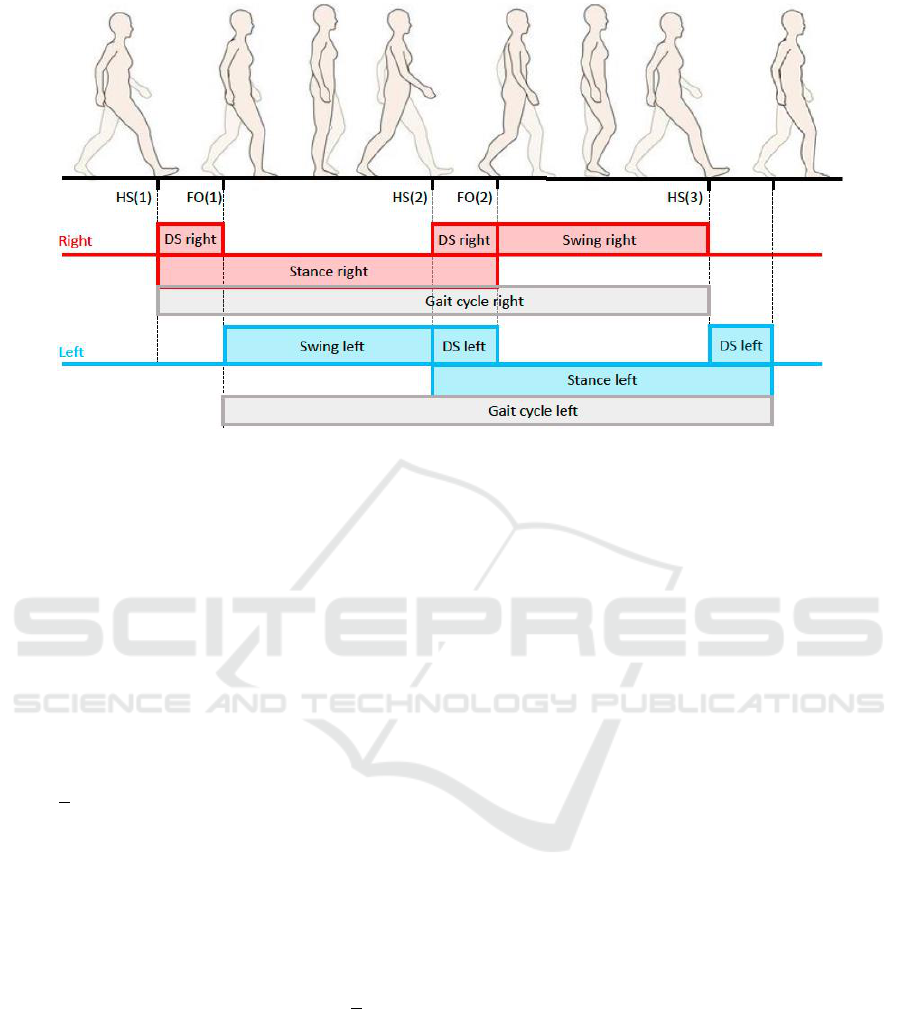
Figure 1: The gait cycle, with stance and swing phases.
The rest of this work is structured in three parts:
the first dealing with materials and methods, in which
the golden ratio will be properly introduced and
experimental procedure and data analysis methods
detailed; the second part about obtained results; the
third part related to discussion and conclusion.
2 MATERIALS AND METHODS
2.1 Golden Ratio
The “golden ratio” is the irrational number
, it can be defined as the
proportion between two quantities and such that
.
(1)
Considering
, we have:
(2)
(3)
which has two real solutions,
, the
positive solution being
, as the only with a physical
meaningful.
This number is considered to have particular
aesthetic properties, and it is often used by artist and
architects in their work (Akhtaruzzaman and Shafie,
2011). The “golden ratio” is also present in many
patterns in nature and science in general, as botanics,
biology, physics and engineering (Guerreiro and
Rothen, 1995; D’Amico et al., 2014; Davis and
Altevogt, 1979; Yamagishi and Shimabukuro, 2008;
Kajiyama et al., 2007). From eqs. (2) and (3) the two
most important properties of
are easily obtained:
(4)
(5)
i.e.
and
maintain the same fractional part of
,
while the integer part change of an unit.
2.2 Gait Cycle
The (bipedal) gait cycle () is the sequence of
movements during locomotion, made of repetitive
pattern consisting in a stance phase (, one foot on
the ground) and a swing phase (, the same foot off
the ground), so (Figure 1)
(6)
On turn, the stance phase is composed of a single
support phase, when only one foot sustains the body,
and a (splitted-in-two) double support phase, with
both foot on the ground. Under the reasonable
hypotesis of a symmetric gait, the stance phase can
be considered as the sum of the (splitted-in-two)
double support phase () with the (controlateral)
swing phase that is of the opposite foot), so
(7)
2.3 Golden Ration and Gait Cycle
With the aim of investigating the possibility to
identify the golden ratio within the gait cycle, as in
BIOSIGNALS 2018 - 11th International Conference on Bio-inspired Systems and Signal Processing
156
(Iosa et al., 2013), we assume
so that,
according to eq. (1), we have:
(7)
From eq. (4), it results:
(8)
and considering eqs. (6) and (7), we can write:
(9)
(10)
where, according to the literature (Iosa et al., 2016a):
▪
▪
▪
2.4 Participants
Four healthy elderly (4 men mean age: 7010 years
old), forming a first group, and five healthy young (2
girls and 3 men, all 22 years old), forming a second
group, with no pathological or orthopedic
impairements, were enrolled in this study. The local
ethical committee approved the study, which was
designed in accordance with the principles of
Declaration of Helsinki on studies of human subjects.
(a)
(c)
(b)
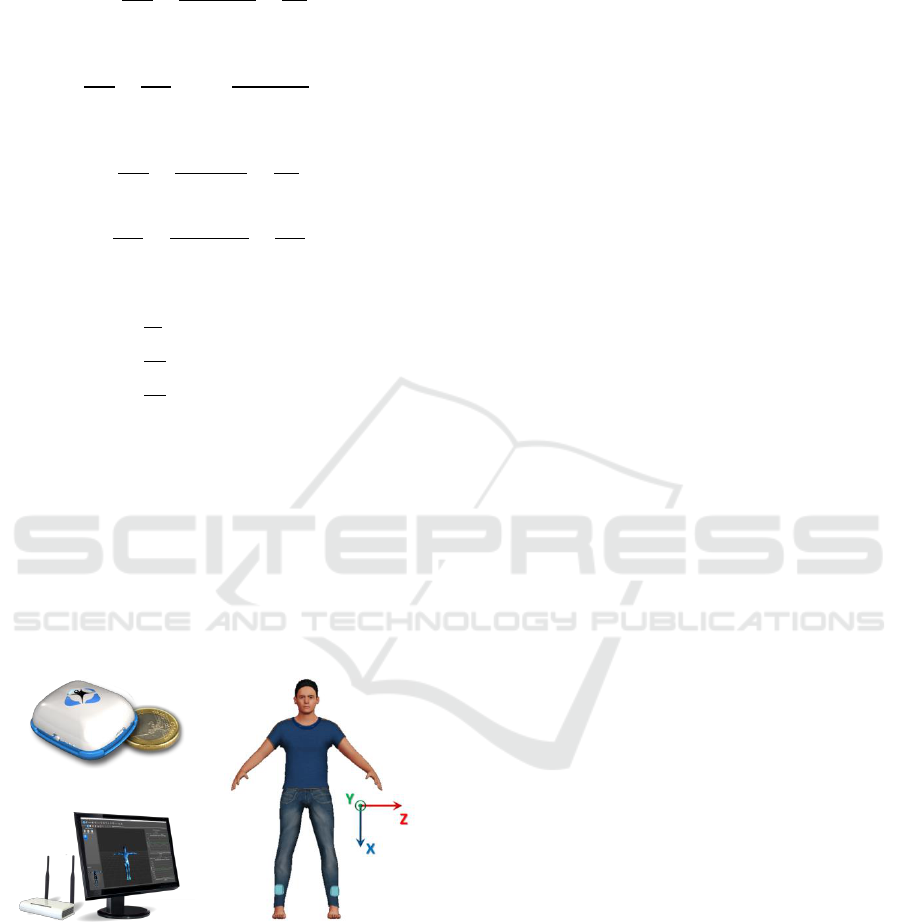
Figure 2: (a) “Movit G1” sensor, (b) the receiver unit, which
collects data wireless sent by each sensors and
communicate with a personal computer running “Captiks
Motion Studio”, and (c) the locations of each sensor on the
body of the subject.
2.5 Wearable Electronics
The wearable electronics used in this study was made
of inertial sensors, singularly termed “Movit G1”
(Figure 2a, by Captiks Srl, Rome, Italy), which can
measure 3D linear accelerations, 3D angular
velocities and orientation (Alessandrini et al., 2017).
The system synchronously allows the capture of
the data from a network of “Movit G1” sensors. Data
from sensors were wireless acquired in real time,
visualized on a screen and stored on a personal
computer by means of a dedicated software, termed
Captiks Motion Studio (Figure 2b, by the same
manufacturer).
The measuring range was set to 2g for the
accelerometer (sensitivity: 16,384 LSB/mg) and
2000/s for the gyroscope (sensitivity: 16.4 LSB/°/s),
with a sampling frequency of 50Hz.
Two sensors, forming a sort of small-network,
were applied to each participant, in turn, on the ankles
through elastic bands (Figure 2c).
Gait analysis were performed in post processing
on Matlab® environment.
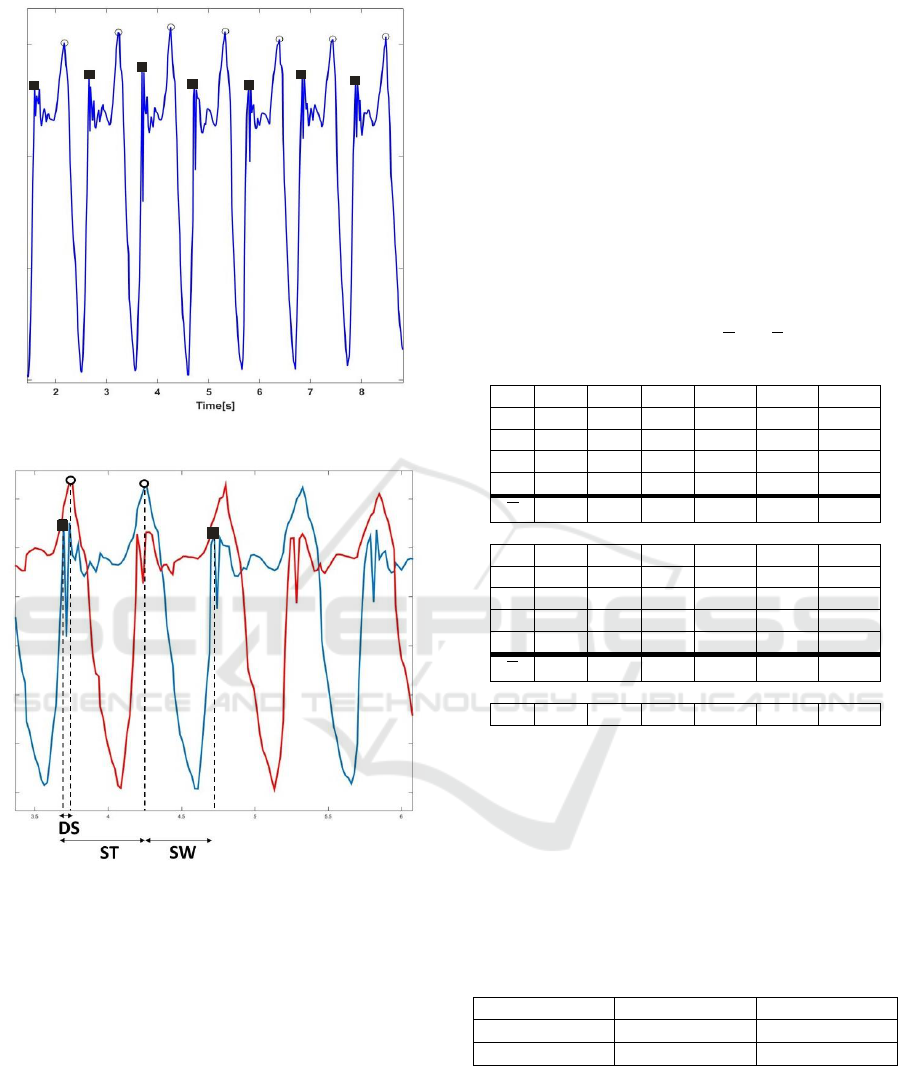
2.6 Data Analysis
In order to obtain the gait time events we analyzed the
z-axis angular velocities recorded by gyroscopes.
According to (Sabatini et al., 2005), a good
approximation for the foot-off () and heel-strike
() time is given by the instant of maximum foot
rotation velocity, assuming the clockwise convention.
More precisely, for the same leg, the foot-off event
occurs at the maximum which follows the zero
angular velocity instant, i.e. after the stance phase,
and the heel-strike occurs at the succeeding
maximum, namely the one after the swing phase
(Figure 3).
From the knowledge of the heel-strike and foot-off
events, assuming that the gait cycle starts with an
heel-strike from the right leg (analogusly for the left),
according to Figure 1, the gait cycle timing
parameters can be easily obtained as follows:
(11)
(12)
(13)
(14)
where the event number is evidenced in parenthesis.
2.7 Protocol
Movit sensors were placed on ankles, as schematized
in Figure 2c.
Assessment of Gait Harmony in Older and Young People
157
(a)
(b)
Figure 3: (a) measured foot velocities of 7 gait cycles and
estimation of heel strike (■) and foot-off (o) time events, (b)
estimation of gait cycle parameters combining
measurements of right foot (RF) and left foot (LF).
A timed up and go test were performed: the
subject get up from a chair, stright walked 3 meters,
turned around, walked back, and sit down. All
subjects were instructed to avoid leaning on arms to
stand up, and to walk at their self-selected, usual
speed. Only the central part of the pathway was
selected to perform the analysis of the parameters.
Spatial-temporal parameters were computed among
at least 6 strides (3 per limb).
3 RESULTS
Results are reported in Table 1. Both groups showed
a similar gait cycle duration, respectively 1.182s and
1.2525s in average, 0.0705s more for young. was
shorter in young than elders, 0.20s vs. 0.28s. This is
reflected especially on the ratio,
which resulted different between two groups, 2.795
for young respect to 1.700 for elders. The
ratio was closer to
for elders with 1.642 with
respect to 1.390.
Table 1: Gait parameters of participants, E1-E4 elderly, S1-
S5 young. SW, ST and DS are respectively Swing, Stance
and Double Support, in [s]. Rows and represent mean
values for elderly and young, respectively.
E1
0.45
0.83
0.32
1.547
1.837
1.420
E2
0.49
0.73
0.26
1.677
1.480
1.863
E3
0.49
0.80
0.27
1.615
1.626
1.850
E4
0.45
0.73
0.27
1.616
1.624
1.666
0.47
0.77
0.28
1.614
1.642
1.700
Y1
0.55
0.82
0.26
1.676
1.484
2.090
Y2
0.47
0.60
0.12
1.794
1.261
3.845
Y3
0.45
0.58
0.13
1.777
1.286
3.500
Y4
0.53
0.68
0.18
1.763
1.296
2.960
Y5
0.47
0.76
0.30
1.618
1.623
1.581
0.49
0.08
0.20
1.726
1.390
2.795
0.02
0.08
0.08
0.112
0.252
1.095
, and are plotted in Figure 4, where
it results that in elders all proportions are closer to f
and show less spread than those for young
participants. It is notable that results about elders are
similar to those obtained in a previous study, in which
the mean age was of 49 years old (Iosa et al., 2013),
comparisons are shown in Table 2.
Table 2: Comparisons between mean value and standard
deviation of GR0 and GR1 of elders enrolled in this study
and results presented in (Iosa et al., 2013).
Previous work
Current work
1.6840.357
1.6990.179
1.6290.173
1.6140.127
RF
LF
BIOSIGNALS 2018 - 11th International Conference on Bio-inspired Systems and Signal Processing
158
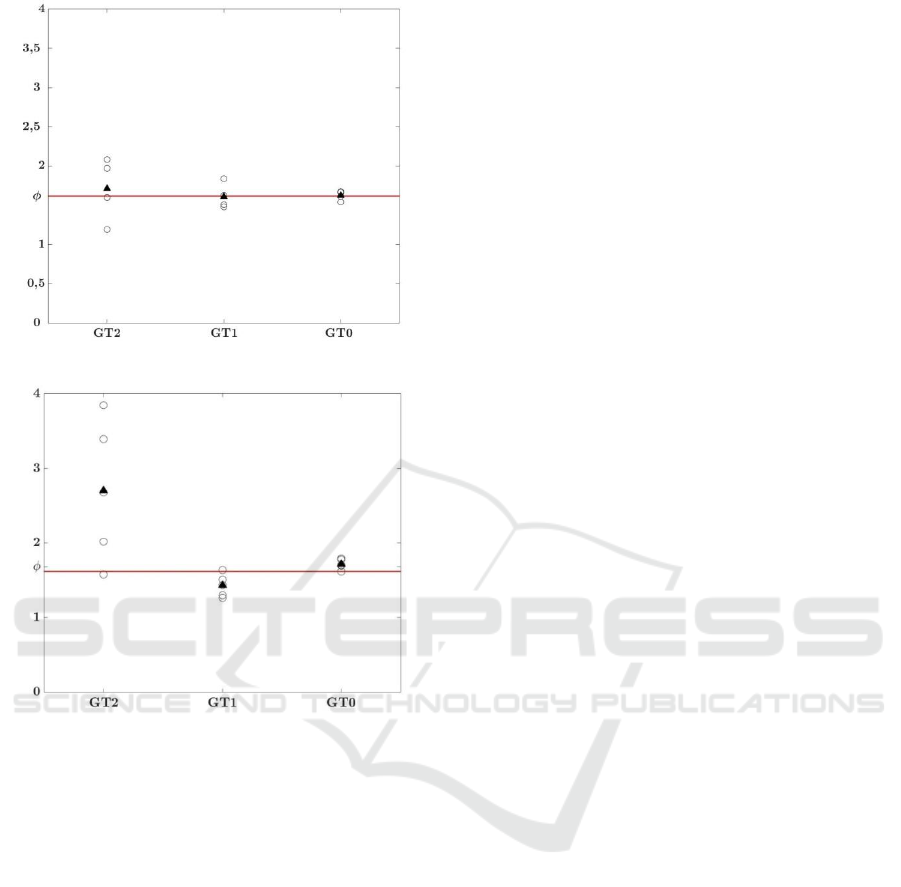
(a)
(b)
Figure 4: Comparison between the three walking
parameters ratios and golden section for (a) elders and (b)
young. Clear circles represent the values for each
participant, dark triangles represent the mean values.
4 DISCUSSION
The results confirmed that the proportion between
stance are in accord to previous studies, which gives
a confirm that wearable sensors could provide
estimation of the gait parameter ratios as good as
visual systems, giving an easy-to-use alternative to
the current methods, that would be helpful in a
prospective for a possible clinical usage of those
figures.
Moreover, comparisons had shown that the
relation between gait cycle parameters and golden
section is way more evident in elders, who presented
a mean value of very close to
,. The differences
between young and elders may be due to a different
style of walking. It can be note that the double support
phase is longer in elder that in young, for parity of
gait cycle duration, this can be due to a more powerful
push by the stance leg during the double support
phase in young people. Elders may choose the
walking stile that more optimizes the energy
expenditure, instead of young, who may prefer a more
rapid movement, this interpretation could be in
accord to (Serrao et al., 2017), in which is said that
the relation between gait parameters and golden ratio
may be due to energetic reasons. However from these
results seems that a deviation of gait parameters from
the golden ratio doesn’t mean necessarily that the
walk is abnormal. This suggest that more
comparisons are needed, for example between man
and woman, or children and adults, for a good
comprehension of the effective presence of the golden
ratio in human walking, and in order to explain when
and why the gait parameters ratios are far from this
number.
5 CONCLUSIONS
In this work we had provide independently that the
stance and swing duration are in proportion with the
golden ratio, using wearable sensors for the
experimental setup. Moreover a comparison between
elders and young has be done, showing that the
relation between gait parameters and f could be more
evident in elders that in young people. However the
low number of participants doesn’t make those results
statistically accurate and more studies are needed for
validate the conclusion obtained in this work, anyway
it still constitute a proof of concept, which could
provide a starting point for future works.
REFERENCES
Akhtaruzzaman, M. and Shafie, A. A. (2011). Geometrical
substantiation of phi, the golden ratio and the baroque
of nature, architecture, design and engineering.
International Journal of Arts, 1(1):1–22.
Alessandrini, M., Micarelli, A., Viziano, A., Pavone, I.,
Costantini, G., Casali, D., Paolizzo, F., & Saggio, G.
(2017). Body-worn triaxial accelerometer coherence
and reliability related to static posturography in
unilateral vestibular failure. Acta
otorhinolaryngologica Italica, 37(3), 231.
Ames, A. D., Cousineau, E. A., and Powell, M. J. (2012).
Dynamically stable bipedal robotic walking with nao
via human-inspired hybrid zero dynamics. In
Proceedings of the 15th ACM international conference
Assessment of Gait Harmony in Older and Young People
159

on Hybrid Systems: Computation and Control, pages
135–144. ACM.
Ayyappa, E. (1997). Normal human locomotion, part 1:
Basic concepts and terminology. JPO: Journal of
Prosthetics and Orthotics, 9(1):10–17.
Bauby, C. E. and Kuo, A. D. (2000). Active control of
lateral balance in human walking. Journal of
biomechanics, 33(11):1433–1440.
Bonora, G., Carpinella, I., Cattaneo, D., Chiari, L., and
Ferrarin, M. (2015). A new instrumented method for the
evaluation of gait initiation and step climbing based on
inertial sensors: a pilot application in parkinsons
disease. Journal of neuroengineering and rehabilitation,
12(1):45.
Cappellini, G., Ivanenko, Y. P., Poppele, R. E., and
Lacquaniti, F. (2006). Motor patterns in human walking
and running. Journal of neurophysiology, 95(6):3426–
3437.
D’Amico, A., Falconi, C., Bertsch, M., Ferri, G., Lojacono,
R., Mazzotta, M., Santonico, M., and Pennazza, G.
(2014). The presence of the fibonacci numbers in
passive ladder networks: The case of forbidden bands
[historical corner]. IEEE Antennas and Propagation
Magazine, 56(5):275–287.
Davis, T. A. and Altevogt, R. (1979). Golden mean of the
human body.
Greene, B. R., Rutledge, S., McGurgan, I., McGuigan, C.,
OConnell, K., Caulfield, B., and Tubridy, N.
(2015).Assessment and classification of early-stage
multiple sclerosis with inertial sensors: comparison
against clinical measures of disease state. IEEE journal
of biomedical and health informatics, 19(4):1356–
1361.
Guerreiro, J. and Rothen, F. (1995). A global approach to
botanic patterns. Journal of theoretical biology,
176(2):233–245.
Hsu, Y.-L., Chung, P.-C., Wang, W.-H., Pai, M.-C., Wang,
C.-Y., Lin, C.-W., Wu, H.-L., and Wang, J.-S. (2014).
Gait and balance analysis for patients with alzheimer’s
disease using an inertial-sensor-based wearable
instrument. IEEE journal of biomedical and health
informatics, 18(6):1822–1830.
Iosa, M., Fusco, A., Marchetti, F., Morone, G., Caltagirone,
C., Paolucci, S., and Peppe, A. (2013). The golden ratio
of gait harmony: repetitive proportions of repetitive gait
phases. BioMed research international, 2013.
Iosa, M., Morone, G., Bini, F., Fusco, A., Paolucci, S., and
Marinozzi, F. (2016a). The connection between
anthropometry and gait harmony unveiled through the
lens of the golden ratio. Neuroscience letters, 612:138–
144.
Iosa, M., Morone, G., Fusco, A., Marchetti, F., Caltagirone,
C., Paolucci, S., and Peppe, A. (2016b). Loss of fractal
gait harmony in parkinsons disease. Clinical
Neurophysiology, 127(2):1540–1546.
Jankovic, J. (2008). Parkinsons disease: clinical features
and diagnosis. Journal of Neurology, Neurosurgery &
Psychiatry, 79(4):368–376.
Kajiyama, Y., Raidal, M., and Strumia, A. (2007). Golden
ratio prediction for solar neutrino mixing. Physical
Review D, 76(11):117301.
Multon, F., France, L., Cani-Gascuel, M. P., & Debunne,
G. (1999). Computer animation of human walking: a
survey. The journal of visualization and computer
animation, 10(1), 39-54.
Sabatini, A. M., Martelloni, C., Scapellato, S., and Cavallo,
F. (2005). Assessment of walking features from foot
inertial sensing. IEEE Transactions on biomedical
engineering, 52(3):486–494.
Serrao, M., Chini, G., Iosa, M., Casali, C., Morone, G.,
Conte, C., Bini, F., Marinozzi, F., Coppola, G., Pierelli,
F., et al. (2017). Harmony as a convergence attractor
that minimizes the energy expenditure and variability in
physiological gait and the loss of harmony in cerebellar
ataxia. Clinical Biomechanics.
Solomon, A. J., Jacobs, J. V., Lomond, K. V., and Henry,
S. M. (2015). Detection of postural sway abnormalities
by wireless inertial sensors in minimally disabled
patients with multiple sclerosis: a case–control study.
Journal of neuroengineering and rehabilitation,
12(1):74.
Spain, R., George, R. S., Salarian, A., Mancini, M.,Wagner,
J., Horak, F., and Bourdette, D. (2012). Body-worn
motion sensors detect balance and gait deficits in people
with multiple sclerosis who have normal walking
speed. Gait & posture, 35(4):573–578.
Yamagishi, M. E. B. and Shimabukuro, A. I. (2008).
Nucleotide frequencies in human genome and
Fibonacci numbers. Bulletin of Mathematical Biology,
70(3):643–653.
BIOSIGNALS 2018 - 11th International Conference on Bio-inspired Systems and Signal Processing
160
