
Patient Satisfaction Analysis of Service Quality with Importance
Performance Analysis (IPA) Method and Customer Satisfaction
Index (CSI)
Pasukat Sembiring
1
, Ujian Sinulingga
1
and Marihat Situmorang
1
1
Department of Mathematics, Universitas Sumatera Utara, Dr. T. Mansur Street No. 9 , Medan, Indonesia
Keywords: Service Quality, SERVQUAL, Importance Performance Analysis (IPA), Customer Satisfaction Index (CSI).
Abstract: Satisfaction is the level of one's feelings after comparing the performance or results they feel with
expectations. Importance Performance Analysis (IPA) method and Customer Satisfaction Index (CSI) is one
of the methods used to determine the level of conformance between performance and expectations. In this
study IPA and CSI methods were used to determine the level of patient satisfaction in one hospital in Sumatra
Utara with a sample of 83 respondents. Data collection methods using questionnaires and conducting
interviews directly with respondents. The method used to measure the quality of service is applied
SERVQUAL method with five dimensions of service characteristics namely, physical evidence, reliability,
responsiveness, assurance and awareness. The results of data analysis applied IPA method that there are four
service attributes that must be repaired by the hospital because the quality of service is still considered low
but its performance is considered very important by the patient. The results of data analysis applied the CSI
method indicate that the level of patient satisfaction with the quality of care at the hospital is 0,82, this is
included in the category of very satisfied.
1 INTRODUCTION
Health is a state of well-being from the body, soul and
social that allows productive life socially and
economically. In this sense health must be seen as a
whole which consists of physical, mental and social
elements (UU No.23, 1992 tentang kesehatan).
Health is one of the basic human needs. Therefore,
choosing a health service provider or hospital is
something that must be done in order to get good
health services from the hospital.
The hospital is the spearhead of development and
public health services, but not all hospitals in
Indonesia have the same standard of service and
quality. The increasing number of hospitals in
Indonesia and the higher public demand for quality
and affordable health facilities, the hospital must
strive to compete in the midst of increasingly fierce
competition while meeting these demands. It became
one of the foundations for hospitals to provide
excellent service to every type of service provided.
Understanding the needs and desires of patients is
an important thing that affects patient satisfaction.
Satisfied patients are a very valuable asset because if
patients feel satisfied they will continue to use their
chosen services, but if patients feel dissatisfied they
will tell others twice about their bad experiences.
The variables studied were Emergency Room,
Doctor, Nurse, Medical Facility, Food and drink,
comfort and cleanliness, administration and finance,
as well as information and registration. this
percentage is said to be good in accordance with the
measurement aspect set by Indonesian Ministry of
Health. The measurement aspect for inpatient services
is said to be good if the percentage of patient patient
satisfaction is greater than 80%
2 LITERATURE REVIEW
2.1 Importance Performance Analysis
Method
This technique was first put forward by Martilla and
James in 1977 in their article "Importance-
Performance Analysis" published in the Journal of
Marketing. In this technique, respondents are asked to
assess the level of importance and performance of the
company, then the average value of the level of
Sembiring, P., Sinulingga, U. and Situmorang, M.
Patient Satisfaction Analysis of Service Quality with Importance Performance Analysis (IPA) Method and Customer Satisfaction Index (CSI).
DOI: 10.5220/0010077609690974
In Proceedings of the International Conference of Science, Technology, Engineering, Environmental and Ramification Researches (ICOSTEERR 2018) - Research in Industry 4.0, pages
969-974
ISBN: 978-989-758-449-7
Copyright
c
2020 by SCITEPRESS – Science and Technology Publications, Lda. All rights reserved
969

importance and performance is analyzed in the
Importance-Performance Matrix, where the x axis
represents perception while the y axis represents
hope. In pursuance of Supranto (2006:41) The level
of suitability is the result of a comparison of the
performance performance score with a score of
importance. This level of suitability will determine
the priority order of increasing factors that affect
customer satisfaction. The formula used is:
(1)
Where:
= Score the average level of attribute
performance assessment to-
= The average score of the level of importance
assessment of attributes to-
= Number of respondents
Then to calculate the average level of importance
and performance of the overall attributes using the
formula
(2)
Where:
= Performance average value of all questions
= Performance average value of all questions
= Number of question attributes
Then the results will be obtained in the form of
four quadrants according to the Figure 1.
Top priority interests
A
Maintain Achievement
B
Own priority
C
X X Performance
Top priority interests
A
Maintain Achievement
B
Own priority
C
X X Performance
Overrated
D
Y
Y
Figure 1: IPA Quadrant
Where:
A. First Quadrant (top priority) shows factors or
attributes that are considered to affect
customer satisfaction, including elements of
services that are considered very important,
but management has not implemented it
according to customer wishes. Considered
very important and unsatisfactory;
B. Second Quadrant (maintain achievement)
shows the essential service elements that have
been successfully carried out by the company,
for which it must be maintained. Considered
very important and very satisfying.
C. Third quadrant (low priority) shows some of
the less important factors for the customer, its
implementation by the average company.
Considered less important and less satisfying.
D. The last quadrant (exaggerated) shows the
factors that influence customers is less
important, but the implementation is
excessive. Considered less important but very
satisfying.
2.2 Customer Satisfaction Index (CSI)
Method
CSI is used to analyze the overall level of service user
satisfaction by looking at the expected level of
product / service attributes. CSI value in this study is
divided into five criteria according to the use of Likert
assessment. Point 5 of the level is very unsatisfactory
to very satisfying.
Irawan (2004), measurement of CSI is needed
because the results of the measurement can be used as
a reference to determine targets in the coming years.
CSI can be calculated with the following stages
1. Determine Mean Important Score (MIS) and
Mean Satisfaction Score (MSS). This value is
based on the level of importance and
performance of each respondent.
(3)
Where:
= Mean Important Score
= Mean Satisfaction Score
= number of respondents
= value of the attribute to-
= attribute performance value to -
2. Weighting Factors (WF) is a function of the
mean importance score (MISi) of each
attribute in the form of percent (%) of the total
importance score for all attributes tested by.
(4)
Where:
= Weighting Factors
ICOSTEERR 2018 - International Conference of Science, Technology, Engineering, Environmental and Ramification Researches
970
= Mean Important Score
= attributes of the marketing mix to-
3. Weighted Score (WS) is a function of the mean
satisfaction score (MSS) multiplied by WF.
(5)
Where:
= Weighted Score
= Mean Satisfaction Score
= Weighting Factors
4. The Customer Satisfaction Index (CSI)
function of the weighted average (WA)
divided by highest scale (HS / maximum scale
used in this research scale 5 multiplied by
100%)
(6)
Where:
= Customer Satisfaction Index
WA = Weighted Average
= Highest Scale
The satisfaction index criteria use a range of 0,00
to 1,00 (not satisfied until satisfied), which can be
seen in the Table 1.
Table 1: Customer Satisfaction Index Criteria
No
Value
Criteria
1
0,00 – 0,34
Not satisfied
2
0,35 – 0,50
Less satisfied
3
0,51 – 0,65
Quite satisfied
4
0,66 – 0,80
satisfied
5
0,81 – 1,00
Very satisfied
3 DISCUSSION
In this paper there were 83 respondents who were
used as samples to analyze the level of patient service
satisfaction in one hospital in Sumatra Utara.
3.1 Data Validity Testing
Validity test is conducted to determine the level of
validity of the questionnaire used in collecting data
obtained from research by correlating each score of
the respondent's answer.
Validity test is done by using SPSS 22.00 program
with the following criteria:
1. If
then the question item is
valid;
2. if
then the question item is not
valid;
3.
calculate can be seen in the column
Corrected Item Total Correlation;
4.
under the condition and
a significance level of 5% that is
= 81, using spreadsheet obtained
values
= 1,989 so that the value is
obtained
= 0,216.
The results of the validity test of respondent
perception data can be seen in Table 2. The results of
the validity test of respondent reliability data can be
seen in Table 3.
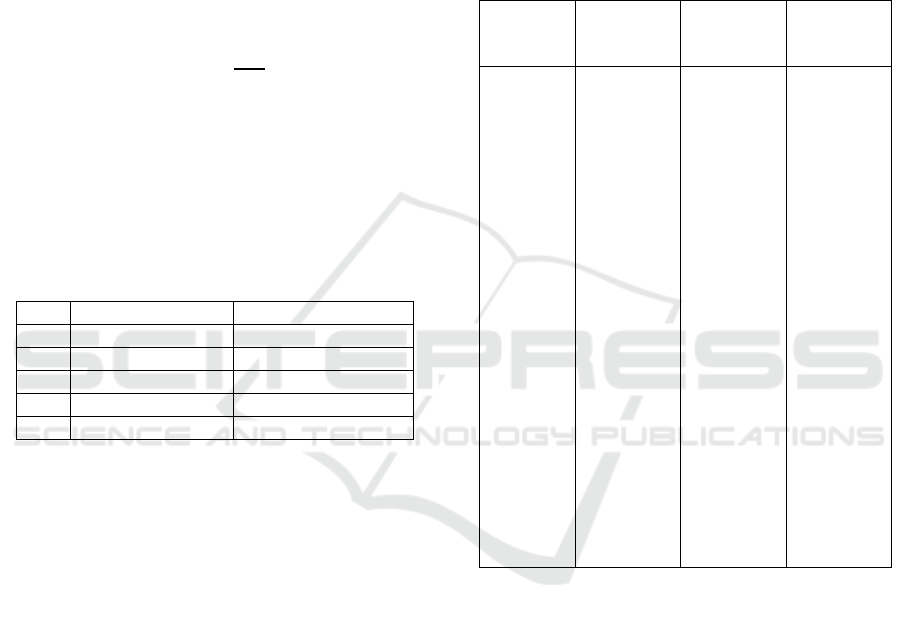
Table 2: Validity Test of Respondent Perception Data
Attributes
Pearson
Correlation
(
)
Conclusion
Q1
Q2
Q3
Q4
Q5
Q6
Q7
Q8
Q9
Q10
Q11
Q12
Q13
Q14
Q15
Q16
Q17
Q18
Q19
Q20
Q21
Q22
Q23
Q24
2,16 × 10
-1
2,16 × 10
-1
2,16 × 10
-1
2,16 × 10
-1
2,16 × 10
-1
2,16 × 10
-1
2,16 × 10
-1
2,16 × 10
-1
2,16 × 10
-1
2,16 × 10
-1
2,16 × 10
-1
2,16 × 10
-1
2,16 × 10
-1
2,16 × 10
-1
2,16 × 10
-1
2,16 × 10
-1
2,16 × 10
-1
2,16 × 10
-1
2,16 × 10
-1
2,16 × 10
-1
2,16 × 10
-1
2,16 × 10
-1
2,16 × 10
-1
2,16 × 10
-1
5,40 × 10
-1
4,55 × 10
-1
5,25 × 10
-1
7,28 × 10
-1
5,53 × 10
-1
5,77 × 10
-1
7,30 × 10
-1
7,91 × 10
-1
7,55 × 10
-1
7,86 × 10
-1
6,07 × 10
-1
8,23 × 10
-1
8,52 × 10
-1
8,41 × 10
-1
7,63 × 10
-1
7,29 × 10
-1
7,97 × 10
-1
8,26 × 10
-1
6,61 × 10
-1
7,66 × 10
-1
6,24 × 10
-1
6,21 × 10
-1
7,41 × 10
-1
6,51 × 10
-1
Valid
Valid
Valid
Valid
Valid
Valid
Valid
Valid
Valid
Valid
Valid
Valid
Valid
Valid
Valid
Valid
Valid
Valid
Valid
Valid
Valid
Valid
Valid
Valid
Where:
Q1 = Cleanliness and comfort of inpatient and
hospital facilities.
Q2 = Have a comfortable waiting room.
Q3 = The inpatient room has complete
equipment.
Q4 = Medics (doctors, nurses and medical
support) look neat and clean.
Q5 = The hospital has clear directions and
instructions.
Q6 = Medics (doctors, nurses and medical
support) provide thorough, careful and
timely services according to the specified
schedule.
Q7 = Medics (doctors, nurses and medical
support) help if the patient has a problem.
Patient Satisfaction Analysis of Service Quality with Importance Performance Analysis (IPA) Method and Customer Satisfaction Index
(CSI)
971
Q8 = The doctor tells the complete type of
disease and tells you how to treat it.
Q9 = Medics (doctors, nurses and medical
support) explain the actions to be taken.
Q10 = The medical (doctors, nurses and medical
supporters) are willing to respond to
complaints of the patient's illness.
Q11 = Responsive nurses in serving patients.
Q12 = Medics (doctors, nurses and medical
support) receive and serve patients well.
Q13 = Medics (doctors, nurses and medical
support) do the right and responsive
actions.
Q14 = Medics (doctors, nurses and medical
support) perform actions according to
procedures.
Q15 = Doctors have the ability and knowledge to
properly diagnose the disease.
Q16 = The hospital provides complete medicines.
Q17 = Medical personnel (physicians, nurses and
medical aids) are respectful of patients.
Q18 = Doctors serve with a reassuring attitude so
that patients feel safe.
Q19 = Hospitals may provide patient medical
information.
Q20 = Doctors provide good service time for
patients.
Q21 = Nurses provide services in accordance with
the schedule and patient needs.
Q22 = Nurses pay attention to patients well.
Q23 = Doctors listen to complaints of patient
illness and give suggestions / solutions.
Q24 = Nurses are polite and friendly in serving
patients.
3.2 Data Reliability Test
Test Reliability is done to find out whether the
measurement results can be trusted to be used in data
collection and used to determine the consistency of
the measuring instrument, whether the measuring
device used is reliable and remains consistent if the
measurement is repeated.
Reliability testing was carried out using the 22.00
SPSS program with the following criteria.
1. If value Cronbach’s Alpha ≥ 0,6 then the data
in this study are said to be reliable;
2. if value Cronbach’s Alpha < 0,6 then the data
in this study are said to be unreliable.
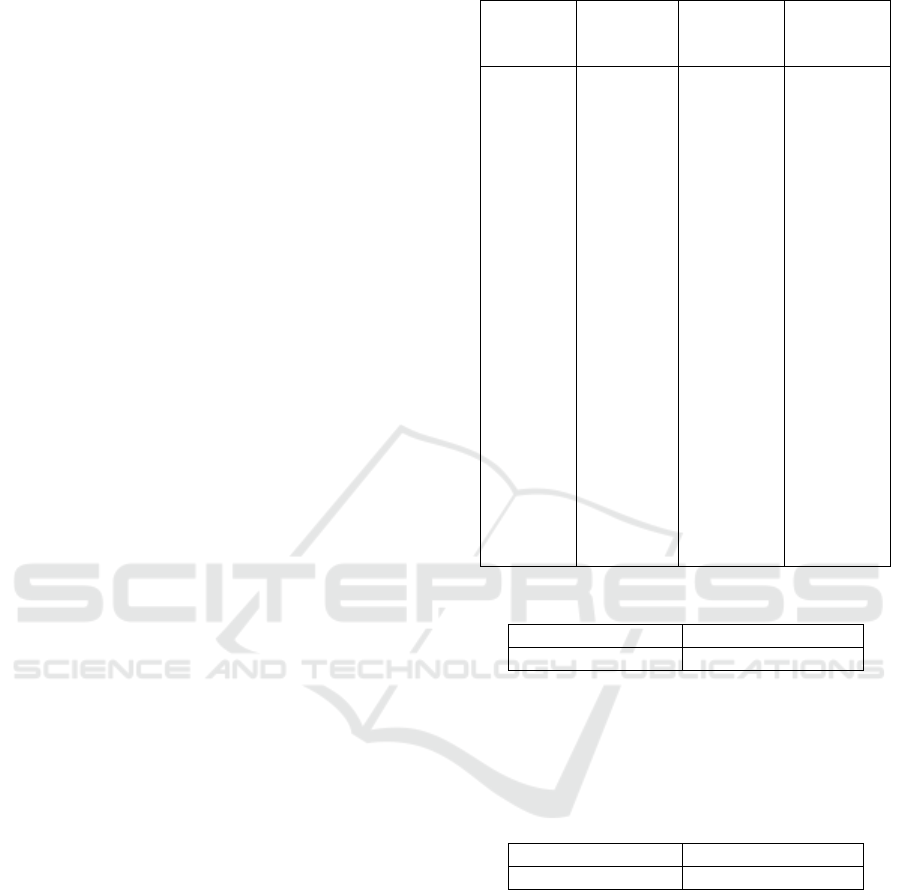
Table 3: Validity Test of Respondent Reliability Data
Attributes
Pearson
Correlation
(
)
Conclusion
Q1
Q2
Q3
Q4
Q5
Q6
Q7
Q8
Q9
Q10
Q11
Q12
Q13
Q14
Q15
Q16
Q17
Q18
Q19
Q20
Q21
Q22
Q23
Q24
2,16 × 10
-1
2,16 × 10
-1
2,16 × 10
-1
2,16 × 10
-1
2,16 × 10
-1
2,16 × 10
-1
2,16 × 10
-1
2,16 × 10
-1
2,16 × 10
-1
2,16 × 10
-1
2,16 × 10
-1
2,16 × 10
-1
2,16 × 10
-1
2,16 × 10
-1
2,16 × 10
-1
2,16 × 10
-1
2,16 × 10
-1
2,16 × 10
-1
2,16 × 10
-1
2,16 × 10
-1
2,16 × 10
-1
2,16 × 10
-1
2,16 × 10
-1
2,16 × 10
-1
8,72 × 10
-1
6,93 × 10
-1
6,65 × 10
-1
7,65 × 10
-1
7,53 × 10
-1
8,18 × 10
-1
7,85 × 10
-1
8,25 × 10
-1
8,10 × 10
-1
8,29 × 10
-1
7,84 × 10
-1
8,07 × 10
-1
8,28 × 10
-1
8,38 × 10
-1
7,73 × 10
-1
8,30 × 10
-1
8,50 × 10
-1
8,22 × 10
-1
7,26 × 10
-1
7,71 × 10
-1
8,24 × 10
-1
8,12 × 10
-1
7,43 × 10
-1
7,84 × 10
-1
Valid
Valid
Valid
Valid
Valid
Valid
Valid
Valid
Valid
Valid
Valid
Valid
Valid
Valid
Valid
Valid
Valid
Valid
Valid
Valid
Valid
Valid
Valid
Valid
Table 4: Reliability Test of Respondent Perception Data
Cronbach’s Alpha
N of Items
0,959
24
From Table 4 it can be seen that the value of
Cronbachs Alpha 0,959 ≥ 0,6 so that respondent
perception data is reliable and can be used for this
research.
Table 5: Reliability Test of Respondent Relibility Data
Cronbach’s Alpha
N of Items
0,977
24
From Table 5 it can be seen that the value of
Cronbachs Alpha 0,977 ≥ 0,6 so that respondents'
expectations data are reliable and can be used for this
research.
3.3 Analysis of Performance Interest
Level with Importance
Performance Analysis (IPA)
Method
The IPA method is used to measure the relationship
between consumer perceptions and priority of
product / service quality improvement, which is also
ICOSTEERR 2018 - International Conference of Science, Technology, Engineering, Environmental and Ramification Researches
972
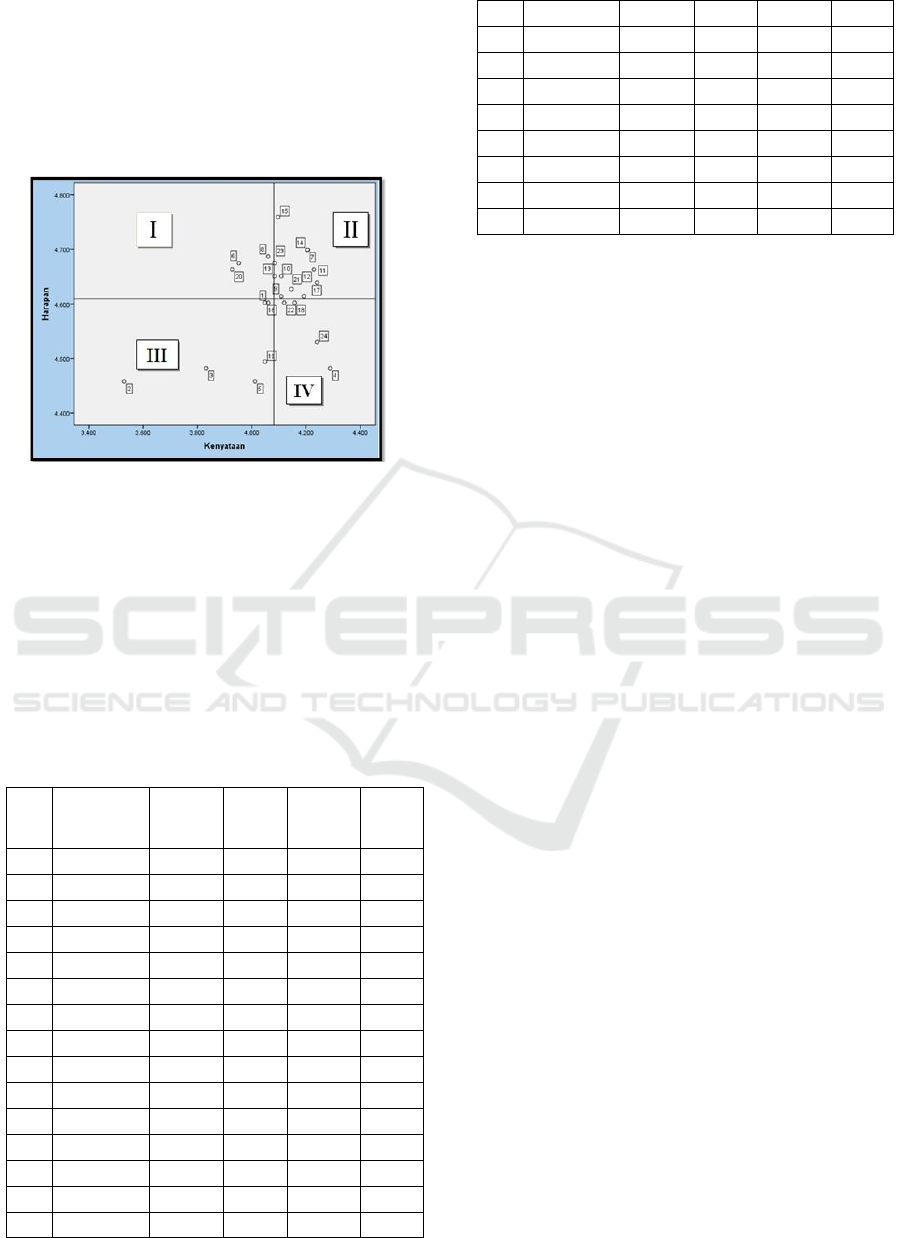
known as quadrant analysis. Quadrant analysis which
is divided into four quadrants covering the first
quadrant top priority, second quadrant maintain
achievement, third quadrant low priority and
excessive quadrant.
The quadrant IPA mapping can be seen in the
Figure 2.
Figure 2: IPA Quadrant Analysis.
3.4 Satisfaction Level Analysis with the
Method of Customer Satisfaction
Index (CSI)
Measuring the level of patient satisfaction in this
study uses the CSI method. To see the results of the
analysis of the calculation of satisfaction with the CSI
method will be explained in the table as follows.
Table 6: Calculation Result with CSI Method
No
Attributes
MSS
MIS
WF
(%)
WS
1
Q1
4,060
4,602
0,042
0,171
2
Q2
3,530
4,458
0,040
0,141
3
Q3
3,831
4,482
0,041
0,157
4
Q4
4,289
4,482
0,041
0,176
5
Q5
4,012
4,458
0,040
0,160
6
Q6
3,952
4,675
0,042
0,166
7
Q7
4,205
4,699
0,043
0,181
8
Q8
4,060
4,687
0,042
0,171
9
Q9
4,108
4,614
0,042
0,173
10
Q10
4,108
4,651
0,042
0,173
11
Q11
4,241
4,639
0,042
0,178
12
Q12
4,229
4,663
0,042
0,178
13
Q13
4,084
4,651
0,042
0,172
14
Q14
4,205
4,699
0,042
0,177
15
Q15
4,096
4,759
0,043
0,176
16
Q16
4,048
4,602
0,042
0,170
17
Q17
4,193
4,614
0,042
0,176
18
Q18
4,157
4,602
0,042
0,174
19
Q19
4,048
4,494
0,040
0,176
20
Q20
3,928
4,663
0,042
0,165
21
Q21
4,145
4,627
0,042
0.174
22
Q22
4,120
4,602
0,041
0,169
23
Q23
4,084
4,675
0,042
0,172
24
Q24
4,241
4,530
0,041
0,174
The results of the analysis applied CSI of 83
respondents the level of patient satisfaction with the
services provided by the hospital was 0,8198 so that
it was rounded to 0,82. This shows that the quality of
service in the hospital is categorized as very satisfied.
In this study identified that patients in the hospital
were very satisfied with the services provided by the
hospital.
4 CONCLUSIONS
Based on data analysis so that it can be taken
conclusion from research result, based on the level of
importance it can be seen that the most important
thing is that the doctor has the ability and knowledge
to determine the diagnosis of the disease properly
while the lowest level of importance according to the
patient is that the hospital has a fairly comfortable
waiting room and the hospital has clear directions and
instructions. Based on quadrant analysis applied IPA
method, the factors that are in the first quadrant are
factors that are considered important and expected by
consumers, but the performance of the producers has
not given satisfaction to what consumers expect
optimally, so make consumers feel disappointed. This
dimension needs to be prioritized for improvement.
By applied CSI method, the level of patient
satisfaction with the services provided by the hospital
was 0,82 indicating that the patients in the hospital
were very satisfied with the services provided by the
hospital.
ACKNOWLEDGEMENTS
We would like to thanks to Rector of Universitas
Sumatera Utara for the financial support by
TALENTA 2018 scheme.
Patient Satisfaction Analysis of Service Quality with Importance Performance Analysis (IPA) Method and Customer Satisfaction Index
(CSI)
973

REFERENCES
Agresti, A. 2018. An introduction to categorical data
analysis. Wiley.
Dwyer, L., Armenski, T., Cvelbar, L. K., Dragićević, V., &
Mihalic, T. 2016. Modified Importance–Performance
Analysis for Evaluating Tourism Businesses Strategies:
Comparison of Slovenia and Serbia. International
Journal of Tourism Research, 18(4), 327-340.
Ferreira, H. P., & Fernandes, P. O. 2015. Importance-
performance analysis applied to a laboratory supplies
and equipment company. Procedia Computer Science,
64, 824-831.
Irawan, H. 2004. Indonesian Customer Satisfaction, PT
Alex Media Komputindo. Jakarta.
John A. Martilla and John C. James. 1977. Importance
Performance Analysis. Tacoma, WA: Journal of
Marketing. Vol. 41, No.1:77-79.
Nadiri, H., & Hussain, K. 2016. Zone of Tolerance for
Healthcare Services: A Diagnostic Model of Public and
Private Hospital Service Quality. Argumenta
Oeconomica, (2 (37)), 245-280.
Park, S. K., Kim, T., & Lee, B. G. 2016. Applying
importance performance analysis (IPA) to exam
consumer behavior in multi-channel environment.
International Information Institute (Tokyo).
Information, 19(2), 397.
Rohatgi, V. K., & Saleh, A. M. E. (2015). An introduction
to probability and statistics. John Wiley & Sons.
Sembiring, P., Sinulingga, U., Situmorang, M., &
Sembiring, S. (2017, December). Representative Model
the Graph Theory in Calculations Kendall Correlation
Coefficient. In Journal of Physics: Conference
Series (Vol. 930, No. 1, p. 012040). IOP Publishing.
Sembiring, P., Sembiring, S., Tarigan, G., & Sembiring, O.
D. (2017, December). Analysis of Student Satisfaction
in The Process of Teaching and Learning Using
Importance Performance Analysis. In Journal of
Physics: Conference Series (Vol. 930, No. 1, p.
012039). IOP Publishing.
Shahin, A., & Shirouyehzad, H. 2016. Importance-
performance analysis of service quality dimensions for
the customer groups segmented by DEA. International
Journal of Quality & Reliability Management, 33(2),
160-177.
ICOSTEERR 2018 - International Conference of Science, Technology, Engineering, Environmental and Ramification Researches
974
