
Measuring the Complexity of User Processes using Shannon Entropy
and Stochastic Petri Nets
Martin Ibl and Žaneta Boruchová
Institute of System Engineering and Informatics, Faculty of Economics and Administration,
University of Pardubice, Pardubice, Czech Republic
Keywords: User-Friendliness, Petri Nets, Entropy, Complexity, Measure, Process.
Abstract: Measuring complexity of processes or systems is currently a very popular topic. There is a wide range of
defined complexity measures that quantify features such as legibility, modifiability, uncertainty,
comprehensibility, easiness of implementation, user-friendliness and many others. The content of this work
is a presentation of a method for quantification of complexity using Shannon entropy and stochastic Petri
nets. Shannon entropy and Petri nets are an appropriate combination because they allow analysing the
complexity of processes not only in terms of their structure but also in terms of their dynamic development
under tension. On a simple example are outlined possible analyses and the correlation analysis examines the
comparability with other selected complexity measures.
1 INTRODUCTION
Growth in the complexity of Information and
Communication Technologies (ICTs) is one of the
greatest challenges today. Today, ICT is not only an
integral part of all major corporations and
institutions but also influences the everyday life of
modern people in many ways.
In the area of IT management, complicated systems
bring on the advantage of being able to support all
process variants, and to meet the demanding
requirements of customers or users while giving the
company a competitive edge on the market. On the
other hand, it is penalised by higher acquisition costs,
higher maintenance expenses, changes and interfaces
with other systems. Therefore, it is important that the
information system is sophisticated (complex) enough
that it can efficiently cover the maximum of
enterprise requirements, but at the same time, it must
not contain complexity beyond these requirements.
Problems associated with quantification of complex
variables (e.g., user-friendliness, comprehensibility,
etc.) are mostly solved through a certain form of a
statistical survey among users. However, this
solution is time and cost consuming, and in many
cases, it is based on a subjective assessment of a
representative sample of the population. This paper
aims to specify a method for quantifying the
complexity of process models, i.e., the processes
themselves. The degree of complexity is, in a
number of cases, defined to assess the quality of user
interactions with the system/process that reflect
features such as clarity, usability, user friendliness,
predictability, uncertainty, modifiability, etc. The
suitability of using complexity measures to assess
user-friendliness confirms methods that allow their
theoretical validation (Weyuker, 1988).
Ergonomics and the structure of the user interface
play a significant role in the efficiency of work. The
system builder usually does not give the user-
friendliness enough weight. For example, if a user
needs 6 mouse clicks instead of two to perform a
certain activity, his productivity will deteriorate
significantly in the long run. In the case of scarcely
used applications, this does not usually play a role,
but if it is an application that for example ten people
in an enterprise work with eight hours a day, it
means tripling their work. Effects on efficiency are
obvious. It is, therefore, necessary to manage the
complexity of information systems, as otherwise
costs and risks increase and the efficiency is
reduced. Complexity in information systems is
difficult to reduce. Therefore, the main objective is
not to allow a process/system to increase its optimal
complexity, both during design and development of
the information system and during its operation and
maintenance. The optimal complexity of the
Ibl M. and Boruchovà ˛a Å¡.
Measuring the Complexity of User Processes using Shannon Entropy and Stochastic Petri Nets.
DOI: 10.5220/0006584502120217
In Proceedings of the International Conference on Computer-Human Interaction Research and Applications (CHIRA 2017), pages 212-217
ISBN: 978-989-758-267-7
Copyright
c
2017 by SCITEPRESS – Science and Technology Publications, Lda. All rights reserved

information system is the lowest possible complexity.
Complexity can be also analysed, for example, within
system integration (Jirava and Toseafa, 2016) or
social network analysis (Panus, 2016).
2 MEASURES OF COMPLEXITY
Analysing complexity at all stages of process
lifecycle development helps to avoid the
disadvantages associated with high complexity.
Currently, organizations have not accepted
complexity metrics as part of their process
management projects. As a result, simple processes
can be designed unnecessarily complex. Using
Complexity analysis helps design and implement
processes and workflows that are more simple,
reliable, and robust. In-depth analysis is needed to
correct defects in high complexity process parts.
Three questions are often asked when measuring the
complexity of a process (Lloyd, 2001):
How difficult is the process to describe?
How difficult is the process to create?
What is the level of organization?
According to (Lloyd, 2001), complexity
measurements can be grouped into the following
categories depending on which question they are
dealing with:
Difficulty of description, typically measured in
bits, including Information and Entropy
(Shannon, 1948), Algorithmic Information
Content (Zurek, 1990), Minimum Description
Length (Rissanen, 1978), Fisher information
(Lehmann and Casella, 2006), Renyi entropy
(Renyi, 1960), Code Length (Huffman, 1952),
Chernoff information (Chernoff, 1972, Nielsen,
2011), Lempel-Ziv complexity (Lempel and
Ziv, 1976), Dimension and Fractal Dimension
(Mandelbrot and Hudson, 2004);
Difficulty of creation, working with time,
currency, or energy, such as Computational
Complexity (Arora and Barak, 2009), Time
Computational Complexity, Spatial
Computational Complexity, Information-based
Complexity (Traub et al., 1988), Logical Depth
(Bennett, 1995), Thermodynamic Depth (Lloyd
and Pagels, 1988), Cost and Crypticity
(Mahoney et al., 2011);
The degree of organization that can be divided
into the difficulty of describing the
organizational structure and the amount of
information divided into the parts of the system.
This category includes, for example, Metric
Entropy (Lorentz, 1966), Stochastic Complexity
(Rissanen, 1996), Sophistication (Mota et al.,
2013), Effective Complexity (GellMann and
Lloyd, 1996), True Complexity, Ideal
Complexity, Hierarchical Complexity
(Commons et al., 1998), Schema length,
Grammar complexity, Mutual Information
(Shannon, 1948).
Measurement has a long tradition and is a basic
discipline in any type of engineering. Engineers
must be experienced in estimating and valuing,
which means understanding the activities and risks
associated with process development, forecasting
and managing activities, risk management, reliable
delivery and proactive management to avoid a crisis.
One of the most sophisticated methodologies to
analyse the complexity of business processes has
been developed by Cardoso (Cardoso, 2008), which
identifies four main views of complexity levels,
namely complexity of activities, control-flow
complexity, data-flow complexity and complexity of
resources.
Another, widely used complexity measure is
McCabe’s Cyclomatic Complexity (MCC)
(McCabe, 1976). Since its development, it has been
one of the most promising software metrics. The
resulting empirical knowledge base has enabled
software developers to calibrate their own software
measurements and gain some understanding of its
complexity. Software metrics are often used to
obtain a quantitative expression of program
complexity. They cannot be confused with the
complexity of algorithms that aim to compare the
performance of the algorithm. It has been found that
software metrics are useful in reducing software
maintenance costs by assigning a numeric value that
reflects the easiness or difficulty of with which the
program module can be understood.
Finally, we can mention the entropy-based measure
of complexity (Jung et al., 2011). However, the
entropy is calculated only from the model structure
and ignores its dynamic component.
3 ENTROPY-BASED MEASURE
OF COMPLEXITY IN
STOCHASTIC PETRI NETS
The Petri nets are a suitable tool for modelling and
analysing discrete event dynamic systems that are
characterised by concurrency, parallel processing,
synchronization, or non-determinism. Their main
advantage is the ability to accurately verify
assumptions imposed on the model. Since the 1960s,
when Petri nets were defined by Carl Adam Petri
(Petri, 1962), their development has evolved in a
number of directions. One way was to extend the
original definition of new elements, the example of
which is the stochastic Petri nets.
Stochastic Petri Nets (SPN) are predominantly
used for performance analyses (Ajmone Marsan,
1990). Problems associated with stochastic
processes in connection with Petri nets include, for
example (Ciardo et al., 1994, Haas, 2002)
A Stochastic Petri net (Molloy, 1981) is a 7-
tuple, =(,,,Λ,,,
)where:
• ={
,
,
,
,…,
} – a finite set of
places,
• ={
,
,
,…,
}– a finite set of
transitions,
• ∩ = ∅ – places and transitions form
disjoint sets,
• ⊆(⨯)∪(⨯) – a set of
edges, defined as a subset of all possible
connections,
• Λ: →
– a parameter of exponential
distribution for transitions,
• : →
– a weighting function that
defines the multiplicity of edges,
• :→
– capacity of places,
•
:→
– an initial marking.
Entropy of a Stochastic Petri net
Let =(,,,Λ,,,
) is a Stochastic
Petri net, (
) is the set of all reachable markings
and is a vector of steady-state probabilities
=
Pr
(
)
,
∈(
). Entropy of is defined as:
(
)
=−
log
|
(
)
|
4 EXAMPLE OF A SIMPLE
MODEL AND COMPARISON
TO OTHER MEASURES
The presented method for quantification of entropy
in stochastic Petri nets is, in this section, illustrated
with a sample example. In addition, a comparison
will be made with selected alternative measures of
complexity.
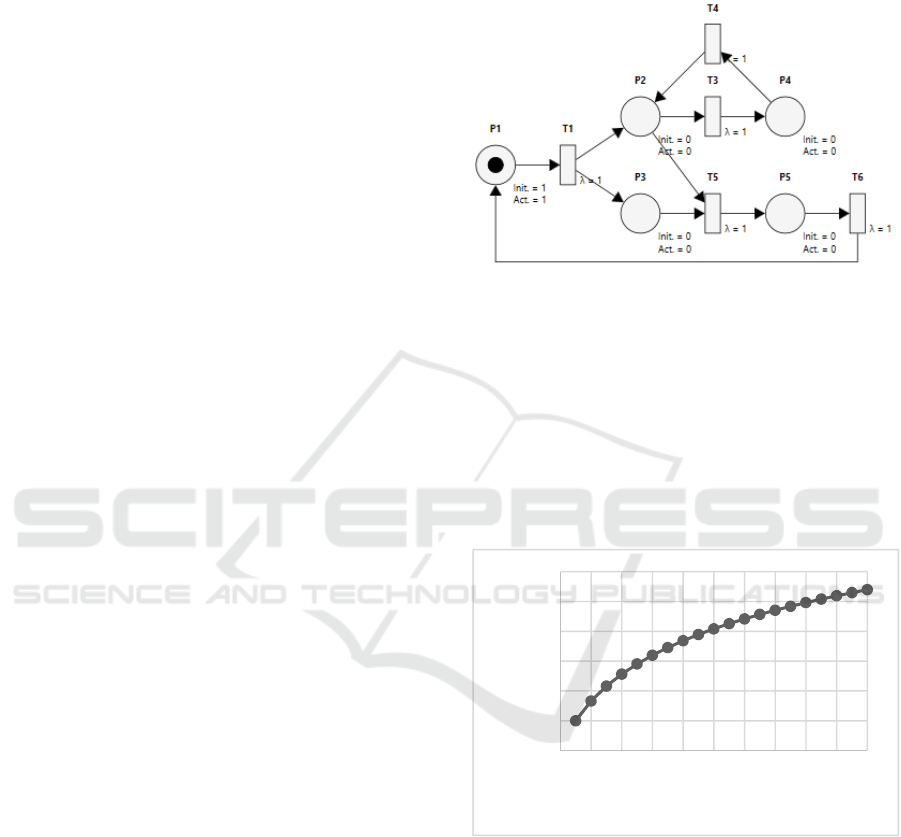
Figure 1 represents a process model consisting of
5 places and 5 transitions. The model can represent
any process, for example, the business process,
workflow, software process, etc.
Figure 1: Petri net example.
The entropy of this example is equal to 1.9219.
For comparison, the MCC is equal to 5 and
Cardoso’s Control-Flow Complexity (CFC) measure
equals 2. The advantage of this measure is the ability
to analyse the complexity change with increasing
tension (number of tokens) of the process under
investigation. Figure 2 illustrates the increasing
entropy with an increasing number of tokens at the
place P1.
Figure 2: Entropy development with different number of
tokens at P1.
Moreover, the calculation of entropy in the Petri
nets allows quantification of the upper limit of
complexity, which is equal to the maximum entropy.
Figure 3 shows the values of entropy divided by the
maximum entropy, which we denote the uncertainty
index. It can be seen from the figure that with the
increasing number of tokens at P1, the index
approaches one, i.e., with the increasing number of
tokens the process approaches its maximum entropy.
0
2
4
6
8
10
12
0 2 4 6 8 10 12 14 16 18 20
Entropy
Number of tokens at P1

Figure 3: Uncertainty index development with different
number of tokens at P1.
Since other complexities do not allow the
process to be analysed under tension, the
comparison of selected methods is performed
without consideration of tokens. Table 1. illustrates
the results of the correlation analysis of selected
complexity computation methods, namely the
entropy in SPN, MCC, Entropy-Based Uncertainty
(EBU) measure and Cardoso’s CFC measure.
Table 1: Correlations.
Entropy MCC EBU CFC
Entropy
Pearson
Correlation
1 ,844** ,877** ,914**
Sig. (2-tailed) ,008 ,004 ,001
N
8 8 8 8
MCC
Pearson
Correlation
,844** 1 ,862** ,780*
Sig. (2-tailed) ,008 ,006 ,022
N
8 8 8 8
EBU
Pearson
Correlation
,877** ,862** 1 ,724*
Sig. (2-tailed) ,004 ,006 ,042
N
8 8 8 8
CFC
Pearson
Correlation
,914** ,780* ,724* 1
Sig. (2-tailed) ,001 ,022 ,042
N
8 8 8 8
*. Correlation is significant at the 0.05 level (2-tailed).
**. Correlation is significant at the 0.01 level (2-tailed).
The results show a significant dependency between
all selected.
5 DISCUSSION
Measurement of complexity in dynamic systems is a
growing topic that is rapidly evolving mainly in
economics and informatics. Quantification of
complexity aims to better understand and tailor
(optimize) the development or design of systems or
processes in the sense of user interaction. The use of
information technology is still expanding (e.g., the
Internet of Things) and therefore it is necessary to
take into account the complexity of user interfaces
and processes, i.e. to make the user interface as
simple as possible and to make the important
processes intuitive and transparent (predictable).
In this work was presented the approach of
quantification of the complexity of any process
modelled in Petri nets. Most existing approaches
(Lloyd, 2001, Jung et al., 2011, Cardoso, 2008,
Vanderfeesten et al., 2008) for complexity
measurements only work with the structure of the
process, i.e., it is a simple formula that calculates the
occurrence of certain structures. Petri nets, however,
uses tokens to represent dynamic processes and thus
extend the static structure of the process.
Quantification of entropy in Petri nets allows us to
interpret both the structure and the dynamics of the
behaviour of the process and thus greatly enhances
the predictive ability of complexity as the implicit
property of any system. On the simple example, a
comparison of selected complexity measure with
entropy was made and it is obvious from the
conclusion that they are comparable. The case study
outlined the possible analyses that can be
implemented by entropy in the process. One of the
useful analyses is the exploration of the complexity
of the process with increasing process tension
(increasing number of tokens in the initial marking).
This type of analysis allows, for example, revealing
critical process values (occurrence of phase
transitions) or total scalability of robustness.
Another type of analysis is, for example, sensitivity
analysis, i.e., monitoring the development of
complexity when changing any process parameter.
In stochastic Petri nets, sensitivity analysis is mainly
coupled with testing of various lambda parameters at
transitions. Measurement of complexity is mainly a
tool for decision support, i.e., among functionally
equivalent solutions, the decision maker choose the
one with the lowest entropy.
Advantages of this approach
• Universal approach for measuring the
complexity of processes that can be
modelled using stochastic Petri nets.
0,95
0,96
0,97
0,98
0,99
1
0 2 4 6 8 101214161820
Uncertainty index
Number of tokens at P1

• The possibility of using the verification
features of Petri nets such as liveness,
boundedness, reachability etc.
• The possibility to set specific
probabilities (exponential distribution)
for branching in the model.
Disadvantages of this approach
• Fundamental shortcomings of Petri nets
in general, i.e., state explosion,
restrictions based on definitions, etc.
6 CONCLUSION AND FUTURE
WORK
In this paper, an approach to quantification of
complexity in Petri nets was defined using the
Shannon entropy. Based on the comparison with the
existing measures, a statistically significant
dependence was found, i.e., the selected measures
are comparable. Quantification of complexity using
entropy in stochastic Petri nets, however, brings a
number of advantages over other measures. The
main advantage of the defined measure is the ability
to investigate the development of complexity while
change process tension (robustness analysis) or
sensitivity analysis (complexity response to
changing, for example, any lambda parameter). In
addition, this approach can be generalized to a whole
range of modelling tools, namely any Petri nets
(timed, generalized stochastic, coloured, etc.), multi-
agent approaches, Markov chains, and more. The
presented approach can be used mainly as a
supporting tool for decision-making.
Future research will focus on expanding the
presented approach to the other above-mentioned
modelling tools as well as deepening, broadening
and generalizing the analyses that can be
implemented by entropy in any process.
ACKNOWLEDGEMENTS
The paper was supported by the University of
Pardubice, Faculty of Economics and
Administration, Project SGS_2017_017.
REFERENCES
Ajmone Marsan, M. 1990. Stochastic Petri nets: an
elementary introduction. In: Grzegorz, R. (ed.)
Advances in Petri nets 1989. Springer-Verlag New
York, Inc.
Arora, S. & Barak, B. 2009. Computational complexity: a
modern approach, Cambridge University Press.
Bennett, C. H. 1995. Logical depth and physical
complexity. The Universal Turing Machine A Half-
Century Survey, 207-235.
Cardoso, J. 2008. Business Process Control-Flow
Complexity: Metric, Evaluation, and Validation.
International Journal of Web Services Research
(IJWSR), 5, 49-76.
Ciardo, G., German, R. & Lindemann, C. 1994. A
characterization of the stochastic process underlying a
stochastic Petri net. IEEE Transactions on Software
Engineering, 20, 506-515.
Commons, M. L., Trudeau, E. J., Stein, S. A., Richards, F.
A. & Krause, S. R. 1998. Hierarchical complexity of
tasks shows the existence of developmental stages.
Developmental Review, 18, 237-278.
GellMann, M. & Lloyd, S. 1996. Information measures,
effective complexity, and total information.
Complexity, 2, 44-52.
Haas, P. J. 2002. Stochastic Petri Nets: modelling,
stability, simulation, New York, Springer.
Huffman, D. A. 1952. A method for the construction of
minimum-redundancy codes. Proceedings of the IRE,
40, 1098-1101.
Chernoff, H. 1972. Sequential analysis and optimal
design, SIAM.
Jirava, P. & Toseafa, E. 2016. Integration of Enterprise
Resource Planning System in the Multinational
Corporation Case Study, Norristown, Int Business
Information Management Assoc-Ibima.
Jung, J.-Y., Chin, C.-H. & Cardoso, J. 2011. An entropy-
based uncertainty measure of process models.
Information Processing Letters, 111, 135-141.
Lehmann, E. L. & Casella, G. 2006. Theory of point
estimation, Springer Science & Business Media.
Lempel, A. & Ziv, J. 1976. On the complexity of finite
sequences. IEEE Transactions on information theory,
22, 75-81.
Lloyd, S. 2001. Measures of complexity: a nonexhaustive
list. IEEE Control Systems, 21, 7-8.
Lloyd, S. & Pagels, H. 1988. Complexity as
thermodynamic depth. Annals of physics, 188, 186-
213.
Lorentz, G. 1966. Metric entropy and approximation.
Bulletin of the American Mathematical Society, 72,
903-937.
Mahoney, J. R., Ellison, C. J., James, R. G. & Crutchfield,
J. P. 2011. How hidden are hidden processes? A
primer on crypticity and entropy convergence. Chaos:
An Interdisciplinary Journal of Nonlinear Science, 21,
037112.
Mandelbrot, B. B. & Hudson, R. L. 2004. The
(mis)behavior of markets: a fractal view of risk, ruin,
and reward, New York, Published by Basic Books.
Mccabe, T. J. 1976. A Complexity Measure. IEEE Trans.
Softw. Eng., 2, 308-320.
Molloy, M. K. 1981. On the integration of delay and

throughput measures in distributed processing models.
Mota, F., Aaronson, S., Antunes, L. & Souto, A.
Sophistication as randomness deficiency.
International Workshop on Descriptional Complexity
of Formal Systems, 2013. Springer, 172-181.
Nielsen, F. 2011. Chernoff information of exponential
families. arXiv preprint arXiv:1102.2684.
Panus, J. 2016. A Discussion of Random Graph Models
Utilization For Global Strategic Management, Zilina,
Univ Zilina, Fac Operation & Economics Transport &
Communication.
Petri, C. A. 1962. Kommunikation mit Automaten. Bonn:
Institut für Instrumentelle Mathematik, Schriften des
IIM Nr. 2.
Renyi, A. On measures of information and entropy.
Proceedings of the 4th Berkeley Symposium on
Mathematics, Statistics and Probability, 1960. 547-
561.
Rissanen, J. 1978. Modeling by shortest data description.
Automatica, 14, 465-471.
Rissanen, J. J. 1996. Fisher information and stochastic
complexity. IEEE Transactions on Information
Theory, 42, 40-47.
Shannon, C. E. 1948. A mathematical theory of
communication. Bell System Technical Journal, 27,
379-423.
Traub, J. F., Wasilkowski, G. W. & Wozniakowski, H.
1988. Information-based complexity, Academic Press
New York.
Vanderfeesten, I., Reijers, H. A., Mendling, J., Van Der
Aalst, W. M. P. & Cardoso, J. 2008. On a Quest for
Good Process Models: The Cross-Connectivity
Metric. In: Bellahsène, Z. & Léonard, M. (eds.)
Advanced Information Systems Engineering: 20th
International Conference, CAiSE 2008 Montpellier,
France, June 16-20, 2008 Proceedings. Berlin,
Heidelberg: Springer Berlin Heidelberg.
Weyuker, E. J. 1988. Evaluating Software Complexity
Measures. IEEE Trans. Softw. Eng., 14, 1357-1365.
Zurek, W. H. 1990. Algorithmic information content,
Church-Turing thesis, physical entropy, and Maxwell's
demon. Los Alamos National Lab., NM (USA).
