
Automated Diagnostic Model Based on Heart Tissue Isoline Map
Analysis
Olga Senyukova
1
, Danuta Brotikovskaya
1
, Svetlana Gorokhova
2,3
and Ekaterina Tebenkova
3
1
Faculty of Computational Mathematics and Cybernetics, Lomonosov Moscow State University,
2nd Education Building, GSP-1, Leninskie Gory, 119991, Moscow, Russian Federation
2
FSBEI FPE Russian Medical Academy of Continuous Professional Education,
Barrikadnaya str. 2/1, 125993, Moscow, Russian Federation
3
Research Clinical Center of JSC Russian Railways, Chasovaya str. 20, 125315, Moscow, Russian Federation
Keywords:
Heart Disease Diagnostics, LV Myocardium Analysis, Isoline Map, Supervised Machine Learning, Support
Vector Machine, Random Forest, Cardiac Computed Tomography.
Abstract:
Automated heart disease diagnostics is an important problem, especially for tissue structure defect cases. A
new approach to automated diagnostics based on supervised machine learning algorithms is described in this
paper. Main heart tissue layer, left ventricle myocardium, characteristics based on isoline map analysis are
utilized at feature model construction stage. Histogram-based features are also extracted for comparison with
the proposed method. Feature selection using chi-squared test and information gain is performed. SVM and
Random Forest classifiers are used for normal/abnormal classification of left ventricle myocardium images.
Different combinations of feature models and classifiers were evaluated and promising results were achieved.
Isoline map-based features demonstrated superiority over histogram-based feature model and the best F-score
value was above 96% on real data.
1 INTRODUCTION
Automated diagnostics of diseases is one of the most
challenging problems of computer science, since
manual diagnostics is a time consuming process that
requires highly qualified experts. Heart diseases are
the leading cause of death around the world including
Russia (Nichols et al., 2014). Injury of heart develops
from non-inflammatory and inflammatory pathologi-
cal processes. Myocardial infarction and cardiomy-
opathies are the major causes of severe heart failure,
arrhythmias and sudden death. Myocardial infarction
is a clinical form of coronary heart disease that refers
to coronary artery occlusion, ischemia and myocar-
dial cells death. Cardiomyopathy includes a group
of diseases of the heart muscle tissue, myocardium.
Such diseases usually manifest as heart tissue struc-
ture defects (see Figure 1), therefore methods based
on computer vision may be applied for diagnostics.
Since left ventricle myocardium (LV myocardium) is
the main part of heart muscle tissue, this region is usu-
ally considered for diagnostics.
Magnetic resonance imaging (MRI) and contrast-
enhanced computed tomography (CT) are the most
commonly used medical imaging protocols for the
moment. Several MRI-based myocardial infarction
diagnostic approaches based on deep learning algo-
rithms (Xu et al., 2017), Bayesian probability model
(Wang et al., 2014), Linear Discriminate Analysis us-
ing intensity characteristics (Afshin et al., 2011) were
introduced. For myocardial structure analysis one key
advantage of cardiac CT images is that they directly
visualize tissue density at the point, and CT scanners
are also much more accessible than MRI. So CT im-
ages analysis is a relevant problem for the heart tissue
disease diagnostics.
Heart disease diagnostics can be considered as bi-
Figure 1: Contrast-enhanced CT images of heart. Left ven-
tricle myocardium area is highlighted in yellow. A: Healthy
myocardium. B: Myocardial injuries (red boxes).
Senyukova O., Brotikovskaya D., Gorokhova S. and Tebenkova E.
Automated Diagnostic Model Based on Heart Tissue Isoline Map Analysis.
DOI: 10.5220/0006518203600366
In Proceedings of the 9th International Joint Conference on Computational Intelligence (IJCCI 2017), pages 360-366
ISBN: 978-989-758-274-5
Copyright
c
2017 by SCITEPRESS – Science and Technology Publications, Lda. All rights reserved
nary classification problem. Since a CT scanner pro-
duces a set of images of two-dimensional slices and
heart disease may be visible only on certain slices,
they should be used as classification objects.
To the best of our knowledge only a few papers
dedicated to heart tissue analysis on CT images using
machine learning approach, exist. The most similar
research was made in (Antunes et al., 2016) where
texture analysis of myocardium aimed to detect post
myocarditis scars using several CT acquisition tech-
niques: basal scans before and after iodine contrast
agent injection, CT angiographic images and myocar-
dial extracellular volume fraction map. Detection al-
gorithm based on Random Forest classifier (Breiman,
2001) application and feature model based on statis-
tical characteristics of CT images histograms was de-
veloped and promising results were achieved.
Another approach to automated myocardial in-
farction diagnostics based on myocardium strain
modeling and analysis using CT images was intro-
duced in (Wong et al., 2015) and further developed
in (Wong et al., 2016). Supervised machine learning
algorithms were applied. For feature selection the left
ventricle was divided into 17 zones of the American
Heart Association (AHA) nomenclature (Cerqueira
et al., 2002). Each zone was used for mean strains
and mean intensity computation. At the classification
stage Random Forest and Support Vector Machine,
SVM (Boser et al., 1992), algorithms were compared.
Experiments revealed consistent improvement while
using combination of strain and intensity-based fea-
tures compared to strain-only based model, which
shows significance of intensity values for myocardial
infarction diagnostics.
Both existing methods of tissue analysis in-
volve only histogram-based characteristics of the my-
ocardium scan, which are highly sensitive to noise.
Another common computer vision approach, deep
neural networks (DNNs), is not applied in this work
due to low amount of data provided for training and
testing purposes. Also DNNs are usually applied
when it is difficult to select feature representation,
and they require significant computational power. In
this work we introduce feature representation of my-
ocardium area based on isoline map. An isoline of
certain level on the image is a curve along which the
image has constant intensity level. An isoline map
is a set of isolines of one or several levels. Isoline
analysis is a convenient tool providing intuitive repre-
sentation of data with small computational costs, that
has been successfully applied to other medical image
analysis tasks (Senyukova, 2014). Isoline map allows
to detect certain patterns in an image and provide ro-
bust quantitative description which is more informa-
tive than histogram-based characteristics and less sen-
sitive to noise. In this research the best isoline map
features were selected by two statistical significance
tests: information gain criteria and chi-squared test.
Selected features were used for classification by Sup-
port Vector Machine and Random Forest. The pro-
posed algorithms were implemented and all isoline-
based feature models chosen by feature selection cri-
teria demonstrated consistent diagnostics quality im-
provement over histogram-only methods.
The rest of the paper is organized as follows. Sec-
tion 2 describes the proposed algorithm of heart dis-
ease diagnostics based on isoline map analysis. The
experimental results and the discussion are provided
in Section 3. The conclusions are drawn in Section 4.
2 ISOLINE MAP-BASED HEART
DISEASE DIAGNOSTICS
The proposed algorithm for automated heart disease
diagnostics based on heart tissue structure analysis
consists of two steps: 1) isoline maps building and
statistical characteristics calculation and 2) classifica-
tion of extracted features into two classes: ”normal”,
”abnormal”.
2.1 Noise Robustness of Isoline Map
Representation
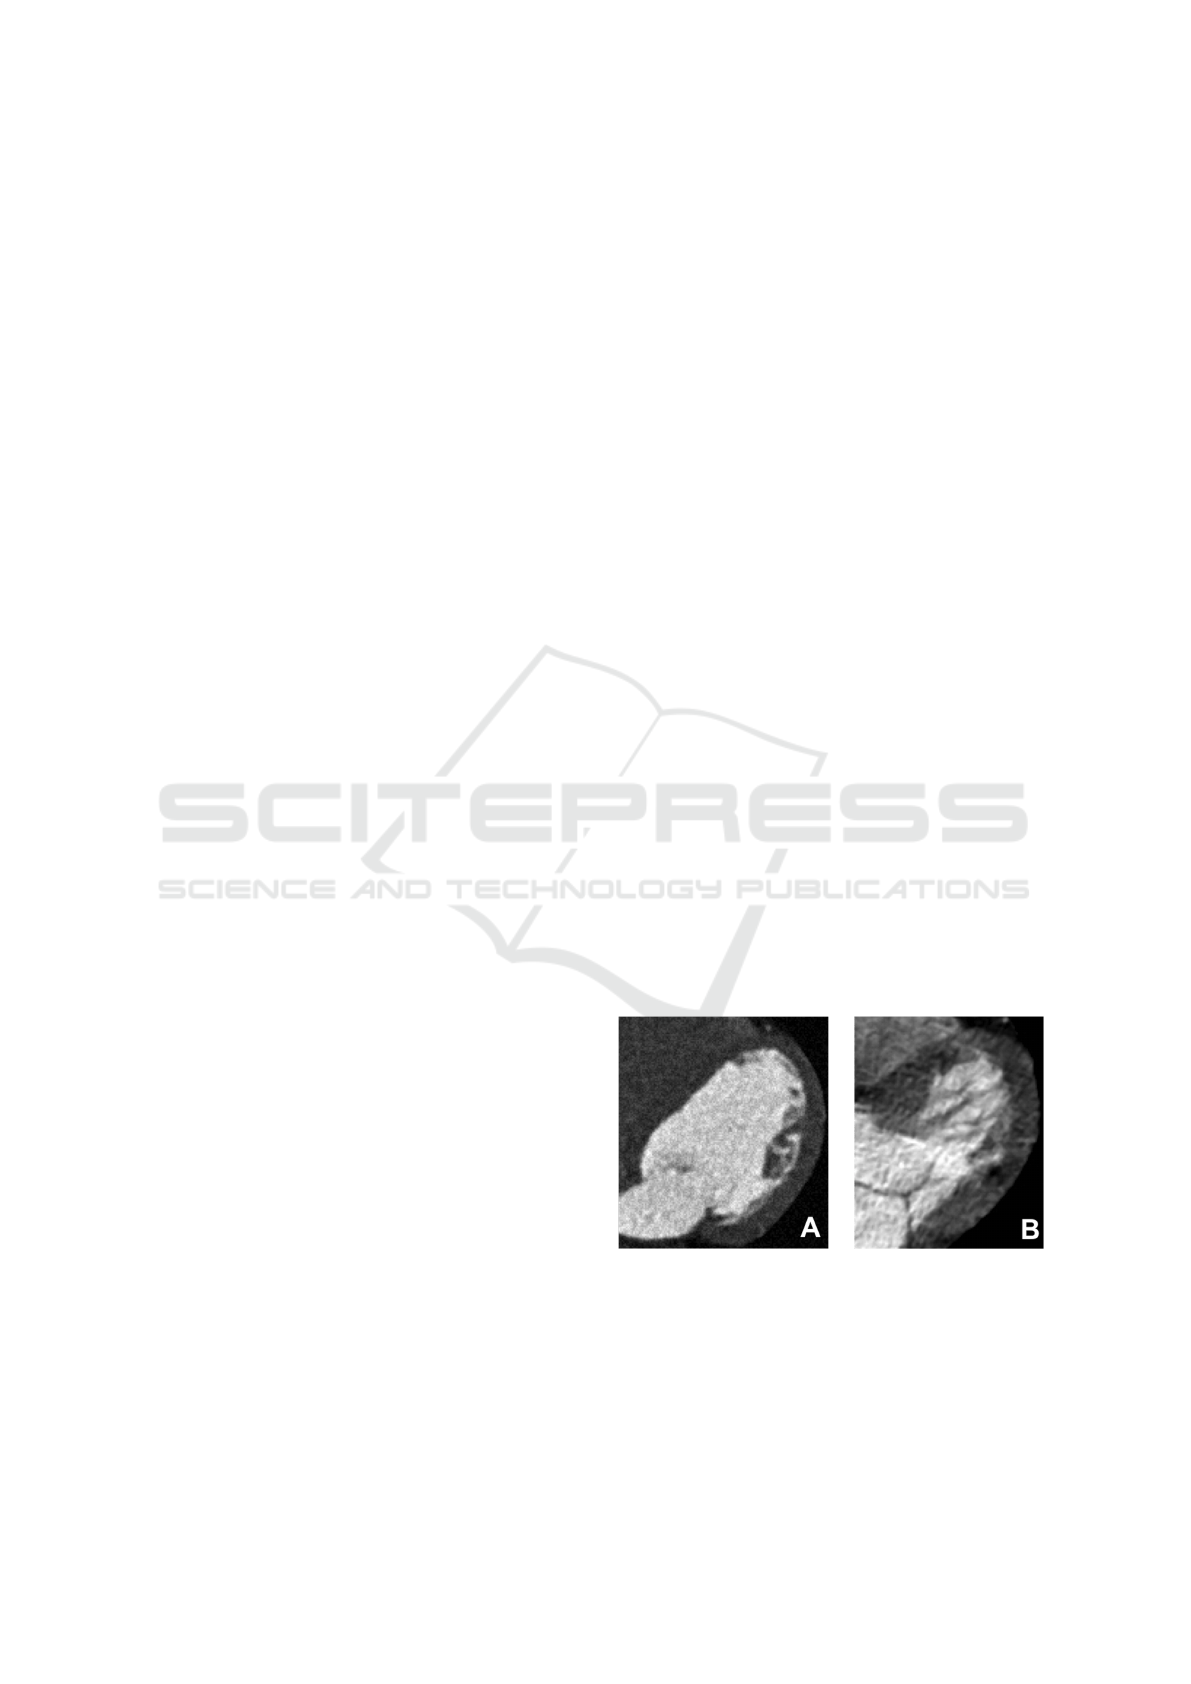
Consider two contrast-enhanced CT images of LV
myocardium: healthy myocardium image with noise
(Figure 2.A) and image of tissue with injuries (Figure
2.B).
Figure 2: LV myocardium contrast-enhanced CT images.
A: Healthy myocardium with noise in the image. B: My-
ocardial injury.
In Figure 3 intensity histogram of LV myocardium
in healthy case (Figure 2.A) is presented as blue area.
LV myocardium tissue with injuries image (Figure
2.B) histogram is presented as red area. Common part
of two histograms is colored with purple. It can be
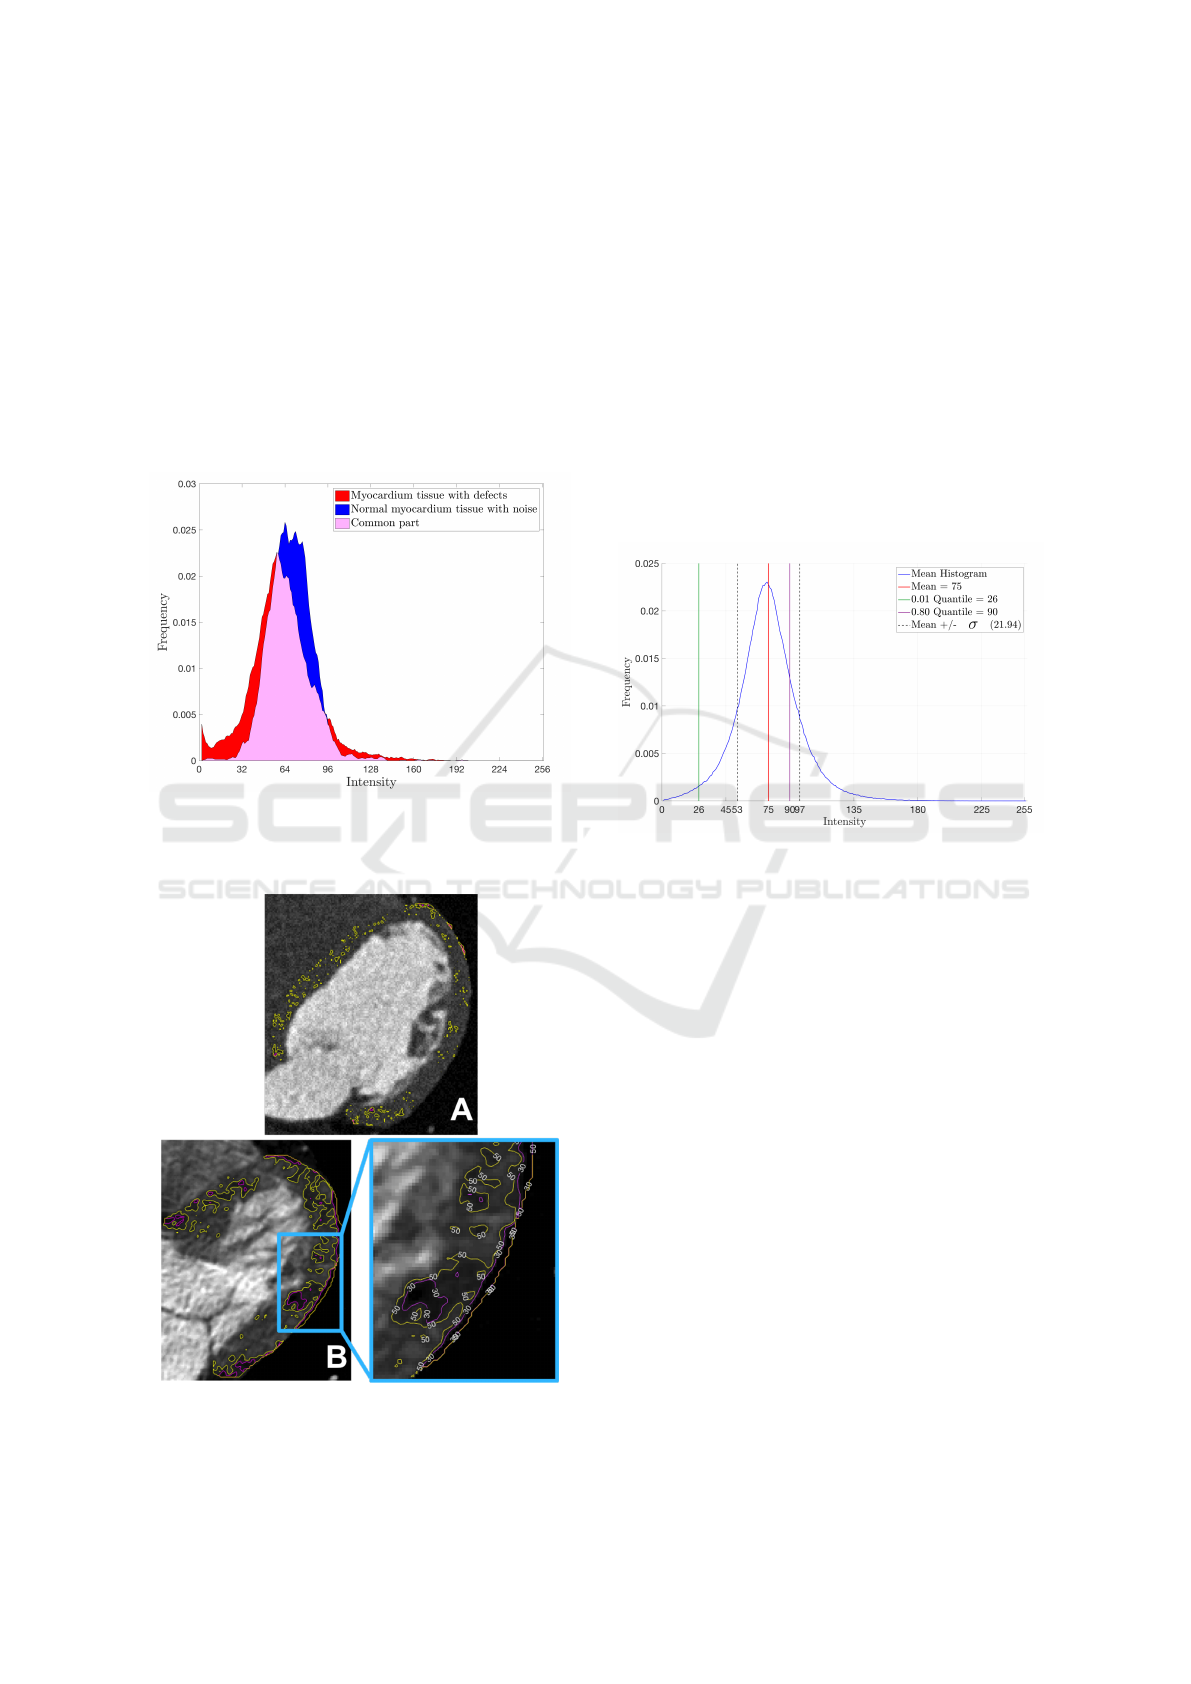
seen that areas overlap significantly and decision rule
construction for differentiation of normal and abnor-
mal cases is complicated.
At the same time considering isoline maps of cer-
tain levels allows to obtain quantitative indexes that
characterize the presence of injury on the image. As
it is demonstrated in Figure 4, isoline maps of lev-
els 30 and 50 represent substantially different patterns
for healthy case tissue with noise and tissue with in-
jury which makes isoline map-based features much
more informative for classification than histogram-
based features.
Figure 3: Intensity histogram comparison of healthy my-
ocardium with noise in the image (blue) and tissue image
with injury (red). Two histograms common part is colored
with purple.
Figure 4: Double-level (30, 50) isoline maps examples. A:
Healthy myocardium with noise in the image. B: Myocar-
dial injury.
2.2 Feature Extraction
2.2.1 Choosing Intensity Range
According to contrast-enhanced CT imaging proper-
ties, pixel intensity is determined by tissue density at
the point. For that reason only fixed intensity lev-
els are to be considered in myocardium tissue anal-
ysis task. According to Figure 5, after building a his-
togram of LV myocardium area in [0,255] intensity
range, averaged over sample images of both classes
smoothed with a Gaussian kernel, it can be shown that
intensity distribution of the region of interest is close
to normal distribution with mean 75 and standard de-
viation 21.94.
Figure 5: Intensity histogram of LV myocardium averaged
over normal and abnormal samples (blue graph). Distribu-
tion mean (red line), 0.01 quantile (green line), 0.80 quan-
tile (purple line).
As it can be seen from Figure 5, the 0.8 quan-
tile has the value 90, which means that 80% of pix-
els of the region of interest have the intensity value
less or equal to 90. So 90 was chosen as a right bor-
der of the intensity range. Intensity values of pixels
corresponding to injuries tend to decrease, as demon-
strated in Figure 1. So the 0.01 quantile value equal
to 26, rounded to 30, was chosen as a left border of
the intensity range. Thus, the intensity range [30, 90]
was chosen for isoline map-based feature extraction
and histogram-based feature extraction that was im-
plemented for comparison with the proposed method.
2.2.2 Isoline Maps Construction
Since each intensity level characterizes different tis-
sue types presented on the image, several isoline maps
for uniformly distributed intensity levels were built
for LV myocardium area and further separately ana-
lyzed. As a result two isoline map models were used:
• Singe-level isoline maps. 31 isoline maps were
built with corresponding levels: {30}, {32},
{34}, {36}, ... {90}.
• Double-level isoline maps. Level distribution for
built isoline maps is presented in Table 1.
Table 1: Levels of double-level isoline maps.
Map Intensity Map Intensity
number levels number levels
1 30, 35 7 60, 65
2 35, 40 8 65, 70
3 40, 45 9 70, 75
4 45, 50 10 75, 80
5 50, 55 11 80, 85
6 55, 60
Isoline map building procedure was based on the
contouring algorithm from MATLAB online docu-
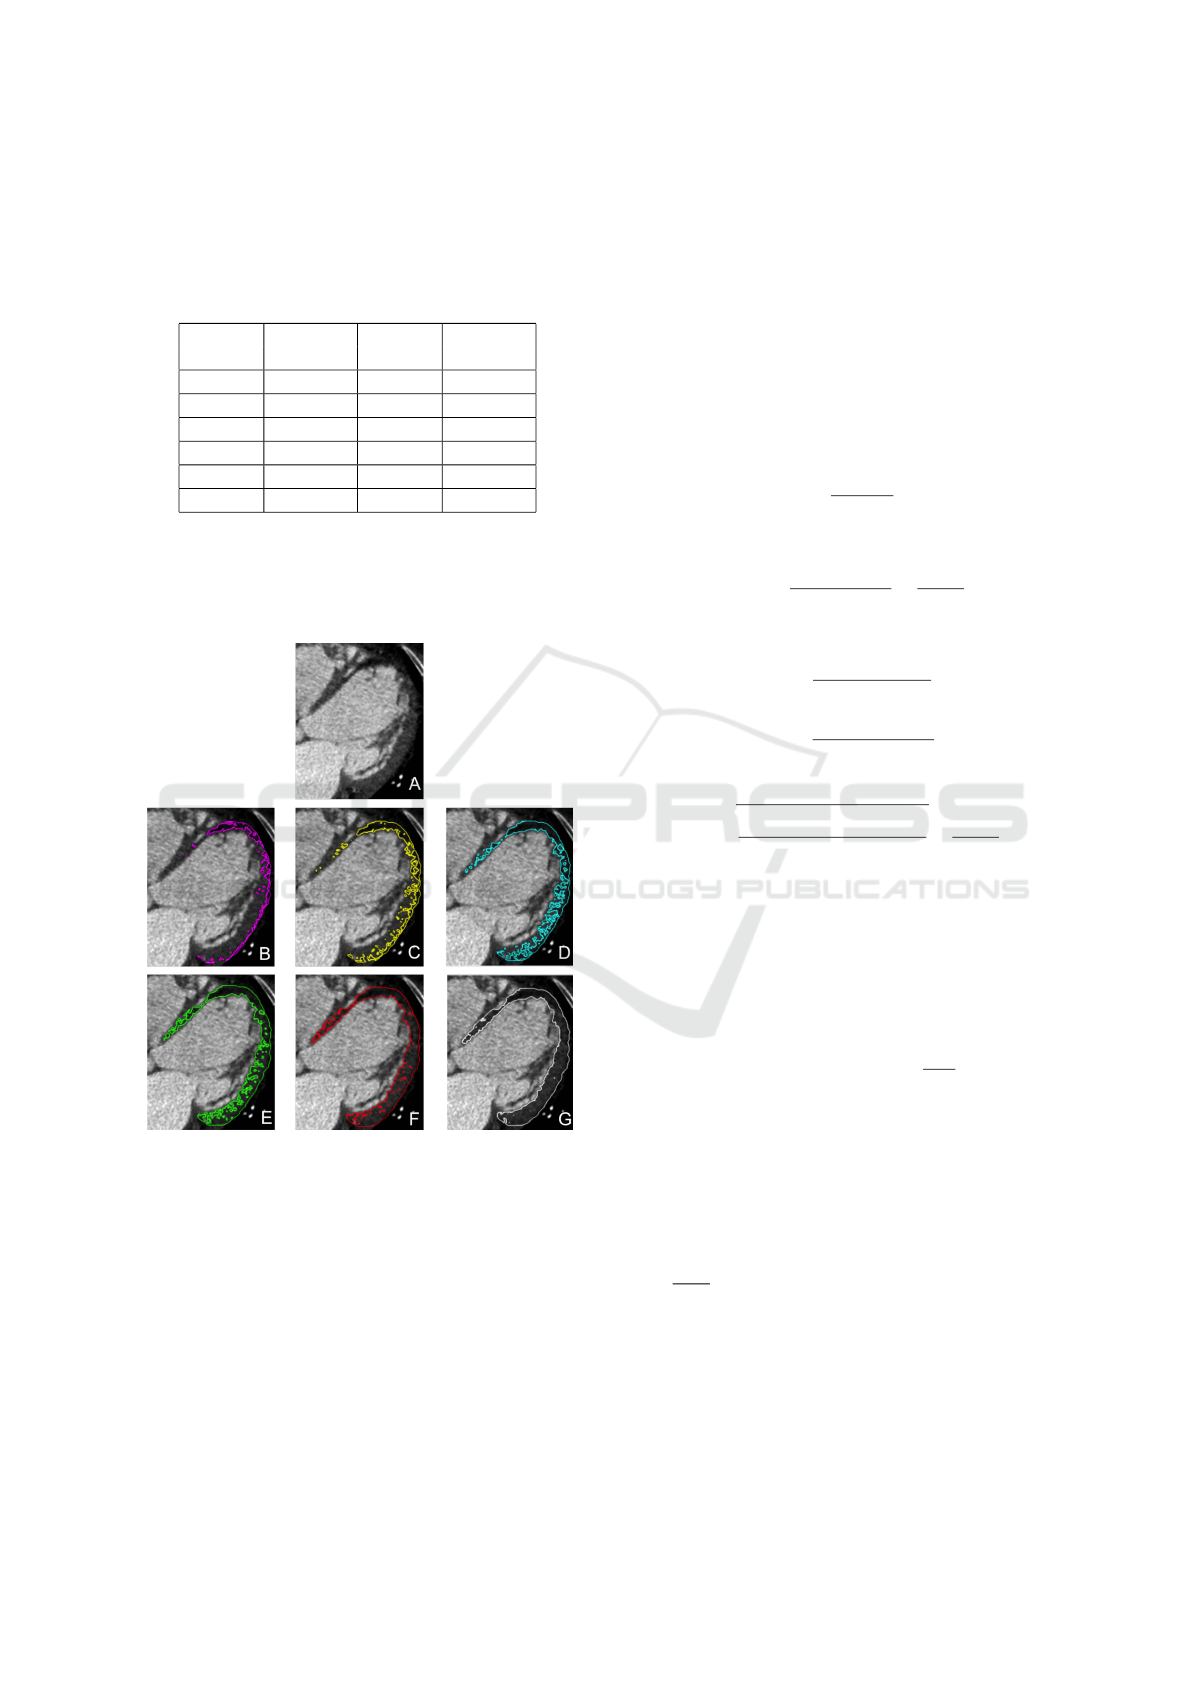
mentation. Examples of double-level isoline maps for
abnormal class sample are presented in Figure 6.
Figure 6: Double-level isoline map examples. A: Initial im-
age (myocardial infarction sample). B: 30 / 35 levels map.
C: 40 / 45 levels map. D: 50 / 55 levels map. E: 60 / 65
levels map. F: 70 / 75 levels map. G: 80 / 85 levels map.
2.2.3 Isoline Maps Features
During feature extraction step, five statistical charac-
teristics were calculated for each isoline map. Final
feature vector was constructed by concatenation of all
statistical values. Single-level and double-level iso-
line maps were considered as separate feature models.
As a results two isoline-based feature models were
achieved:
• single-level model: 31 × 5 = 155 features;
• double-level model: 11 × 5 = 55 features.
Consider a grayscale image I of contrast-enhanced
CT scan. Its corresponding LV myocardium area is
presented as a point set S
myo
: S
myo
= {(x, y)|I(x, y) ∈
LV }. Isoline map S
isoline
of LV myocardium area is
presented as a set of its isoline contours C, S
isoline
=
{C}, where each isoline contour is presented as a set
of its points: C = {(x, y)}. Statistical computation
was provided as follows:
• isoline count on the map:
N =
|S
isoline
|
|S
myo
|
; (1)
• mean isoline length:
L
mean
=
∑
C∈S
isoline
|C|
|S
isoline
|
×
1
|S
myo
|
; (2)
• min, max isoline length:
L
min
=
min
C∈S
isoline
|C|
|S
myo
|
; (3)
L
max
=
max
C∈S
isoline
|C|
|S
myo
|
; (4)
• standard deviation of isoline length:
L
std
=
s
∑
C∈S
isoline
(|C| − L
mean
)
2
|S
isoline
|
×
1
|S
myo
|
. (5)
All the values were normalized by the area of LV my-
ocardium region.
2.3 Classification
On the classification stage every CT scan slice image
is represented as a one-dimensional vector x of N fea-
tures:
x = {ξ
1
, ..., ξ
N
}, ξ
i
∈ R, i = 1, N. (6)
Binary classification algorithm a(x) is a function:
R
N
→ M, M = {+1, −1}. Class label +1 stands for
positive class, or abnormal, when disease was de-
tected. Class label -1 stands for a negative, normal
class, when disease was not found.
In this research classification algorithms based
on supervised machine learning approach were ap-
plied. In this case training dataset feature vectors
x
i
, i = 1, N
0
, with class labels y
i
are used in classifi-
cation algorithm a(x).
In this work SVM with nonlinear kernel and Ran-
dom Forest classifiers were applied. Both algorithms
are considered to be among the best classification
approaches and demonstrated high accuracy in wide
range of problems.

3 EXPERIMENTAL RESULTS
3.1 Dataset and Labeling
The dataset for training and evaluation of the pro-
posed algorithm consists of 11 contrast-enhanced CT
sequences of healthy patients and 8 contrast-enhanced
CT sequences with heart diseases in DICOM format.
Since pixel intensity on CT images is linearly depen-
dent on tissue density at the point, intensity values
themselves are used for further analysis. Certain CT
sequence slices presented as grayscale PNG images
of 512 × 512 size were manually selected from each
CT image sequence. Final dataset consists of 309
grayscale PNG images.
Myocardium tissue structural elements, cardiomy-
ocytes, have oblong shapes. Since cardiomyocytes
are co-directed with axial plane, CT axial slices are
analyzed in this research. On each image LV my-
ocardium was preliminarily segmented manually.
During experiments the whole dataset was divided
into: 1) parameter estimation dataset (5 normal, 4 ab-
normal CT sequences) and 2) evaluation dataset (the
rest 6 normal and 4 abnormal CT sequences). For
feature selection and classifier parameters estimation
k-fold cross-validation was used on the first dataset
where each separate CT sequence was considered as
fold. On each iteration of validation a pair CT se-
quences of both classes were considered as validation
set, and all the rest CT sequences (4 + 3 = 7 totally)
were used for training. For classification evaluation
the second dataset was considered. Several iterations
were made and mean False Negative Rate (FNR) and
mean F-score values were calculated. At each itera-
tion random 2 normal and 1 abnormal CT sequences
were used for training (about 30% from the whole
evaluation dataset), all the rest were used for testing
(4 + 3 = 7).
All algorithms were implemented in MATLAB.
Class weights were set to 3 for the positive class and 1
for the negative class. Random forest consisted of 100
CART trees (Breiman et al., 1984). For SVM classi-
fier, three nonlinear kernel functions were compared:
1. polynomial kernel:
K(x
1
, x
2
) = (< x
1
, x
2
> +1)
d
; (7)
2. radial basis function, (RBF):
K(x
1
, x
2
) = exp(−γ||x
1
− x
2
||
2
), γ > 0; (8)
3. sigmoid:
K(x
1
, x
2
) = tanh(k < x
1
, x
2
> +c), k > 0, c > 0.
(9)
The cost of constraints violation, was set to 80. For
polynomial kernel, d from (7) was set to 3. For RBF
kernel, γ from (8) was set to
1
N
, where N is feature
space dimension. For sigmoid kernel (9), k = 0.01
and c ∈ [−0.5, −2] were used.
3.2 Histogram-based Feature Model
For comparison with the proposed method based on
isoline map, seven histogram-based characteristics
utilized in (Antunes et al., 2016) were calculated:
• energy
E =
N
∑
k=1
I(k)
2
; (10)
• mean
I =
1
N
N
∑
k=1
I(k); (11)
• intensity distribution median I;
• entropy
T =
90
∑
k=30
H(k)log
2
H(k); (12)
• kurtosis
K =
1
N
∑
N
k=1
(I(k) − I)
4
(
q
1
N
∑
N
k=1
(I(k) − I)
2
)
2
; (13)
• root mean square error
RMSE =
s
∑
N
k=1
I(k)
2
N
; (14)
• skewness
S =
1
N
∑
N
k=1
(I(k) − I)
3
(
q
1
N
∑
N
k=1
(I(k) − I)
2
)
3
, (15)
where I(k) is an intensity value of image I of size N at
the point k, H(k) is normalized histogram value at the
k-th bin, k ∈ [30, 90].
Totally, 68 histogram-based features were ob-
tained:
• 61 values of normalized histogram;
• 7 intensity-based statistics from feature selection
step of (Antunes et al., 2016).
3.3 Feature Selection
Two techniques based on analysis of each feature im-
pact on recall were used in this work in order to select
the best features.
3.3.1 Information Gain
Information gain (Hall, 1999) magnitude, IG, is re-
lated to information entropy and characterizes the cor-
relation between the feature and recall compared to
recall values correlation that are evaluated using en-
tropy. The bigger IG value was achieved, the higher
correlation is. In this work normalized [0, 1] IG
range was considered and features with IG ≥ 0.65
were selected. The selected features are presented in
Table 2.
Table 2: Isoline map-based features selected by IG ≥ 0.65
criteria.
Feature Single-level Double-level
type map levels map levels
30/35,
L
Mean
[30, 46], 54, 60 35/40, 40/45,
50/55
L
Min
[30, 36] 30/35
30/35, 35/40,
L
σ
[30, 38], [48, 62] 40/45, 45/50, 50/55,
55/60, 60/65
3.3.2 Chi-squared Test
Chi-squared test (Greenwood and Nikulin, 1996) is
one of the most commonly used statistical hypothe-
sis testing methods. Features selected by chi-squared
test with 0.05 significance level for isoline map-based
models are presented in Table 3.
Table 3: Isoline map-based features selected by chi-squared
test with 0.05 significance level.
Feature Single-level Double-level
type isoline levels isoline levels
30/35, 35/40,
L
Mean
[30, 62] 40/45, 45/50, 50/55,
55/60, 60/65
30/35,
L
Min
[30, 44] 35/40, 40/45,
45/50
L
Max
[42, 50], 58 –
40/45, 45/50,
L
σ
30, 32, [44, 70] 50/55, 55/60,
60/65, 65/70
3.4 Evaluation
For quality evaluation purposes F-score and FNR
were analyzed. Final classification results are pre-
sented in Table 4 and Table 5.
The following feature models were compared in
this research:
• model 1: single-level isoline maps features;
• model 2: single-level isoline maps features se-
lected by Information Gain;
• model 3: single-level isoline maps features se-
lected by Chi-squared test;
• model 4: double-level isoline maps features;
• model 5: double-level isoline maps features se-
lected by Information Gain;
• model 6: double-level isoline maps features se-
lected by Chi-squared test;
• model 7: histogram-based features.
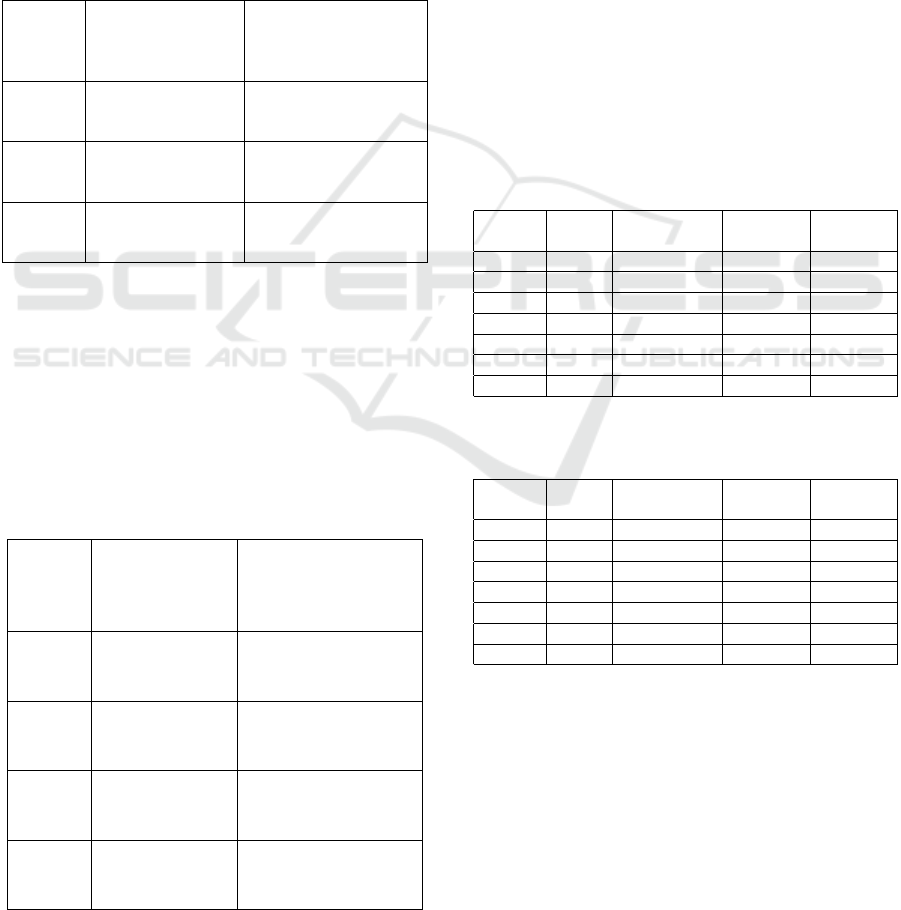
Table 4: FNR comparison. The best result is highlighted in
bold.
Model SVM SVM SVM Random
RBF Polynomial Sigmoid Forest
1 0.054 0.054 0.023 0.050
2 0.034 0.034 0.017 0.021
3 0.027 0.028 0.021 0.015
4 0.063 0.056 0.025 0.051
5 0.014 0.010 0.007 0.017
6 0.011 0.011 0.010 0.016
7 0.100 0.103 0.028 0.095
Table 5: F-scores comparison. The best result is highlighted
in bold.
Model SVM SVM SVM Random
RBF Polynomial Sigmoid Forest
1 0.930 0.929 0.910 0.935
2 0.950 0.950 0.947 0.961
3 0.958 0.957 0.953 0.959
4 0.926 0.929 0.912 0.930
5 0.962 0.963 0.955 0.961
6 0.967 0.966 0.958 0.952
7 0.864 0.861 0.882 0.879
It can be seen from Tables 4 and 5 that both single-
level and double-level isoline map models demon-
strated consistent FNR and F-score values improve-
ment over histogram-based feature representation
from (Antunes et al., 2016) (up to 10% for FNR and
up to 11% for F-score). Optimal features selection us-
ing chi-squared test and IG criteria allows to achieve
2-4 % improvement for both FNR and F-score. All
classification algorithms demonstrated slightly differ-
ent and good results. The best FNR score (0.7%)

was achieved by double-level isoline map-based IG
features and SVM with sigmoid kernel. The best F-
score (96.7%) was achieved by double-level isoline
map-based chi-squared features and SVM with RBF
kernel.
4 CONCLUSIONS
In this paper a new automated heart disease diagnos-
tics approach based on supervised machine learning
with LV myocardium feature representation utilizing
isoline map statistics was presented. Experiments
provided in this paper demonstrate both intuitiveness
of presented feature model and its usability for the
considered task.
The scope of constructed feature model applica-
tion is not limited to contrast-enhanced CT images
analysis and medical imaging purposes. The pro-
posed approach can be also utilized in other texture
analysis or fixed intensity range blobs detection tasks.
For more applicability and fully automated anal-
ysis, automated LV myocardium segmentation algo-
rithm for contrast-enhanced CT images is being de-
veloped. Further evaluation of the proposed auto-
mated diagnostics algorithm on larger datasets is war-
ranted.
ACKNOWLEDGEMENTS
The work was supported by the Grant of President
of Russian Federation for young scientists No. MK-
1896.2017.9 (contract No. 14.W01.17.1896-MK).
REFERENCES
Afshin, M., Ben Ayed, I., Punithakumar, K., Law, M., Is-
lam, A., Goela, A., Ross, I., Peters, T., and Li, S.
(2011). Assessment of regional myocardial function
via statistical features in MR images. Medical Im-
age Computing and Computer-Assisted Intervention–
MICCAI 2011, pages 107–114.
Antunes, S., Esposito, A., Palmisanov, A., Colantoni, C.,
de Cobelli, F., and Del Maschio, A. (2016). Char-
acterization of normal and scarred myocardium based
on texture analysis of cardiac computed tomography
images. In Engineering in Medicine and Biology So-
ciety (EMBC), 2016 IEEE 38th Annual International
Conference of the, pages 4161–4164. IEEE.
Boser, B. E., Guyon, I. M., and Vapnik, V. N. (1992). A
training algorithm for optimal margin classifiers. In
Proceedings of the fifth annual workshop on Compu-
tational learning theory, pages 144–152. ACM.
Breiman, L. (2001). Random forests. Machine learning,
45(1):5–32.
Breiman, L., Friedman, J., Olshen, R., and Stone, C. (1984).
Classification and Regression Trees. Wadsworth &
brooks/cole advanced books & software. Pacific Cal-
ifornia.
Cerqueira, M. D., Weissman, N. J., Dilsizian, V., Jacobs,
A. K., Kaul, S., Laskey, W. K., Pennell, D. J., Rum-
berger, J. A., Ryan, T., Verani, M. S., et al. (2002).
Standardized myocardial segmentation and nomencla-
ture for tomographic imaging of the heart. Circula-
tion, 105(4):539–542.
Greenwood, P. E. and Nikulin, M. S. (1996). A guide to
chi-squared testing, volume 280. John Wiley & Sons.
Hall, M. A. (1999). Correlation-based feature selection for
machine learning. University of Waikato Hamilton.
Nichols, M., Townsend, N., Scarborough, P., and Rayner,
M. (2014). Cardiovascular disease in Europe 2014:
epidemiological update. European Heart Journal,
35(42):2950–2959.
Senyukova, O. V. (2014). Segmentation of blurred objects
by classification of isolabel contours. Pattern Recog-
nition, 47(12):3881–3889.
Wang, Z., Salah, M. B., Gu, B., Islam, A., Goela, A., and
Li, S. (2014). Direct estimation of cardiac biven-
tricular volumes with an adapted Bayesian formula-
tion. IEEE Transactions on Biomedical Engineering,
61(4):1251–1260.
Wong, K., Tee, M., Chen, M., Bluemke, D. A., Summers,
R. M., and Yao, J. (2016). Regional infarction iden-
tification from cardiac CT images: a computer-aided
biomechanical approach. Int J Comput Assist Radiol
Surg, 11(9):1573–1583.
Wong, K. C., Tee, M., Chen, M., Bluemke, D. A., Summers,
R. M., and Yao, J. (2015). Computer-aided infarction
identification from cardiac CT images: a biomechan-
ical approach with SVM. In 18th International Con-
ference on Medical Image Computing and Computer-
Assisted Intervention, MICCAI 2015, pages 144–151.
Springer Verlag.
Xu, C., Xu, L., Gao, Z., Zhang, H., Zhang, Y., Du, X., Zhao,
S., Ghista, D., Li, S., et al. (2017). Direct detection
of pixel-level myocardial infarction areas via a deep-
learning algorithm. arXiv preprint arXiv:1706.03182.
