
Real-Time Barcode Detection and Classification using Deep Learning
Daniel Kold Hansen, Kamal Nasrollahi, Christoffer B. Rasmusen and Thomas B. Moeslund
Aalborg University, Rendsburggade 14, 9000 Aalborg, Denmark
Keywords:
Deep Learning, Barcode detection, Barcode Rotation.
Abstract:
Barcodes, in their different forms, can be found on almost any packages available in the market. Detecting
and then decoding of barcodes have therefore great applications. We describe how to adapt the state-of-the-
art deep learning-based detector of You Only Look Once (YOLO) for the purpose of detecting barcodes in a
fast and reliable way. The detector is capable of detecting both 1D and QR barcodes. The detector achieves
state-of-the-art results on the benchmark dataset of Muenster BarcodeDB with a detection rate of 0.991. The
developed system can also find the rotation of both the 1D and QR barcodes, which gives the opportunity of
rotating the detection accordingly which is shown to benefit the decoding process in a positive way. Both the
detection and the rotation prediction shows real-time performance.
1 INTRODUCTION
Barcodes are an integrated part of the world today and
are used in many different contexts ranging from the
local supermarket to the use in advertising. Barcodes
can be split into two different main categories, 1D and
2D barcodes. The best known 1D barcode types are
probably the EAN an UPC type which is mainly used
for labelling consumer products at the local supermar-
ket. A very known and popular 2D barcode is the QR
barcode. The QR barcode is for example used in mar-
keting where it acts as a link between the printed and
digital media, by redirecting people to additional in-
formation, competitions, social media sites, etc. To
decode barcodes, several solutions exist ranging from
laser scanners to camera based devices. Traditional
solutions such as the laser scanner do not provide the
opportunity of decoding 2D barcodes, to do that cam-
era based scanners are needed. A popular camera
based scanner is the smartphone which allows the user
to scan virtually any type of barcode. The smartphone
does, however, requires a certain amount of guidance
from the user, and are usually only capable of decod-
ing one barcode at the time. To optimise this process,
it could be desirable to locate barcodes in an image
and thereby be able to decode multiple barcodes at
the time and require less guidance from a user.
2 RELATED WORK
There have been proposed a lot of different solu-
tions to various problems regarding locating barcodes
throughout the years. One of the first papers trying to
locate barcodes is Mu
˜
niz et al.(Muniz et al., 1999),
where an application to process Spanish medicine
prescription automatically is developed. This is a
very early example of locating barcodes, but as the
technology has expanded through the years, more and
more opportunities have arisen.
The introduction of mobile phones with cameras
has inspired several papers with algorithms trying to
find barcodes using the camera of a mobile phone.
Ohbuchi et al.(Ohbuchi et al., 2004) from 2004 im-
plements a mobile application able to locate both QR
and EAN-codes by corner detection and spiral search,
and rectifies the barcode in the end as well. In 2008
Wachenfeld et al.(Wachenfeld et al., 2008) propose a
method for recognition of 1D barcodes where decod-
ing is used as a tool for finding the barcode. Both
Ohbuchi and Wachenfeld rely very much on the user
pointing the camera at the barcode and thereby using
the phone very much like a laser scanner.
In more recent papers there is more focus on mak-
ing algorithms for barcode detection that rely as little
as possible on the user centring and aligning the cam-
era with the barcode. There are several approaches to
the problem, some are relying on simple morphology
operation like(Katona and Ny
´
ul, 2013) and the im-
proved version(Katona and Ny
´
ul, 2012) by Katona et
Hansen D., Nasrollahi K., B. Rasmusen C. and Moeslund T.
Real-Time Barcode Detection and Classification using Deep Learning.
DOI: 10.5220/0006508203210327
In Proceedings of the 9th International Joint Conference on Computational Intelligence (IJCCI 2017), pages 321-327
ISBN: 978-989-758-274-5
Copyright
c
2017 by SCITEPRESS – Science and Technology Publications, Lda. All rights reserved
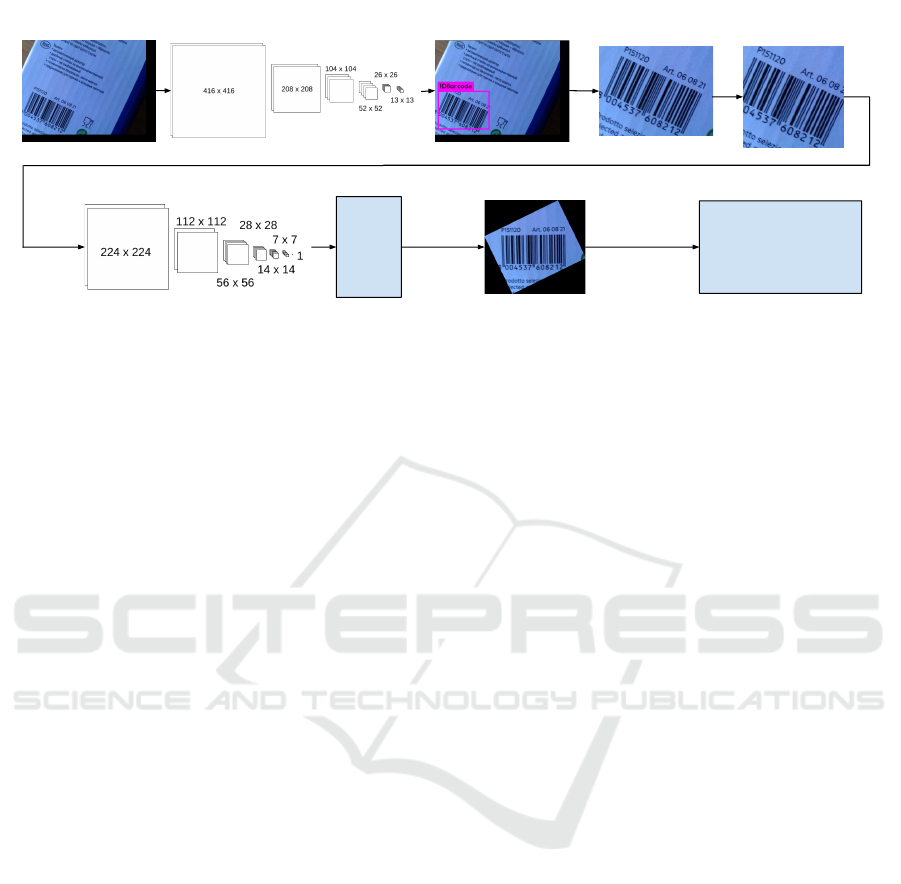
Input
YOLO (Redmon and Farhadi, 2016)
Detection
Detection cropped to
square
Angle Prediction
(Darknet19)
65
8004537608212
Decoding
Rotation
Figure 1: Overview of our system.
al. The enhanced version adds a Euclidean distance
map which makes it possible to remove objects far
away from other objects. These papers are one of the
only ones regarding barcode localisation which try to
embrace a wide palette of different barcodes both 1D
and 2D. The data used for testing in the paper con-
sisted of 17,280 synthetic images and a set of 100
real-life images with only 1D barcodes. The data is
not however publicly available, and the authors have
not tested their algorithm on any benchmark datasets.
However, S
¨
or
¨
os et al.(S
¨
or
¨
os and Fl
¨
orkemeier, 2013)
evaluate the performance of Katona plus their own al-
gorithm, Gallo et al.(Gallo and Manduchi, 2011) and
Tekin et al.(Tekin and Coughlan, 2012), on 1000 1D
images from the WWU Muenster Barcode Database
(Muenster BarcodeDB). This test shows a low score
by Katona and reveals that even though Katona re-
ports high accuracy on their own data, it might not be
that robust. Gallo uses the derivatives of the images
combined with a block filter to find regions with a
high difference between the x and y derivatives. Tekin
also uses the derivatives and then calculates the ori-
entation histograms to find patches with a dominant
direction. The S
¨
or
¨
os algorithm uses the image deriva-
tives to create an edge and a corner map, and then
uses the philosophy that 1D barcodes mainly consist
of edges, 2D barcodes primarily consist of corners
and text consist of both edges and corners. In (S
¨
or
¨
os,
2014) the S
¨
or
¨
os algorithm is implemented on a mo-
bile GPU, furthermore RGB information is used to
remove areas of which contains colours.
The paper Creusot et al.(Creusot and Munawar,
2015) from 2015 is a state of the art method regarding
1D barcode detection. The paper is using the Muen-
ster BarcodeDB and the extended Arte-Lab database
introduced by Zamberletti2013 et al.(Zamberletti
et al., 2013) which extends the original Arte-Lab
dataset from Zamberletti et al.(Zamberletti et al.,
2010), to test the performance. Based on their test
Creusot outperforms Zamberletti2013 on both the
Arte-Lab and the Muenster BarcodeDB, and compar-
ing the result with the results achieved by S
¨
or
¨
os, it
seems that Creusot outperforms it, even though it can
be hard to compare because the subsets chosen for
testing are not identical. Creusot uses Maximal Sta-
ble Extremal to detect the dark bars of the barcodes
followed by Hough transform to find the perpendicu-
lar line of the bar going through its centre. In 2016
the authors followed up with a new paper(Creusot
and Munawar, 2016) improving their previous results
by using a method they call Parallel Segment Detec-
tor (PSD) which is based on Line Segment Detector
(LSD). After the PSD, barcode cropping is performed
by the use of 5 scan lines looking at the rapid change
in intensity across the barcode.
In the field of localising 2D barcodes, it is mainly
QR codes which have received focus. Beside from
already mentioned papers able to localise 2D bar-
codes, Szentandr
´
asi et al.(Szentandr
´
asi et al., 2013)
and Belussi et al.(Belussi and Hirata, 2016) are two
other interesting papers. Szentandr
´
asi splits the im-
age into tiles, and the Histogram of Oriented Gradi-
ents (HOG) is then found for each tile which is used
for segmentation and classification. Belussi is using
Viola-Jones to locate the finder patterns of the QR
code. The finder pattern candidates are then evaluated
in a post-processing step which frames the whole QR-
code. Both Szentandrasi and Belussi focus on finding
QR codes, but they test their algorithms only on their
own data.
3 OUR APPROACH
Deep learning has been very successful in various ar-
eas outperforming other methods. In the field of bar-
180
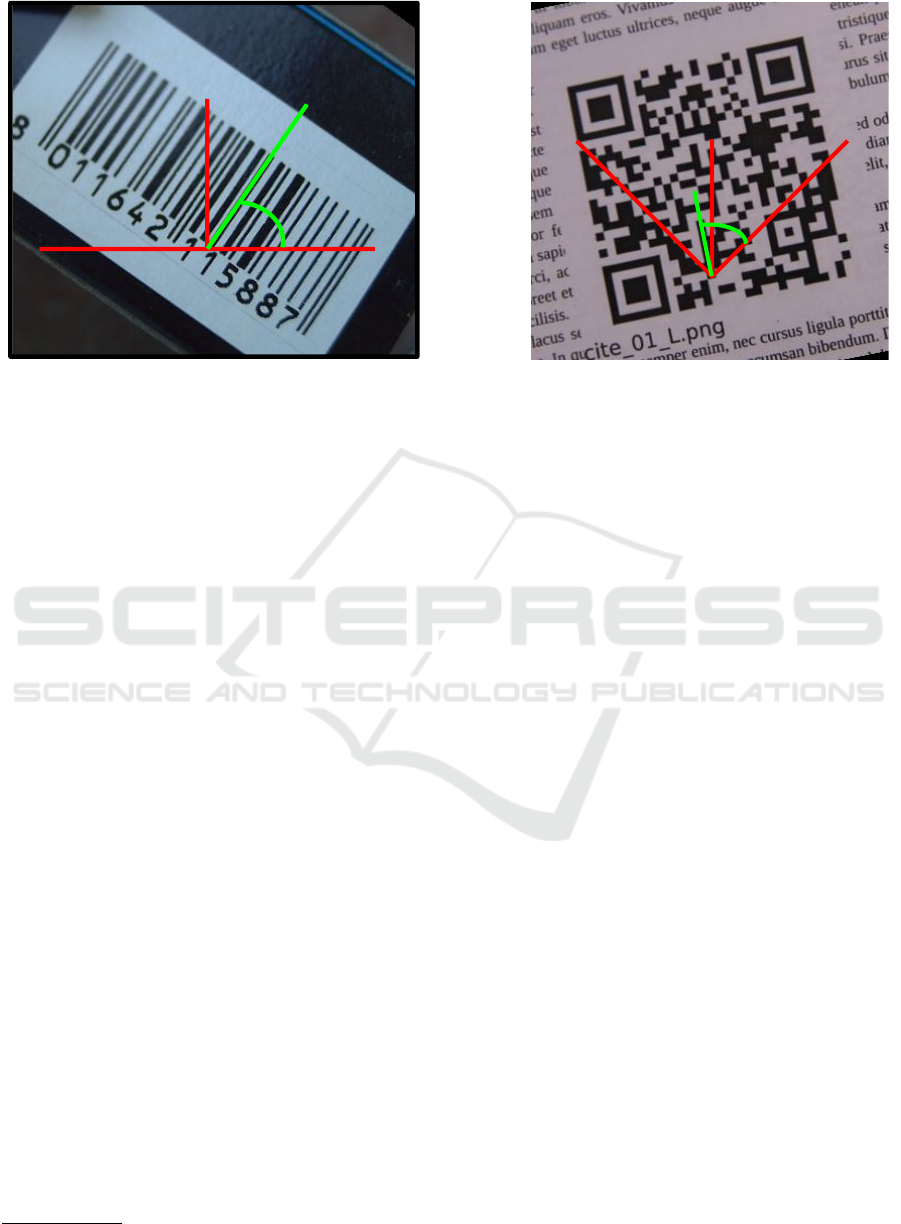
0
Angle
90
45
90
135
Angle
Figure 2: Examples of measuring angle.
code localisation, the only barcode detector solution
known to the author, using deep learning is Zamber-
letti2013, where it is used to analyse a Hough Space
to find potential bars. We would like to investigate
whether the use of deep learning can benefit the lo-
cating of barcodes and achieve state of the art results.
We will use the deep learning object detection algo-
rithm You Only Look Once (YOLO) (Redmon and
Farhadi, 2016) for locating the barcodes. We will try
to train the network to be able to detect 1D barcodes
(UPC and EAN) and the QR barcodes. We will use
the YOLO network based on Darknet19 with the in-
put size of 416x416.
The next natural step after locating a barcode
would be to decode it. Through some small scale test,
we found out that rotating the 1D barcodes such that
the bars are vertical and rotating QR barcodes so that
the sides of the small squares align with the x and y-
axis can benefit the performance of the decoding. For
1D barcodes, there is a speedup in time and a higher
decoding rate, whereas for the QR barcodes the de-
coding will take longer, but the decoding success rate
is higher. To find the amount of rotation needed a re-
gression network is used to predict a rotation value
between 0 and 1. The value will be mapped to an
angle going from 0 to 180 for 1D and 45 and 135 for
QR barcodes. At fig. 2 the method on how the angle is
measured is shown. The regression network is based
on the Darknet19 classification network
1
where the
softmax layer is removed, and the number of filters
in the last convolutional layer is set to one. Further-
more, three different activation functions are tried in
the last convolutional as well, Leaky ReLU, Logistic
and ReLU.
1
https://pjreddie.com/darknet/imagenet/
The block diagram of the proposed system is
shown in fig. 1. The system first receives an input
image, and then it is fed through the YOLO detec-
tion system which produces a number of detections
depending on the number of barcodes in the image.
Each of these barcodes is then put through the An-
gle prediction network which predicts a rotation and
the predicted rotation is then used to rotate the image
before it is tried decoded by a decoding framework.
The Darknet19 network structure which is used both
by the YOLO detection and the angle prediction is
shown at table 3.
For testing and training the same computer has
been used with an Intel Core i5-6600 3.30 GHz pro-
cessor, 16 GB DDR4 memory, 500 GB SSD hard
drive and Nvidia GeForce GTX 1080 with Ubuntu
16.04.2 LTS as the operating system.
4 LOCATING BARCODES
4.1 1D Barcodes
In the training of 1D Barcodes the Arte-Lab (Zamber-
letti et al., 2013) dataset was used using the split into
train and test as provided by the dataset. The YOLO
network was modified to only find one class, 1D bar-
codes.
4.1.1 Test
The trained network is tested on the Arte-Lab
database and the Muenster BarcodeDB with ground
truth from (Zamberletti et al., 2013). The epoch num-
ber 6000 is chosen for testing and it is compared to

Table 1: Test results on the Arte-Lab dataset.
Accuracy J
avg
Detection Rate D
0.5
Zamberletti(Zamberletti et al., 2013) 0.695 0.805
Creusot15(Creusot and Munawar, 2015) 0.763 0.893
Creusot16(Creusot and Munawar, 2016) - 0.989
Trained 6000 epochs (Test) 0.815 0.942
Trained 6000 epochs (Test + Train) 0.816 0.926
Trained 6000 epcohs BB (Test) 0.938 1.0
Trained 6000 epochs BB (Test + Train) 0.948 1.0
Table 2: Test results on the Muenster BarcodeDB.
Accuracy J
avg
Detection Rate D
0.5
Zamberletti(Zamberletti et al., 2013) 0.682 0.829
Creusot15(Creusot and Munawar, 2015) 0.829 0.963
Creusot16(Creusot and Munawar, 2016) - 0.982
Trained 6000 epochs 0.873 0.991
Trained 6000 epochs BB 0.903 0.996
Table 3: Darknet19 network.
Type Filters Size Stride
Convolution 32 3x3 1
Max pooling 2x2 2
Convolution 64 3x3 1
Max pooling 2x2 2
Convolution 128 3x3 1
Convolution 64 1x1 1
Convolution 128 3x3 1
Max pooling 2x2 2
Convolution 256 3x3 1
Convolution 128 1x1 1
Convolution 256 3x3 1
Max pooling 2x2 2
Convolution 512 3x3 1
Convolution 256 1x1 1
Convolution 512 3x3 1
Convolution 256 1x1 1
Convolution 512 3x3 1
Max pooling 2x2 2
Convolution 1024 3x3 1
Convolution 512 1x1 1
Convolution 1024 3x3 1
Convolution 512 1x1 1
Convolution 1024 3x3 1
(Zamberletti et al., 2013), (Creusot and Munawar,
2015) and (Creusot and Munawar, 2016). Figure 3
shows a plot of comparing results, on the Arte-Lab
dataset. As seen the trained network have a decrease
in the detection rate after the threshold of 0.5, and fur-
thermore it does not outperform Creusot16. This is
because of how the network detects the barcodes and
how the ground truth is labelled, which means that
when a barcode is rotated the bounding box needed
to frame it will cover a larger area than the barcode
itself which leads to a decrease in accuracy. To il-
lustrate that this is the problem and not because the
detector is unable to locate the barcode, the detection
rate with the ground truth being in the same format as
the detections is also plotted and is denoted with BB.
The results is summarized in table 1. The network has
also been tested on the Muenster BarcodeDB using a
subset of 595 images as done in (Creusot and Mu-
nawar, 2016), and the results can be seen in table 2.
4.2 QR Barcodes
For the QR barcodes the QR database provided
by (S
¨
or
¨
os and Fl
¨
orkemeier, 2013) and the Dubesk
´
a
dataset (Dubsk
´
a et al., 2016) are used for training.
Both dataset where randomly split in half for train
and test. Furthermore the same training data used for
the 1D barcodes are used as well, which means that
the detector is trained to find both 1D and QR bar-
codes. The network is compared to the (S
¨
or
¨
os and
Fl
¨
orkemeier, 2013) with the same testing conditions
as S
¨
or
¨
os describes.
4.2.1 Test
Table 4 shows the test result for the trained network
able to detect both 1D and QR barcodes. It can be
seen that the network outperforms S
¨
or
¨
os on both the
their own dataset and the Dubesk
´
a dataset. The results
with bounding boxes also shows that the network is
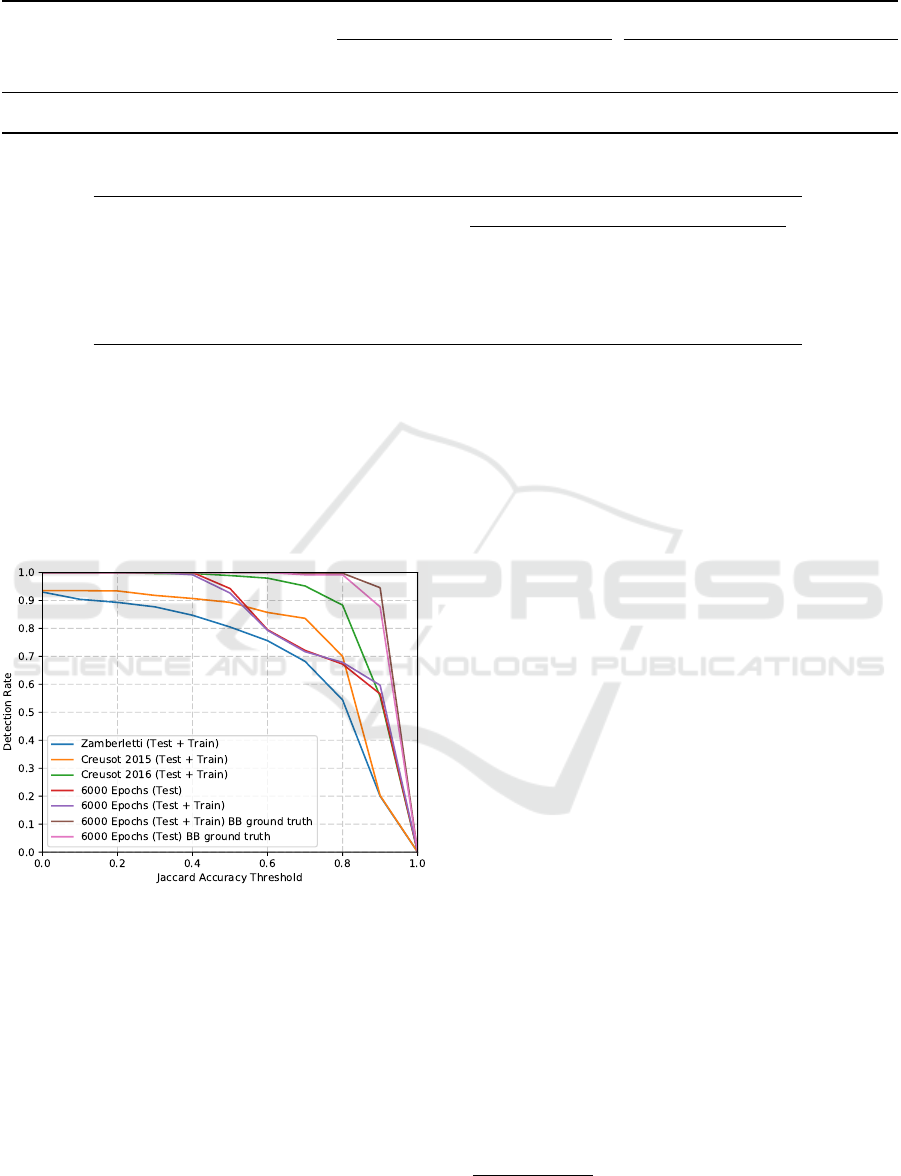
Table 4: Test results comparison.
Detection Rate D
0.5
Accuracy J
avg
All Arte-Lab S
¨
or
¨
os Dubesk
´
a All Arte-Lab S
¨
or
¨
os Dubesk
´
a
Gabor S
¨
or
¨
os algorithm (S
¨
or
¨
os and Fl
¨
orkemeier, 2013) - - 0.810 0.426 - - - -
Trained 8000 epochs (test) 0.914 0.926 0.967 0.890 0.759 0.810 0.788 0.719
Trained 8000 epochs (test + train) - - 0.958 0.888 - - 0.820 0.727
Trained 8000 epochs (test) BB 1.0 1.0 1.0 1.0 0.946 0.937 0.945 0.953
Trained 8000 epochs (test + train) BB - - 1.0 1.0 - - 0.948 0.954
Table 5: Table showing the different execution times. The trained network was executed on GPU.
Execution time (ms) Resolution
Gabor S
¨
or
¨
os (S
¨
or
¨
os and Fl
¨
orkemeier, 2013) 73 960x720
Creusot16 (Creusot and Munawar, 2016) 40 640x480
Creusot16 (Creusot and Munawar, 2016) 116 960x1080
Trained Network 13.6 640x480
Trained Network 13.8 2448x2048
able to find all the barcodes in the two QR datasets
which has also been confirmed by a visual inspection.
Looking at the results for the 1D barcode dataset Arte-
Lab, a decrease in accuracy of 1.6 percentage point is
seen, but with bounding boxes the detection rate is
still at 100 %.
Figure 3: Test results on the Arte-Lab dataset.
4.3 Execution Time
The network performed at real time speeds, execut-
ing faster than the algorithms compared with. The
table 5 shows the execution time for the network fed
with an image of the noted resolution. It also contains
the execution time of Creusot16 and S
¨
or
¨
os they have
reported.
5 BARCODE ROTATION
5.1 1D Barcodes
To train and test the rotation prediction of on 1D
barcodes, the detections produced from the Arte-Lab
dataset is used. Furthermore, the data set are ex-
panded by rotating each detection ten times by a ran-
dom angle. This gives in total 3944 images avail-
able, which is split in half into test and train in such
a way that the original detection plus the extra rota-
tions are not separated. The input of the network is
of square format, so all the images are cropped to
squares to avoid that the network re-size them and
thereby changing the angle. The ground truth angle
for each image has been hand labelled.
5.1.1 Test
To test how much the decoding can benefit from ro-
tation the barcodes, the c++ implementations of ZX-
ing
2
and ZBAr
3
has been used for decoding. The test
is done by trying to decode the test part consisting of
1973 images, without rotation, with ground truth ro-
tation and with predicted rotations. The results are
shown at table 6 and shows an increase in the decod-
ing success with both ZXing and ZBar. It also shows
a speedup in the decoding time for the ZXing. The
time uses for predicting the angle is 3.72 ms, and the
rotation takes in average 0.59 ms.
2
https://zxing.org/w/decode.jspx
3
http://zbar.sourceforge.net/

Table 6: Table showing the decode results for the decoders ZXing and ZBar. 1973 barcodes where tried decoded.
ZXing ZBar
Successfully decoded Time / barcode (ms) Success rate Successfully decoded Time / barcode (ms) Success rate
No rotation 680 7.86 0.345 1420 3.59 0.720
Ground truth rotation 1717 1.36 0.870 1727 4.52 0.875
Leaky ReLU Pre epoch 7000 rotation 1691 1.54 0.857 1703 4.61 0.863
Logistic Pre epoch 10000 rotation 1705 1.43 0.864 1715 4.54 0.869
ReLU Pre epoch 7000 rotation 1695 1.52 0.859 1710 4.52 0.867
Table 7: Table showing the decode results for the decoder ZXing. 2757 barcodes where tried decoded.
ZXing
Successfully decoded Time / barcode (ms) Success rate
No rotation 1693 1.09 0.614
Ground truth rotation 2208 1.57 0.801
Leaky ReLU Pre epoch 10000 rotation 2194 1.57 0.796
Logistic Pre epoch 10000 rotation 2211 1.51 0.802
ReLU Pre epoch 10000 rotation 2224 1.49 0.807
5.2 QR Barcodes
The training and testing of the QR barcodes were per-
formed using the detections obtained from the S
¨
or
¨
os
QR barcode database and the Dubesk
´
a dataset. The
same procedure regarding the extra rotations as de-
scribed for the 1D barcodes were used for QR bar-
codes as well. This produced 5515 QR barcode de-
tections in total. The ground truth angles were hand
labelled for each image.
5.2.1 Test
For the testing of the QR barcodes only the ZXing de-
coder where used because the ZBar decoder gave in-
contestable results when decoding QR barcodes. The
results can be seen at table 7 and shows that decoding
the rotated images takes longer to decode but gives a
higher success rate.
6 CONCLUSION
We showed how to use deep learning for the purpose
of detecting barcodes in an image. The detector has
shown to be robust with state of the results on the
Muenster BarodeDB. Furthermore, it has been shown
that we can detect both 1D and QR barcodes with the
same network and additional barcode types can easily
be added. Besides training a network for barcode de-
tection, a network able to predict the angle of rotation
of barcodes. The network for predicting the angle is a
regression network based upon the Darknet19 archi-
tecture, which was trained and tested for both 1D and
QR barcodes. The test of how the angle prediction can
benefit the decoding of the barcodes showed that the
predictions gave a raise in the decoding success rate
for all the tests. Furthermore, the ZXing 1D barcode
decoding gave a speedup in the decoding time.
ACKNOWLEDGEMENTS
We would like to thank HSA Systems for their sup-
port of the project and for putting hardware at dis-
posal. We will especially like to thank the Aalborg
department and the head of that department, Thomas
Heder.
REFERENCES
Belussi, L. F. F. and Hirata, N. S. T. (2016). Fast QR
Code Detection in Arbitrarily Acquired Images Fast
QR Code Detection in Arbitrarily Acquired Images.
In Graphics, Patterns and Images (Sibgrapi), 2011
24th SIBGRAPI Conference on, number September,
pages 281–288.
Creusot, C. and Munawar, A. (2015). Real-time barcode
detection in the wild. In Applications of Computer Vi-
sion (WACV), 2015 IEEE Winter Conference on, pages
239–245.
Creusot, C. and Munawar, A. (2016). Low-Computation
Egocentric Barcode Detector for the Blind. In Image
Processing (ICIP), 2016 IEEE International Confer-
ence on, pages 2856–2860.
Dubsk
´
a, M., Herout, A., and Havel, J. (2016). Real-time
precise detection of regular grids and matrix codes.
Journal of Real-Time Image Processing, 11(1):193–
200.
Gallo, O. and Manduchi, R. (2011). Reading 1D bar-
codes with mobile phones using deformable tem-
plates. IEEE Transactions on Pattern Analysis and
Machine Intelligence, 33(9):1834–1843.

Katona, M. and Ny
´
ul, L. G. (2012). A novel method for
accurate and efficient barcode detection with morpho-
logical operations. In Signal Image Technology and
Internet Based Systems (SITIS), 2012 Eighth Interna-
tional Conference on, pages 307–314.
Katona, M. and Ny
´
ul, L. G. (2013). Efficient 1D and 2D
barcode detection using mathematical morphology. In
International Symposium on Mathematical Morphol-
ogy and Its Applications to Signal and Image Process-
ing, pages 464–475.
Muniz, R., Junco, L., and Otero, A. (1999). A robust soft-
ware barcode reader using the Hough transform. In
Information Intelligence and Systems, 1999. Proceed-
ings. 1999 International Conference on, pages 313–
319.
Ohbuchi, E., Hanaizumi, H., and Hock, L. A. (2004). Bar-
code Readers using the Camera Device in Mobile
Phones. In Cyberworlds, 2004 International Confer-
ence on, pages 260–265.
Redmon, J. and Farhadi, A. (2016). YOLO9000: Better,
Faster, Stronger. arXiv preprint arXiv:1612.08242v1.
S
¨
or
¨
os, G. (2014). GPU-Accelerated Joint 1D and 2D Bar-
code Localization on Smartphones. In Acoustics,
Speech and Signal Processing (ICASSP), 2014 IEEE
International Conference on, pages 5059–5099.
S
¨
or
¨
os, G. and Fl
¨
orkemeier, C. (2013). Blur-resistant joint
1D and 2D barcode localization for smartphones. In
Proceedings of the 12th International Conference on
Mobile and Ubiquitous Multimedia, page 11.
Szentandr
´
asi, I., Herout, A., and Dubsk
´
a, M. (2013). Fast
Detection and Recognition of QR codes in High-
Resolution Images. In Proceedings of the 28th Spring
Conference on Computer Graphics, pages 129–136.
Tekin, E. and Coughlan, J. (2012). BLaDE: Barcode Local-
ization and Decoding Engine. Tech. Rep. 2012-RERC.
01.
Wachenfeld, S., Terlunen, S., and Jiang, X. (2008). Robust
Recognition of 1-D Barcodes Using Camera Phones.
In Pattern Recognition, 2008. ICPR 2008. 19th Inter-
national Conference on, pages 1–4.
Zamberletti, A., Gallo, I., and Albertini, S. (2013). Ro-
bust angle invariant 1D barcode detection. In Pattern
Recognition (ACPR), 2013 2nd IAPR Asian Confer-
ence on, pages 160–164.
Zamberletti, A., Gallo, I., Carullo, M., and Binaghi, E.
(2010). Neural Image Restoration for Decoding 1-D
Barcodes using Common Camera Phones. In VISAPP
(1), pages 5–11.
