
Multi-Modal Integrated Mini-QEEG Solution with Results, Training
Protocols and Neurofeedback in Real-time
Francisco Marques-Teixeira
1
, Horácio Tomé-Marques
1
, João Andrade
1
and João Marques-Teixeira
1,2
1
Neurobica, Neurobios - Instituto de Neurociências, Rua Agostinho de Campos, 369, 4200-015, Porto, Portugal
2
Laboratory of Neuropsychophysiology, University of Porto, Rua Alfredo Allen, 4200-135, Porto, Portugal
Keywords: Neurofeedback, BCI, Brain-Computer_Interaction, EEG, Electroencephalography, QEEG, Quantitative EEG,
Mini-QEEG, Dysfunctional Patterns, EEG Phenotypes.
Abstract: Many Neurofeedback softwares allow clinicians to develop modular protocols. Some even allow to be per-
formed quantitative Electroencephalography (QEEG) analysis. However, an all-in-one solution does not exist,
with built-in decision tree, that permits to perform a QEEG analysis, apply a protocol decision, and perform
subsequent iterated mini-QEEG analysis, and subsequente protocol decisions and training, in the same sys-
tem. Our application, besides being able to make the identification of the brain dysfunctional patterns con-
cerning its electrophysiology, and accurately choose the Neurofeedback training protocols to apply, performs
real-time Neurofeedback. We compared our system with a conventional EEG and QEEG system in a proof of
concept rational, obtaining an average Pearson Correlation Coefficient of 0.89 regarding the dysfunctional
patterns and protocols, as well as remitted dysfunctional patterns. In conclusion, our application is pervasive,
scalable and potentially ubiquitous. And it can be extended into multiple and different consumer fields.
1 INTRODUCTION
This extended abstract aims to present the model be-
hind an application for Neurofeedback (NF) training.
Our model purposes a multi-modal integrated mini
quantitative Electroencephalography (mini-QEEG)
solution with results, training protocols and NF in
real-time. Firstly, we present the theory behind brain
performance optimization and how it differs from
clinical NF. Secondly, we present how this theory can
be applied to our software architecture model and
how the system architecture is organized. To finalize,
we present some preliminary results on how this sys-
tem is as accurate and valid as a conventional clinical
EEG and NF system.
Neurofeedback is a brain performance technique
that uses processes of operant conditioning which leads
to self-regulation of brain activity (Ute Strehl, 2014).
Recent studies suggest that EEG Neurofeedback repre-
sents feasible and promising a tool for therapeutic in-
terventions, and cognitive enhancement (Enriquez-
Geppert et al, 2017), and that critical brain dynamics
can be modulated with closed-loop stimulation in an
automatic, involuntary fashion (Zhigalov et al, 2016).
We developed an application that processes EEG
signal from 16 channels in real-time, computes met-
rics, e.g., power, frequency, phase, for each electrode,
and, according to inter- and intra-hemispheric physi-
ological ratios and asymmetries of the main fre-
quency bands (theta, alpha and beta), it assesses the
main dysfunctional brain electrophysio-logical pat-
terns in each user, and the main Neurofeedback pro-
tocols to perform according to a severity order.
We also programmed a decisional tree that as-
sesses the success of each Neurofeedback session and
outputs which protocol of the list should be done af-
terwards, up to 10 sessions per protocol. A user’s
block is composed of 3 protocols and, in the end of
the block, another QEEG is automatically registered
for verification of the overall improvement. If the im-
provement is satisfactory according to a defined
threshold, the training is finished. However, if not,
another block of 1 Neurofeedback protocol (up to 10
sessions) is recommended. The program repeats this
process until the improvements are satisfactory.
2 METHODS
To develop this application, we have used the Pro-
cessing Software, based in Java, to write and compile
all the code.
The system architecture was based on a fixed
main steps model:
Marques-Teixeira F., TomÃl’-Marques H., Andrade J. and Marques-Teixeira J.
Multi-Modal Integrated Mini-QEEG Solution with Results, Training Protocols and Neurofeedback in Real-time.
In NEUROTECHNIX 2017 - Extended Abstracts (NEUROTECHNIX 2017), pages 5-9
Copyright
c
2017 by SCITEPRESS – Science and Technology Publications, Lda. All rights reserved
1. Pre-processing: EEG signal Processing;
2. Post-processing: metrics computation;
3. QEEG: rules and protocols decisional tree;
4. Neurofeedback: mini-QEEG and training
analysis
5. Validation of the whole application and ex-
tracted metrics.
For the first (1) step, we applied Fast Fourier
Transform (FFT), with a 0.98 Hz resolution, to 16
scalp electrodes (Fp1, Fp2, Fz, F3, F4, Cz, C3, C4,
T3, T4, Pz, P3, P4, O1, O2, Oz (this channel is repre-
sented as the average between O1 and O2). We use
linked-ears reference and ground is located on AFz
site. Based on the frequency spectrum, a known lead-
off detection current and Ohm’s Law, we also com-
pute the impedance in each electrode.
For the second (2) process, we computed the spec-
tral power for each electrode and for different fre-
quency bins and frequency-bands, in real-time.
We also developed a blink and jaw clench detec-
tion routine. When one of these events is detected, the
software assumes the value of the referred metrics as
the result of the linear interpolation of the last 4 val-
ues computed.
For the third (3) process of this work, we com-
puted dysfunctional patterns, such as dysfunctional
power ratios, asymmetries inter-hemispheric and in-
tra-hemispheric, among others.
These dysfunctional patterns were based in devi-
ations of the normal brain electrophysiology, grouped
as instabilities (frontal alpha asymmetry, frontal beta
asymmetry, antero-posterior beta inversion) (Da-
vidson, 1979, 2004; Harmon-Jones, 2004; Minnix et
al., 2004; Nitschke, et al., 2004; Sutton and Davidson,
1997; Wiedemann et al., 1999), disconnection (dis-
rupted Hibeta at T3 and/or T4) (Coan and Allen,
2004), blocking (disrupted Hibet:beta ratio at Fz
and/or Pz, also known as Swingle ratio) (Swingle and
Paul, 2015); hot temporals (high percentage of beta
and hibeta at T3 and/or T4), and dystonus (hypertonus
and hypotonus) (Hagemann, 2004).
Our software has a table of rules of dysfunctional
patterns grouped according to the groups referred
above and every-time there is a ratio that is inverted
or not-present the rule is turned-on, thus, the dysfunc-
tional pattern is considered.
Our software ranks the dysfunctional patterns of
the user according to an serial order, based on their
score, and link that dysfunctional order to a specific
training protocol. As soon as a NF training session is
completed, the efficiency of the protocol is automati-
cally assessed by a mini-QEEG, in such a way that
the program will decide if the user will need to train
the same protocol again or will jump to the next one
in the serial order. In this application, the minimum
training sessions per protocol are 6 sessions and the
maximum are 10 sessions. Each training block is
composed by 3 training protocols and each block has
a minimum of 18 sessions (3x6) and a maximum of
30 sessions (3x10).
In the end of each block, the program performs a
post-block QEEG to assess the success of the training.
If the overall dysfunctional patterns are not corrected,
the client will be indicated to do another block, this
process being repeated until the dysfunctional pat-
terns normalize. All the computation is done instanta-
neously.
For the fourth (4) process, we have programmed a
real-time feedback related to a base-line measured in
each training session that indicates the positive and
negative feedback to be given to the user according to
the dysfunctional pattern rule (reinforce or inhibit a
certain frequency band in specific electrodes). This
feedback is adaptive relative to a moving base-line, of
60 seconds, that dictates its difficulty level. Thus, we
created a generative feedback, according to the level
of the user’s learning.
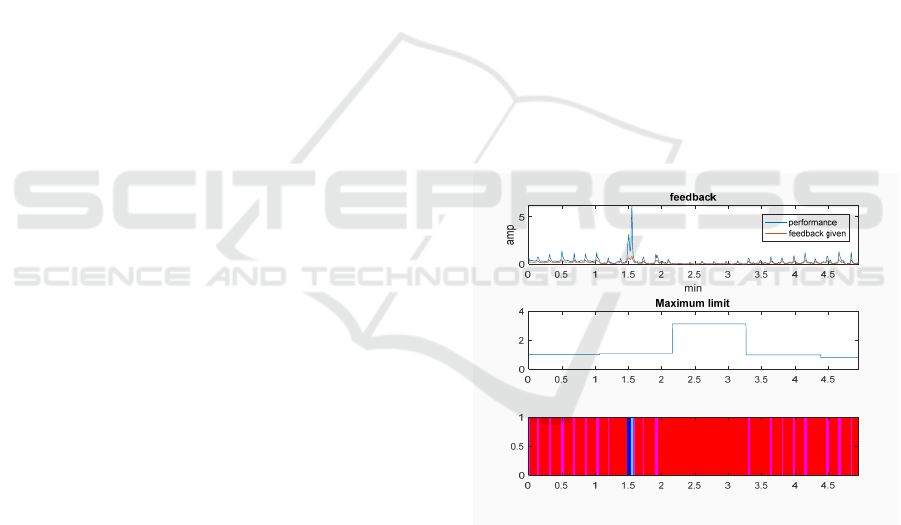
Figure 1: Example of the generative adaptation of the feed-
back of one user. First plot – user’s performance in blue and
feedback given in orange. Second plot – Maximum limit
used to compute the feedback. Third plot – feedback given
(from worst to best: red, pink, dark blue, light blue). We can
see that the maximum limit goes up because the metric be-
ing trained rises in the moving base-line. Thus, the user
stops receiving a positive feedback because now the level
is more difficult. Then, since it became “too hard”, the max-
imum limit drops down again, and the user starts receiving
more positive feedback again.
To validate (5) this application:
1) we compared it to a standard QEEG system;
2) and perform NF sessions to assess the training
efficiency of the system.
Regarding the QEEG system comparison we used
the Neuronic E8.5 system (neuronicsa.com) for the
EEG registration and the Neuroguide software (ap-
pliedneuroscience.com) for editing and processing
EEG data.
We have made 4 recordings with 4 different users,
3 males and 1 female, mean age 34,75, with eyes
closed. Each recording is composed by 2 consecutive
1 minute acquisitions using Neurobica (our system)
and Neuronic. The same electro-cap (http://electro-
cap.com) was used with both systems and only the
connections to the EEG acquisition system was
changed, so all the practical physical conditions were
maintained for both systems. We verified the imped-
ances with Neurobica, maintaining their values below
10 KΩ before recording the signal.
Regarding the clinical validation of the NF train-
ing, 1 user made 11 sessions of approximately 5
minutes, in two days (6 in the first and 5 in the fol-
lowing day). All sessions were done with the same
NF protocol (based on the reinforcement of β band in
F3 channels relatively to F4) to study its metric evo-
lution with the training.
3 RESULTS
In this section, we present the preliminary results for
the comparison of the metrics (a) computed with the
Neuronic system and ours (b) as well as the Neu-
rofeedback training results.
3.1 Systems Comparison
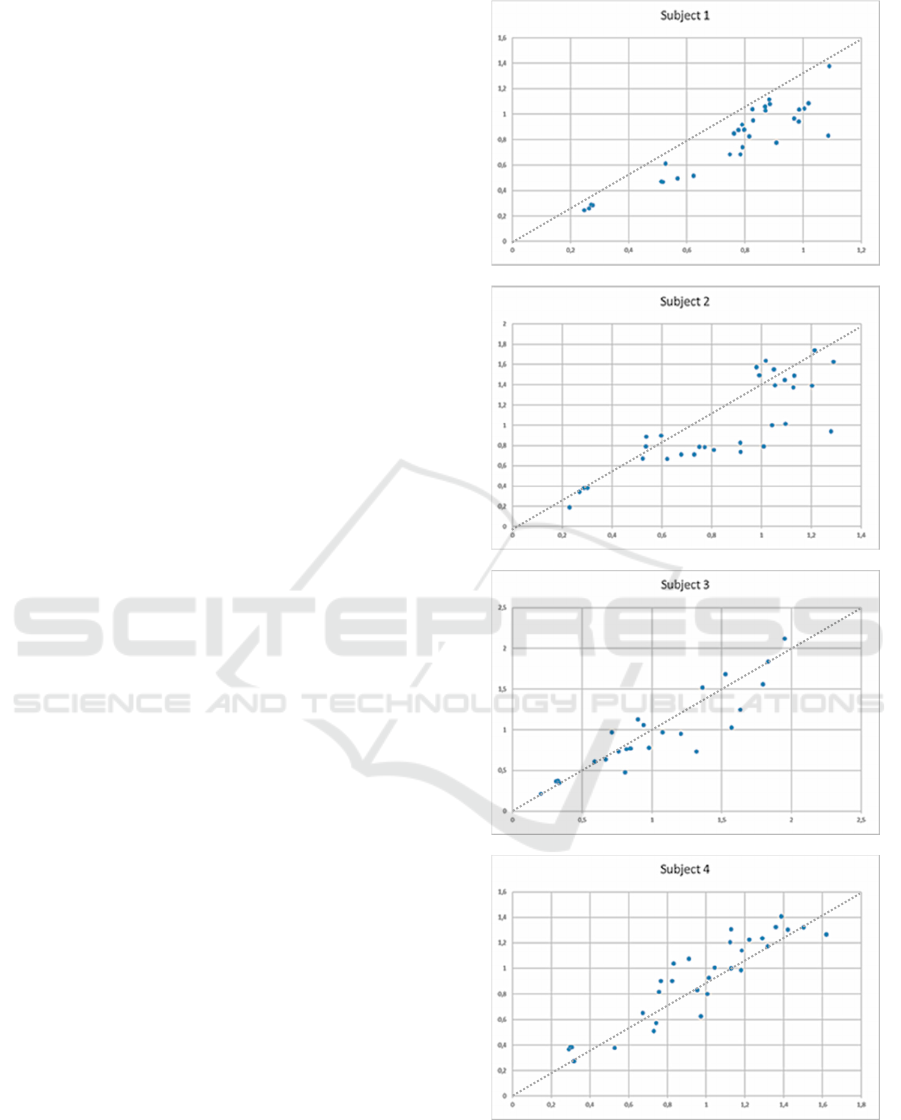
Figure 3 shows the comparison between the results of
the 2 sets of one minute acquisitions, Neuronic and
Neurobica, for the four users included in the study.
This comparison was done based on the values com-
puted for the metrics corresponding to the dysfunc-
tional patterns scores. Neuronic values were com-
puted offline, after acquisition, using MATLAB
(www.mathworks.com), and Neurobica results were
computed online by our application.
Figure 2: Comparison between results computed after of-
fline processing of Neuronic acquisition (x axis) and online
processing during Neurobica acquisition (y axis).
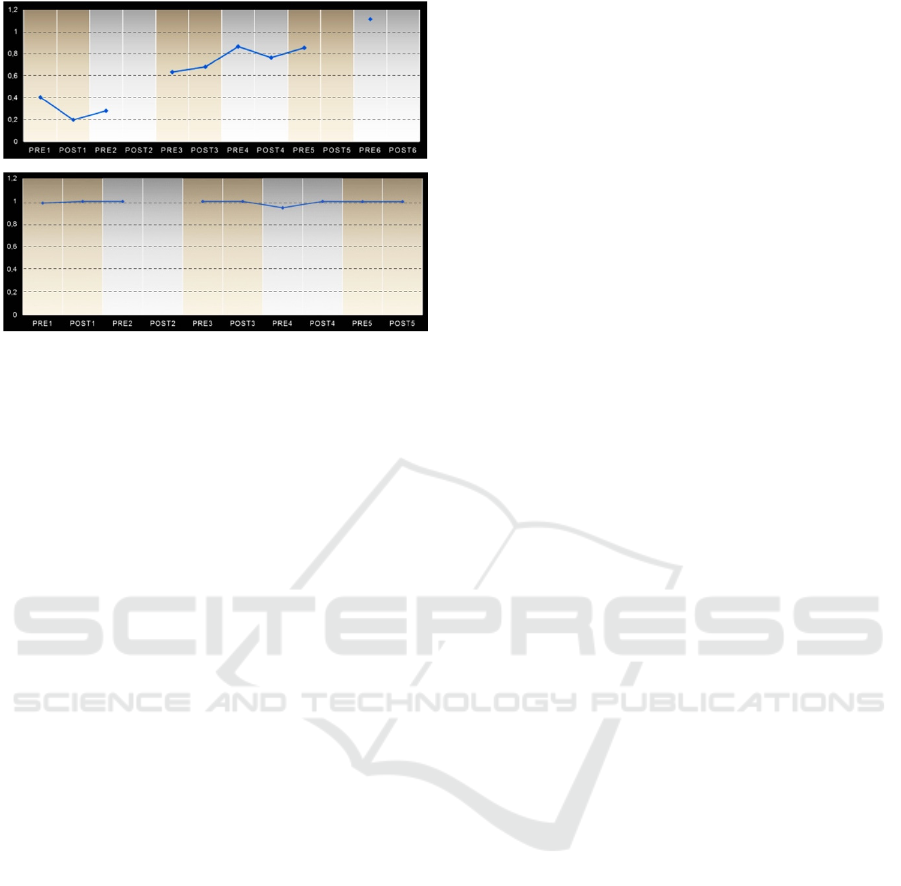
Figure 3: Dysfunctional pattern metric score across NF
training sessions in the first (above) and second (below)
days. Some values are missing because they were not rec-
orded. Optimal value should be above 1. In the beginning
of the first day, the score is significantly below that value.
It rises as the sessions are made, until it reaches a value
higher than 1. In the second day, it maintains its value
around 1.
As it can be seen in the plots of the correlation results
are statistically significant (for all users, p-value <
0.001), with an average Pearson Correlation Coeffi-
cient of 0.89.
3.2 Neurofeedback Training
For preliminary assessment of NF training efficiency,
one users spent two consecutive afternoons perform-
ing NF with the same protocol. Each NF session
lasted for 5 minutes and small breaks between ses-
sions were made. The specific dysfunctional pattern
metric relative to the protocol was computed before
and after NF training. Figure 3 shows this metric evo-
lution across time in the two afternoons of training.
4 DISCUSSION
4.1 Systems Comparison
The preliminary results indicate that the online anal-
ysis performed by the Neurobica system is strongly
correlated with the offline analysis made after the ac-
quisition with Neuronic, which leads us to suggest
that we are measuring and computing reliable data.
4.2 Neurofeedback Training
Neurofeedback training preliminary results are very
satisfying and encouraging because they show the ef-
fectiveness of the NF training in the regularization of
the dysfunctional pattern metric score, in the first day.
They also show that, after regularized, the metric sta-
bilizes in the following day. This is an important con-
clusion relatively to Neurofeedback effectiveness in
general and more studies based on this approach are
going on, with more users and different follow-up
periods.
4.3 Future Work
For this work, we programmed all the metrics and ra-
tios computation. Efforts are being made for in the fu-
ture to work on the mining of all the intra and inter
user data in a local server. During this process, all the
data will be returned to the users in a dashboard with
the following information: 1) scheme of the training
sessions accomplished according with the training
proposed by the application that self-organizes ac-
cording to the success in the correction of the dys-
functional patterns; 2) information about the training
protocol used in each session and how was the evolu-
tion of the metrics and rations of that protocol; 3) in-
formation about the dysfunctional patterns assesses in
the QEEG of each user; 4) topographic maps of the
respective metrics and ratios of each user; 5) we are
also working on the assessment of cognitive perfor-
mance improving, symptom reduction and behav-
ioural and well-beingness changes after the
Neurofeedback training and ; 6) we are preparing the
extension this pilot study to more subjects in order to
accomplish the final validation of this integrated
system.
ACKNOWLEDGEMENTS
This project is funded by the program Horizon 2020.
REFERENCES
Davidson, R.. J., Schwartz, G. E., Saron, C., Bennett, J.,
Goleman, D. J., 1979. Frontal versus parietal EEG
asymmetry during positive and negative affect. Psycho-
physiology 16, 202–203.
Davidson, R. J., 2004. What does the prefrontal cortex
“do” in affect: Perspectives on frontal EEG asymmetry
research. Biological Psychology 67, 219–233.
Coan, J. A. Allen, J. J. B., 2004. EEG Asymmetry as a
moderator and mediator of emotion. Biological Psy-
chology 67, 7–49.
Enriquez-Geppert, S., Huster, R. J., and Herrmann, C. S.

2017. EEG-Neurofeedback as a Tool to Modulate Cog-
nition and Behavior: A Review Tutorial. Frontiers in
Human Neuroscience, 11, 51.
Hagemann, D., 2004. Individual differences in anterior
EEG-asymmetry: Methodological problems and solu-
tions. Biological Psychology 67, 157–182.
Harmon-Jones, E., 2004. Contributions from research on
anger and cognitive dissonance to understanding the
motivational functions of asymmetrical frontal brain
activity. Biological Psychology 67, 51–76.
Minnix, J. A., Kline, J. P., Blackhart, G. C., Pettit, J. W.,
Perez, M., Joiner, T. E., 2004. Relative left frontal
activity is associated with increased depression in high
reassurance-seekers. Biological Psychology 67,
145–155.
Nitschke, J. B., Heller, W., Etienne, M. A., Miller, G. A.,
2004. Prefrontal cortex activity differentiates processes
affecting memory in depression. Biological Psychology
67, 125–143.
Sutton, S. K., Davidson, R. J., 1997. Prefrontal brain asym-
metry: A biological substrate of the behavioural ap-
proach and inhibition systems. Psychological Science
8, 204–210.
Wiedemann, G., Pauli, P., Dengier, W., Lutzenberger, W.,
Birbaumer, N., Buchkremer, G., 1999. Frontal brain
asymmetry as a biological substrate of emotions in pa-
tients with panic disorders. Archives of General Psy-
chiatry 56, 78–84.
Strehl, U. 2014. What learning theories can teach us in de-
signing neurofeedback treatments. Frontiers in Human
Neurosciences, 8: 894.
Swingle and Paul, G. 2015. Adding Neurotherapy to Your
Practice.
Zhigalov A., Kaplan A., Palva J. M. 2016. Modulation of
critical brain dynamics using closed-loop neurofeed-
back stimulation. Clinical Neurophysiology, Volume
127, Issue 8 , 2882 – 2889.
