
Quality-Based Behavior-Based Control for Autonomous Robots
in Rough Environments
Thorsten Ropertz, Patrick Wolf and Karsten Berns
Robotics Research Lab, Dep. of Computer Science, University of Kaiserslautern, Kaiserslautern, Germany
Keywords:
Behavior-based Control, Quality-based Perception, Localization, Off-road Robotics.
Abstract:
Autonomous navigation in unstructured environments is a challenging task for which behavior-based control
systems proved to be suitable due to their inherent robustness against unforeseen situations. But especially the
robust perception is still an unsolved problem leading to severe system failures. This paper faces the perception
problem by introducing a new data quality-based perception module based on the integrated Behavior-Based
Control (iB2C) architecture. Therefore, a new concept of data quality in behavior-based systems and methods
for quality-based data fusion are developed while taking advantage of the modularity, extensibility and trace-
ability of the existing architecture. To demonstrate its capabilities, a perception network for robot localization
is derived and its outcomes are compared to an state of the art localization filter in simulation and in a real
world scenario as well.
1 INTRODUCTION
Today, driving vehicles becomes easier and safer due
to the rising amount of assistant systems. While cur-
rent research provides promising results in the di-
rection of fully autonomous vehicles in on-road sce-
narios, solutions for off-road environments are far
more away. To tackle the problem of controlling self-
driving vehicles in rough environments, behavior-
based control systems (BBS) have shown to be suit-
able. In contrast to classic, sense-plan-act-based con-
trol architectures, BBS are highly distributed and the
overall system behavior emerges from the direct inter-
action of rather simple components. Thereby, the dy-
namic arbitration mechanism and the partially over-
lapping functionality of the components increase the
robustness against environmental changes and unfore-
seen situations. The inherent modularity facilitates
the independent design, development and testing of
individual behavior components and fosters reuse as
well as extensibility (Berns et al., 2011).
In spite of all these advantages, the behavior-based
control approach focuses the control part and lacks of
a suitable concept for the perception support. Espe-
cially in unstructured off-road environments, the ro-
bust and reliable perception is a challenging but in-
evitable task. Perception is usually characterized by
fluctuating noise since the perfect sensor does not ex-
ist. Instead, the quality is raised by applying complex
filters and fusing measurements of different sensors
and sensor types. Kalman filters for example are
commonly used due to their good results based on
predictive system models and statistical data assess-
ment. Unfortunately, their closed structure exacer-
bate the traceability in case of errors and the required
model linearity may restrict the provided precision.
By exploiting the inherent modularity of behavior-
based systems, our approach decomposes the indi-
vidual prediction and assessment steps into separated
perception modules. While the usage of rather sim-
ple fusion modules based on the data quality defini-
tion allows for a simple extension of additional sen-
sor systems, the stepwise calculation of data quality
allows for an easy identification of sensor problems
like over-exposure in images or imprecise GNSS po-
sitions due to shadowing effects.
Instead of raising the perception quality by ad-
vanced filters and fusion algorithms, the robot could
also actively improve its perception by changing the
perception conditions. E.g. the robot could move the
camera to reduce over-exposure or navigate to free ar-
eas to reduce GNSS shadowing. To do so, an evalua-
tion of the sensor system concerning different aspects
is required, which is hidden in the internal calculation
of standard filters. The usage of the standard behavior
meta-signals to reflect the quality in the presented ap-
proach allows for a direct interaction of controller and
perception modules such that the quality information
Ropertz, T., Wolf, P. and Berns, K.
Quality-Based Behavior-Based Control for Autonomous Robots in Rough Environments.
DOI: 10.5220/0006481405130524
In Proceedings of the 14th International Conference on Informatics in Control, Automation and Robotics (ICINCO 2017) - Volume 1, pages 513-524
ISBN: 978-989-758-263-9
Copyright © 2017 by SCITEPRESS – Science and Technology Publications, Lda. All rights reserved
513

can directly influence the control decisions. Vice
versa, control modules can be used as virtual sensors
for the perception system without modifications en-
abling a sophisticated situation aware perception sys-
tem.
In this paper, a new approach for the seamless in-
tegration of perception into the behavior-based con-
trol architecture iB2C is presented. First, a brief
overview of state of the art perception architectures
is given in section 2. In section 3 the integrated
Behavior-Based Control architecture iB2C is intro-
duced. The used quality metrics are discussed in sec-
tion 4 which serves as a basis for the new perception
component introduced in section 5. For combining
perception data, special fusion percepts are defined in
section 6. In section 7 an iB2C predictive fusion pat-
tern is shown that resembles Kalman filter like sen-
sor data fusion. To evaluate the proposed approach,
experiments have been run in simulation and in real
world scenarios as well. Test results are presented in
section 8. Section 9 finishes with a conclusion and
ideas for future work.
2 RELATED WORK
Since their invention in the 1980s, many behavior-
based control architectures [(Brooks, 1986),(Matari
´
c,
1997), (Arkin, 1998), (Jones, 2004), ...] have
been proposed mainly focusing on reactive behav-
iors breaking the well established sense-plan-act loop.
The behavior-based control architecture presented in
(Lenser et al., 2002) for example clearly separates
the perception (sensor hierarchy) and the control (be-
havior hierarchy). Thereby, the data flow is uni-
directional, i.e. each behavior can access all percep-
tion modules without regarding any hierarchy but the
perception modules do not know anything about the
control parts state and its intentions. In (Mantz and
Jonker, 2007) this architecture is modified to allow
for behavior specific perception. Due to the strong
dependence of the perception problem on the current
situation and the robots current actions, a behavior-
based hierarchy is proposed in which each module
represents a separate sense-think-act loop. Thus, each
behavior is equipped with its own tailored perception
modules such that the situation awareness can be used
for an automatic selection of the most suitable imple-
mented algorithm leading to perception quality im-
provements while lowering the computational costs.
In behavior-based control architectures the main idea
is that the overall system behavior emerges from mul-
tiple concurrently running behaviors which influence
each other. Unfortunately, this strict mapping limits
the reusability within the system and cross-influences
between the behaviors are difficult to realize. The ar-
chitecture proposed in the work at hand solves this
problem by interpreting percepts similar to behaviors
concerning their influence in the current system state.
But robust perception of the environment is also
an unsolved research area beyond the behavior-based
control paradigm. To handle the usually complex and
inaccurate data provided by sensor systems, the mul-
tisensor approach is often applied. Thereby, mea-
surements from multiple, complementary sensors are
fused increase the perception accuracy and certainty
(Khaleghi et al., 2013). In (Bader et al., 2017) a
fault tolerant architecture for data fusion based on
Kalman filters (Kalman, 1960) is presented. Kalman
filters are linear Gaussian filters which use the sys-
tems dynamic model to make predictions in combina-
tion with known control inputs and sequential noise
sensor measurements. The authors of (Bader et al.,
2017) use Kalman filters to fuse different sensors for
localization. Results of the fusion modules are then
compared to detect significant deviations which indi-
cate errors. Possible errors are traced back to their
source (hardware error, or error in fusion algorithm)
and suppressed by using the correctly working redun-
dant source. In the approach presented in this work,
an evaluation and assessment of the quality of the out-
put is calculated in each step such that defective data
is automatically suppressed in the fusion. Thereby,
the evaluation is not limited to be done locally. In-
stead, multiple perception behaviors can degrade the
data quality sequentially allowing for sophisticated
cross-evaluation.
3 Integrated Behavior-Based
Control (iB2C)
The integrated behavior-based control (iB2C) archi-
tecture (Proetzsch, 2010) has been developed at the
Robotics Research Lab of the University of Kaiser-
slautern. The basic unit in iB2C networks are generic
behavior modules (see Figure 1).
s
Behavior
i
a
r
~e
~u
Figure 1: Standard iB2C behavior B = ( f
a
,F).
A behavior B offers a standardized interface and is de-
fined by the activity function f
a
(~e) ∈ [0,1] and the
transfer function F(~e) which specifies the output
ICINCO 2017 - 14th International Conference on Informatics in Control, Automation and Robotics
514

vector ~u based on the input vector ~e. It can be stimu-
lated by another behaviors activity via the stimulation
input s and inhibited via the inhibition input i. The
behaviors internal activation ι = min (s,1 −i) ∈[0, 1]
describes the effective relevance of B in the network.
It limits the behaviors activity a = min (ι, f
a
(~e)) ∈
[0,1] which represents the amount of influence in the
current system state. The target rating r = f
a
(~e) ∈
[0,1] resembles the behaviors contentment with the
current system state. While the so called meta-
signals s,i, a, r are strictly defined in- and outputs, the
vectors ~e and ~u can carry arbitrary sensor and control
data.
In order to resolve ambiguities when multiple be-
haviors propose control values for actuators or other
behaviors, special coordination behaviors are defined.
These fusion behaviors work on the meta-signals and
inherit the common behavior interface. Two examples
are the maximum fusion behavior and the weighted av-
erage fusion behavior. The former just forwards the
control values of the most active connected behavior.
The activity a is given with
a = min (ι,max (a
c
)) (1)
while the derived target rating r is
r = r
s
, where s = argmax
c
(a
c
) (2)
and the output u results in
u = u
s
, where s = argmax
c
(a
c
) (3)
The later calculates the average of the control data
weighted by the providing behaviors activity as de-
scribed by the following equations for the three tuple
of activity a, target rating r and output u:
a = min
ι,
∑
p−1
j=0
a
2
j
∑
p−1
k=0
a
k
!
(4)
r =
∑
p−1
j=0
a
j
·~r
j
∑
p−1
k=0
a
k
(5)
u =
∑
p−1
j=0
a
j
·~u
j
∑
p−1
k=0
a
k
(6)
4 DATA QUALITY
Quality of data in behavior-based perception systems
is the certainty of data interpreted as the amount of
compliance of perceived and correct data.
The absolute data quality σ ∈ [0, ∞) is defined
as the difference of the expected and the measured
values and equals the standard deviation with a mean
Gaussian equal to zero µ = 0.
p(u) =
1
√
2π ·σ
·e
−
1
2
(
u−µ
σ
)
2
(−∞ < u < ∞) (7)
The perception goal, or target quality Σ ∈ [0,∞)
defines the minimum necessary precision to fulfill a
given task. The difference between target quality and
achieved quality is defined by the ratio A of both val-
ues
A =
Σ
R
−Σ
1
√
2π·σ
·e
−
1
2
(
u
σ
)
2
σ
R
−σ
1
√
2π·σ
·e
−
1
2
(
u
σ
)
2
, (8)
where A ≥1 means that the perception goal is fulfilled
while A < 1 means that the necessary precision is not
achieved. The relative data quality α = min(1,A) ∈
[0,1] expresses to which amount the absolute data
quality fulfills a desired target quality. To avoid of
the computational overhead caused by the numerical
integration of the Gaussian functions, the relative data
quality is approximated by
α = max
0,min
1,
Σ
σ
(9)
Quality Degradation. Assessing the actual quality
is a quite complex task and usually incorporates sev-
eral steps. In addition to noise given by the sensor
itself and the measurement principle, faulty data can
arise from environmental conditions or other sources.
Therefore, a separate handling of different quality
aspects simplifies the process but requires a step-
wise modification of the absolute quality by exploit-
ing degradation accumulation (see Figure 2). Quality
degradation by N successive measurements results in
a combined quality
σ
t
=
N−1
∑
i=0
σ
2
i
!
1
2
(10)
The combined data quality is the superposition of
the accumulated qualities. An absolute data quality of
p
i
(u)
p
i+1
(u)
Figure 2: Sequen-
tial quality evalu-
ation and degrada-
tion.
p
i
(u) p
i+1
(u)
Figure 3: Redundant quality eval-
uation and averaging of the quality
information.
Quality-Based Behavior-Based Control for Autonomous Robots in Rough Environments
515

σ = 0 represents a neutral element, i.e. the total qual-
ity cannot be improved nor degraded. This is used by
sequences of quality degrading units, where different
quality affecting aspects are estimated to derive the
total quality. Similarly, a single node applying σ → ∞
to its corresponding quality degrades the quality of
the total processing chain.
Weighted Quality Degradation. Weighted quality
degradation is a generalization of quality degradation,
in which the amount of influence can be controlled for
each value by the weight w.
σ
t
=
N−1
∑
i=0
w ·σ
2
i
!
1
2
(11)
The weighted degradation can be used to react better
on safety relevant events. For instance, a node can
degrade the quality stronger than it actually does to
trigger a fall-back system earlier.
Quality Average. The quality average combines
multiple quality values while not necessarily decreas-
ing the output value in contrast to the degradation
mechanism.
σ
t
=
1
√
N
N−1
∑
i=0
σ
2
i
!
1
2
(12)
Typical use cases are redundant quality measurements
where the similar quality aspects are determined in
parallel (see Figure 3).
Weighted Quality Average. Similar to the case be-
fore, the quality can be also combined by weighted
averaging.
σ
t
=
1
√
N
N−1
∑
i=0
w ·σ
2
i
!
1
2
(13)
It is required for increasing or decreasing the influ-
ence of components. For instance, a single node can
be weighted as strong as a set of competing nodes.
5 PERCEPT
A perception behavior (percept) P is a behavior com-
ponent specially designed to support the data qual-
ity assessment. The terms “percept” (Arkin, 1998,
p. 268) and “percepts” (Sch
¨
afer, 2011, p. 28) have
already been mentioned in the context of behavior-
based robotics but not explicitly specified.
s
Percept
i
a
r
~e
~u
Figure 4: Percept behavior P = ( f
a
, f
p
u
,F).
In context of the iB2C architecture, a percept is de-
fined by the 3-tuple P = ( f
a
, f
p
u
,F) consisting of the
activity function f
a
, the data quality transfer function
f
p
u
, and the transfer function F. The specialized in-
terface behavior inputs ~e and outputs ~u are enriched
by perception meta inputs ~p
e
and outputs ~p
u
, which
contain the data quality information while the com-
mon iB2C interface is kept unchanged (see Figure 4)
to apply to the iB2C design rule of behavior interface
duality which defines that a behavior interface must
provide standardized and arbitrary ports (Proetzsch,
2010).
Meta Information. A percept consists of an arbi-
trary number of perception ports defined by a tuple
~e = (~x
e
, ~p
e
) for inputs and ~u = (~x
u
, ~p
u
) for outputs re-
spectively. The perception meta ports ~p
e
and ~p
u
con-
tain the quality information
−−−−−→
(σ,Σ, α) corresponding to
the data in-/output. Additionally, each data port is
enridged by the current quality estimation σ. Each
percept contains furthermore its desired quality Σ and
its relative quality α.
Uncertainties are stepwise added in assessing per-
cepts afterwards. Therefore, the data quality trans-
fer function f
p
u
derives absolute quality values and
passes them to the output. Additionally, the relative
quality of data is evaluated which is used by the com-
mon interface.
The percept’s activity a = f
a
(~e) represents the av-
erage relative data quality of an arbitrary set of rel-
ative qualities α contained by the percept. Accord-
ingly, the α components can be understood as the
component-wise activity of the percept module lead-
ing to the following restrictions: α ∈ [0, 1] and α ≤ ı
where ı is the activation of the percept. The limitation
of the relative quality α ensures that the activity a is
within the bounds defined by the definition of activ-
ity and the principle of activity limitation (Proetzsch,
2010).
The activity of a percept is equal to the activation ı
under the condition that all target qualities are satis-
fied. A perception goal with an infinite standard devi-
ation Σ → ∞ results in a maximum relative data qual-
ity α = ı. Therefore, a percept reaches a maximum
activity if this condition applies for every component
considered by f
p
u
for the activity a.
ICINCO 2017 - 14th International Conference on Informatics in Control, Automation and Robotics
516

6 FUSION
BBS combine different data streams through fusion
mechanisms. The fusion was extended to suit bet-
ter for data fusion, based on the introduced percept.
It combines data on a component base with respect
to qualities. Nonetheless, the overall fusion princi-
ple still follows the standard fusion and the common
interface remains unchanged. The percept fusion is
defined by the 3-tuple F = ( f
a
, f
p
u
,F). All restric-
tions for the specialized interface of the standard fu-
sion module apply for the percept fusion behavior as
well. A visualization of the fusion module can be seen
in figure 5.
s
Fusion
i
a
r
~e
~u
Figure 5: Fusion behavior F = ( f
a
, f
p
u
,F) for standard or
component-wise perception fusion.
The principle of percept fusion behavior neutrality
is applied as extended principle to the iB2C rule of fu-
sion behavior neutrality. It is suited for the structure
of a perception port which can transmit vector com-
ponents. The principle states that the activity a, target
rating r and the relative component-based quality α
of each component of the input vector ~e with respect
to the perception goal of the percept fusion behavior
must apply to the following restrictions, where ı is the
activation of the percept fusion module
min
c
(a
c
) ·ı ≤a ≤min
1,
p−1
∑
j=0
a
j
!
·ı (14)
min
c
(r
c
) ≤ r ≤ max
c
(r
c
) (15)
min
c
(
~
α
c
) ≤
~
α ≤ min
1,
p−1
∑
j=0
~
α
j
!
·ı (16)
with
~
α = [α
0
,. . ., α
N−1
] where α
i
with i ∈[0, N −1] is
the i-th component of each input e ∈~e with the num-
ber of components N.
Similar to the standard fusion behavior, there ex-
ist two fusion strategies. The combination of input
data is performed component-wise based on a rela-
tive data quality α which is determined by the fusion
module itself. The percept fusion computes a target
sigma vector
~
Σ where a vector component Σ
i
repre-
sents the i-th element of an input data e for all inputs
~p
e
. The respective perception goal Σ
i
for an element
e
i
∈ e is the minimum value of every j-th absolute
quality value of each perception input p
e j
∈ ~p
e
.
Σ
i
= min
∀σ
i j
∈e
i
∈~p
e
(σ
ji
) (17)
where the number of component in e is equal to the
number of perception goals contained by
~
Σ. Respec-
tively, the relative perception meta information α
e
i
is
given by
α
c
i
= max
0,min
1,
Σ
i
σ
e
i
·ı (18)
with i ∈ [0, N −1] and N elements in ~e. Each partial
activity α
c
i
is contained in
~
α
c
.
~
α
c
= (α
c
0
,α
c
1
,. . ., α
c
N
) (19)
The relative data quality has the maximum partial ac-
tivity α
c
i
≤ ı based on the given equations. Elements
with a higher standard deviation represent a lesser rel-
ative quality value. The definition of absolute data
quality enables the reuse of standard fusion mecha-
nisms which are extended by the quality term and ap-
plied for each component.
6.1 Maximum Fusion
The percept maximum fusion forwards the input
component-value of each e ∈~e with the lowest de-
viation and absolute data quality σ ∈
~
σ
e
. The vec-
tor ~e
j
denotes the j-th input vector of all M inputs
~e. Element e
i
denotes the i-th component of an input
vector~e and value e
i j
the i-th component from vector
~e
j
. The output u
i
is given by the set of components
e
i
with minimum σ
i
of all vectors ~e
j
for each j. The
minimum deviation is given with the maximum par-
tial activity. Therefore, it applies
u
i
= u
s
, where s = max
c
(α
ci
) ∀i (20)
The absolute quality σ
i
is given by
σ
i
= min
∀j
(σ
i j
) ∀i (21)
and the target rating r
f
is based on the combined ac-
tivity a
c
a = min (ı,max (a
c
)) (22)
r = r
s
where s = max
c
(a
c
) (23)
6.2 Weighted Average Fusion
The perceptive weighted average fusion combines
values based on their quality. A date with smaller de-
viation and therefore high quality gets a larger weight.
It follows for the output component u
i
u
i
=
∑
p−1
c=0
α
ci
·u
ci
∑
p−1
c=0
α
ci
∀i (24)
Quality-Based Behavior-Based Control for Autonomous Robots in Rough Environments
517
The absolute quality σ
i
is
σ
i
=
∑
p−1
c=0
α
ci
·σ
2
ci
1
2
∑
p−1
c=0
α
ci
∀i (25)
The target rating r and activity a are defined as
a = min
ι,
∑
p−1
j=0
a
2
j
∑
p−1
k=0
a
k
!
(26)
r =
∑
p−1
c=0
a
c
·r
c
∑
p−1
c=0
a
c
(27)
7 PREDICTIVE FUSION
PATTERN
The extended fusion behavior enables the combina-
tion of different data streams on a quality base. In
contrast to command fusion, the pure fusion of sen-
sor data is not sufficient to compute a desired value.
Sensor data suffer from disturbances, measurement
errors, and require complex data processing to be fur-
ther used. A robot’s perception system is usually a
complex, multi-layered structure where data are com-
bined to higher level information. Errors accumulate
which likely causes misinterpretation of data. Obvi-
ously, this will cause tremendous problems concern-
ing the robot control and has to be overcome by the
BBS.
State of the art systems use Gaussian filters like
Kalman filter (KF) to fuse data and stay consistent.
KF contain sensor and motion models to predict the
next state while measurements correct the prediction.
Such a filter can also be implemented using percepts
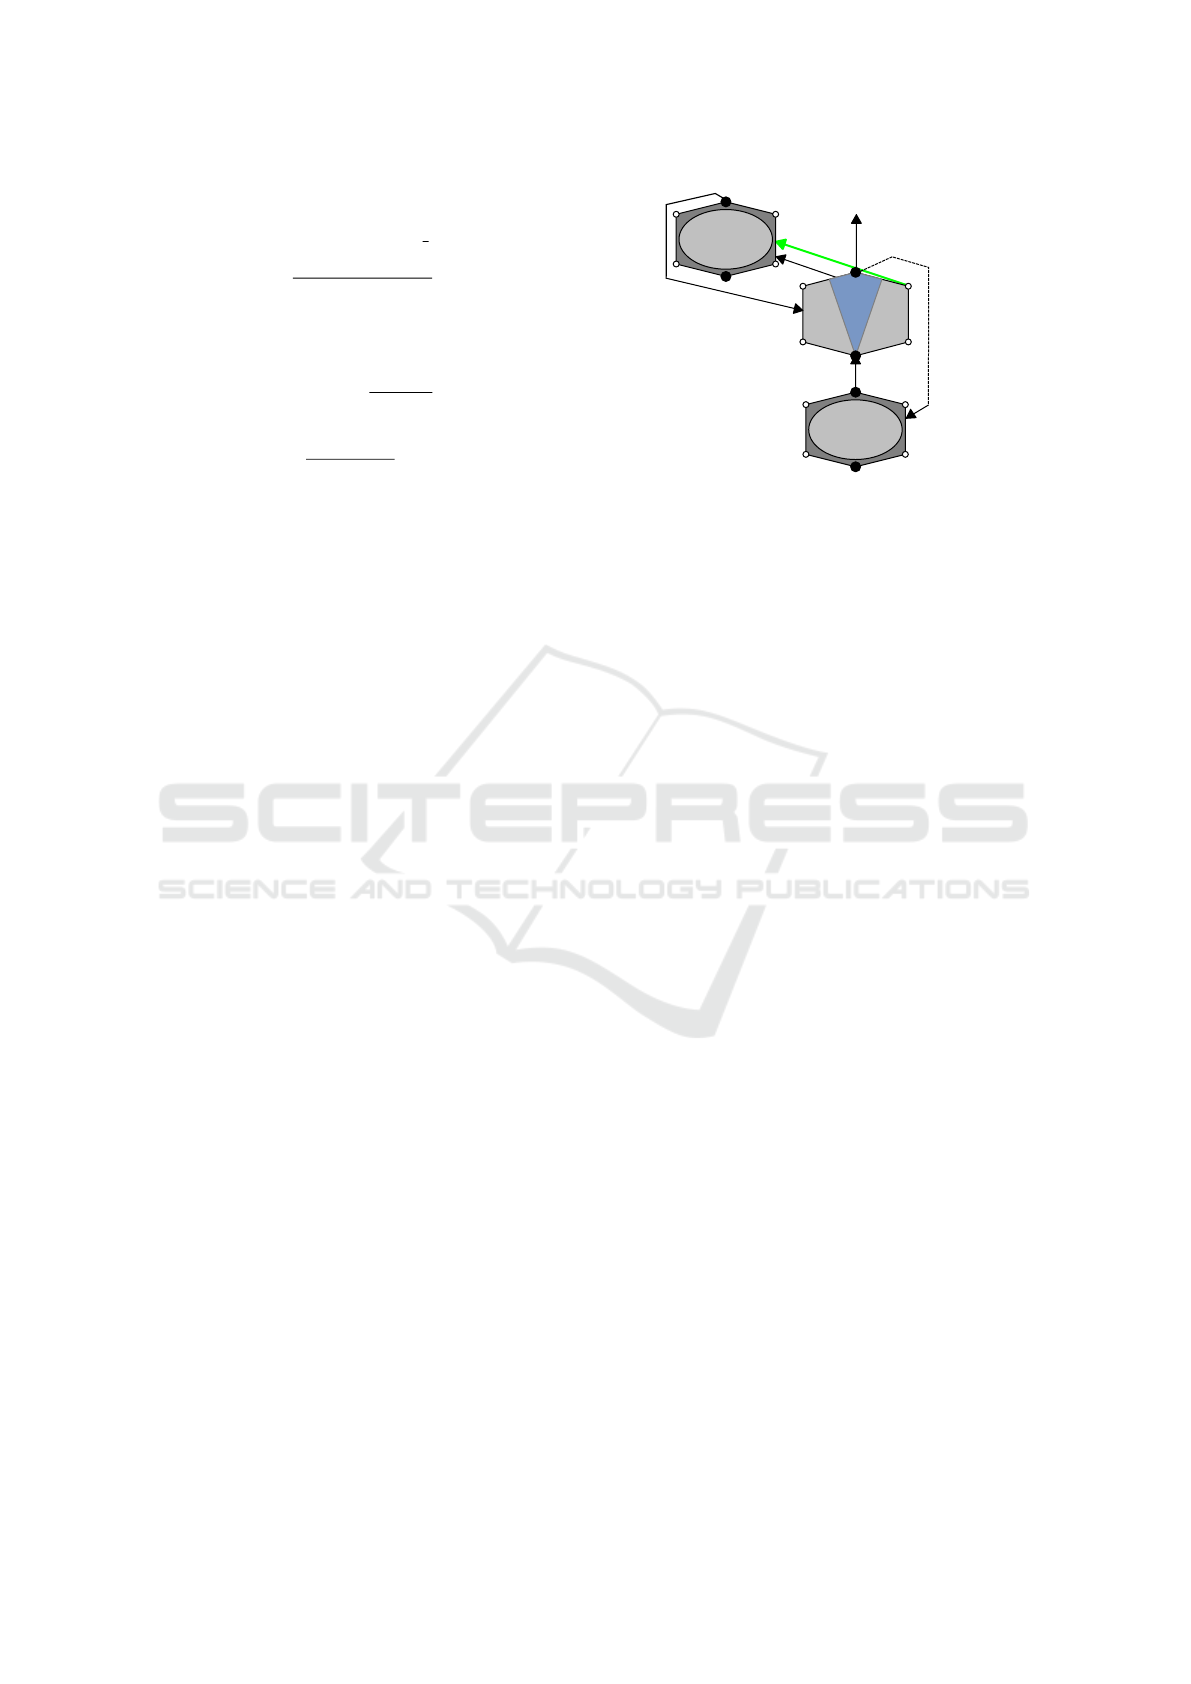
and extended fusion by instantiating the BBS pattern
shown in Figure 6. The pattern or sub-network com-
bines perception data from possibly multiple base per-
cepts Percept and a prediction module Predict using a
dedicated fusion percept Fusion. Thereby, the predic-
tion unit estimates the next signal’s values and pro-
vides it in the next time step to the fusion module.
The prediction can be based on the systems dynam-
ics model (Thrun et al., 2006) and is weighted by the
number of combined base percepts to gain equal in-
fluence compared to the other inputs.
The fusion percept provides the mean value and
acts as low pass filter. Its output may be used by the
base percepts as a feedback input for signal correc-
tion and adaptation which is for example useful in lo-
calization perception where local and global methods
are fused. By introducing feedback to the system, the
filter changes from an finite impulse response (FIR)
Percept
Fusion
Predict
Feedback
Figure 6: Predictive fusion pattern.
to an infinite impulse response (IIR) filter. IIR sys-
tems contain the history of all previous values and are
well known in signal processing. Compared to the
KF filter, the quality values which determine the in-
fluence of data with respect to the fusion correspond
to the KF gain. Inputs and outputs can be inter-
preted as multivariate normal distributions which are
expressed by uncertainties. The benefit of the pro-
posed filter against a traditional KF is a high degree
of non-linearity provided by percepts. KF also comes
with some downsides like the complex determination
of the best suited filter structure and difficult parame-
ter selection to find the best performance for the appli-
cation. Slips and drifts strongly affect filtering results
and provide different outcomes depending on the se-
lected architecture (Simanek et al., 2015).
Percept filters adapt to the processed data but their
structure can be also easily changed due to their high
extendability. Additional percepts and prediction
percepts can be added straight forward to data streams
and fusions. Another benefit is the open filter struc-
ture which enables external modules to observe the
internal state of the filter and adapt the fusion output
by accessing percepts for instance via inhibition or
stimulation. Furthermore, the network fosters trace-
ability of quality degrading events. Since the activity
of a percept corresponds to the current quality, an ac-
tivity drop within the network can be simply tracked
and indicates a sensor disturbance.
8 EXPERIMENTS
The capabilities of the percept and the data quality
extensions are demonstrated using a robot localiza-
tion system. Robot localization systems are studied
in various publications and the proposed system can
be easily compared to already existing approaches as
Kalman or Bayes filters.
ICINCO 2017 - 14th International Conference on Informatics in Control, Automation and Robotics
518
8.1 Percept-based Localization
The perception network shall precisely and robustly
determine the robots pose by exploiting different
sensor types like inertial measurement units (IMU),
global positioning systems (GNSS) and wheel en-
coder data (odometry). Thereby, sensor malfunctions
and disturbances, like GNSS shadows and wheel slip-
page shall be considered.
The system composition starts bottom-up at the
hardware interface which provides data from IMU,
GNSS, and wheel encoders. In this setup, the IMU
is assumed to provide a set of acceleration, an-
gular velocity, Euler orientation and magnetic field
measurements. The GNSS provides global posit-
ing data, satellite configurations and respective signal
strengths. The odometry sensor system measures the
velocity and heading rate based on wheel encoders.
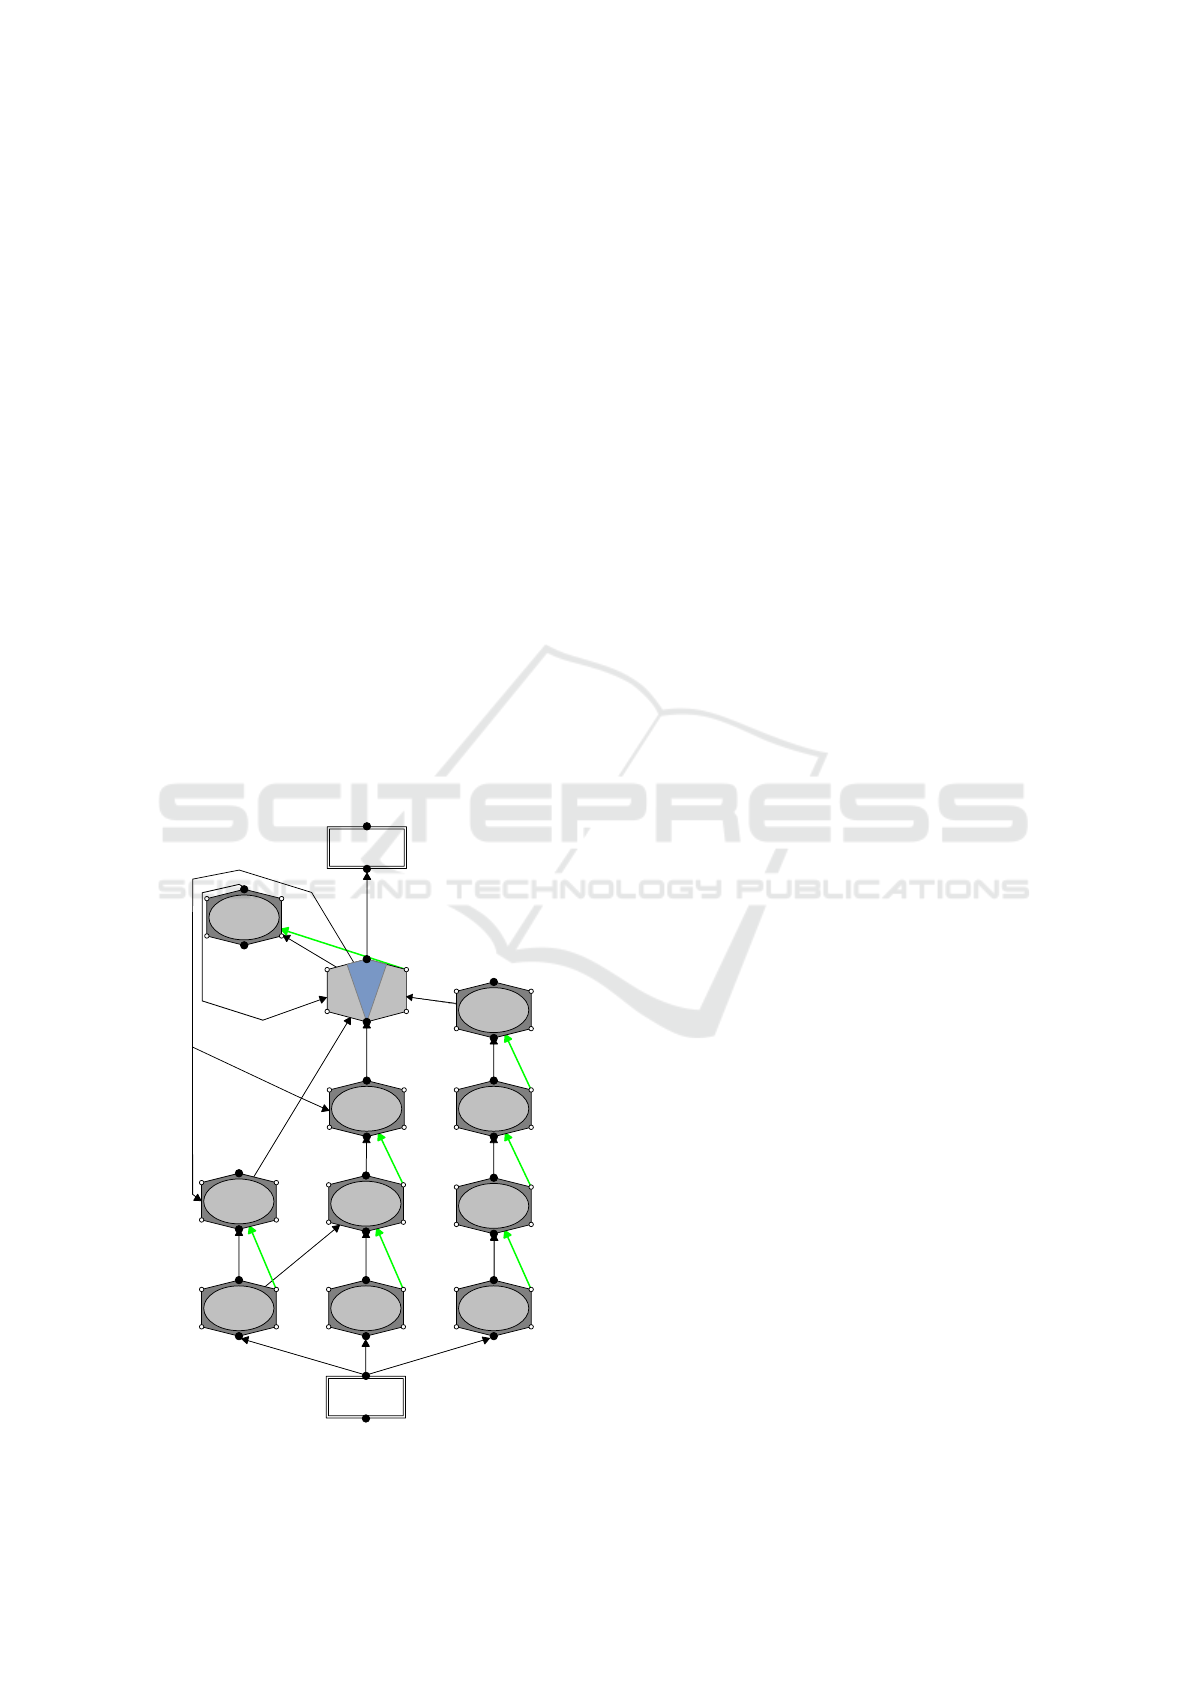
First, a sensor percept is created for each data
source to provide a gateway for data into the BBS as
shown in Figure 7. It evaluates the current data quality
by adding initial quality information derived from the
standard deviation of the system, either proposed in
the data sheet of the manufacturer or self-determined
by measurements. From this point on, each value is
decorated by a set of quality data. Additionally, the
Output
Hardware
GNSS
GNSS Pose
IMU
IMU Pose
Odometry
Odom. Pose
Pose
Predict
Satellites
Shadow
Slippage
Figure 7: Percept network for localization of a robot.
percept performs basic checks like time stamp com-
parison and signal bounds checks, which can already
degrade the quality in the case of a detected malfunc-
tion.
Next, percepts for evaluating the the current data
and degrading the quality information are succes-
sively added. Known disturbances are modeled in ad-
vance and integrated in perception modules. They de-
grade the quality if an impacting event is detected.
Thereby, the previously described mechanisms of
quality combination are applied.
The presented localization system requires no ad-
ditional checks on IMU data, only sensor percept
checks are applied. The assessing percept IMU Pose
derives a pose by integrating position accelerations
twice and incorporating the provided orientation in-
formation. In the scope of signal integration, a po-
sition quality degradation is applied every cycle to
represent the accumulation of mathematical and mea-
surement errors. The orientation qualities remain un-
affected and are passed forward.
Parallel to the IMU, the odometry sensor system
is evaluated. Here, wheel slippage is regarded by
comparing the odometry and IMU acceleration with
a predefined threshold. If the difference exceeds
the threshold, odometry quality is degraded based
on the wheel slip factors (Iagnemma et al., 2004).
Similar to IMU data handling, a pose is calculated
through single integration of the measured velocity.
The percept’s qualities—position and orientation—
continuously degrade by a factor over the traveled dis-
tance.
The GNSS perception sequence checks the satel-
lite configuration. It uses HDOP and VDOP as in-
dicators for the position uncertainty (Langley, 1999).
Additionally, possible shadowing effects are checked
using OpenStreetMap data (Fleischmann et al., 2016).
Finally, the GNSS pose can be derived.
Then, all calculated pose estimations are fused by
a weighted average component-based fusion percept.
The predictive fusion pattern is applied and a motion
prediction percept is added to the system. It consid-
ers the kinematic model of the robot and predicts the
vehicle movement based on vehicle parameters like
mass, maximum and current (angular) velocities, (an-
gular) accelerations and the movement vector.
Finally, feedback connections are added to the
IMU and odometry pose percepts to correct pose er-
rors resulting from signal degradation over time.
8.2 Localization Tests
The system was tested using the autonomous vehicle
GatorX855D (see Figure 8) of the Robotics Research
Quality-Based Behavior-Based Control for Autonomous Robots in Rough Environments
519
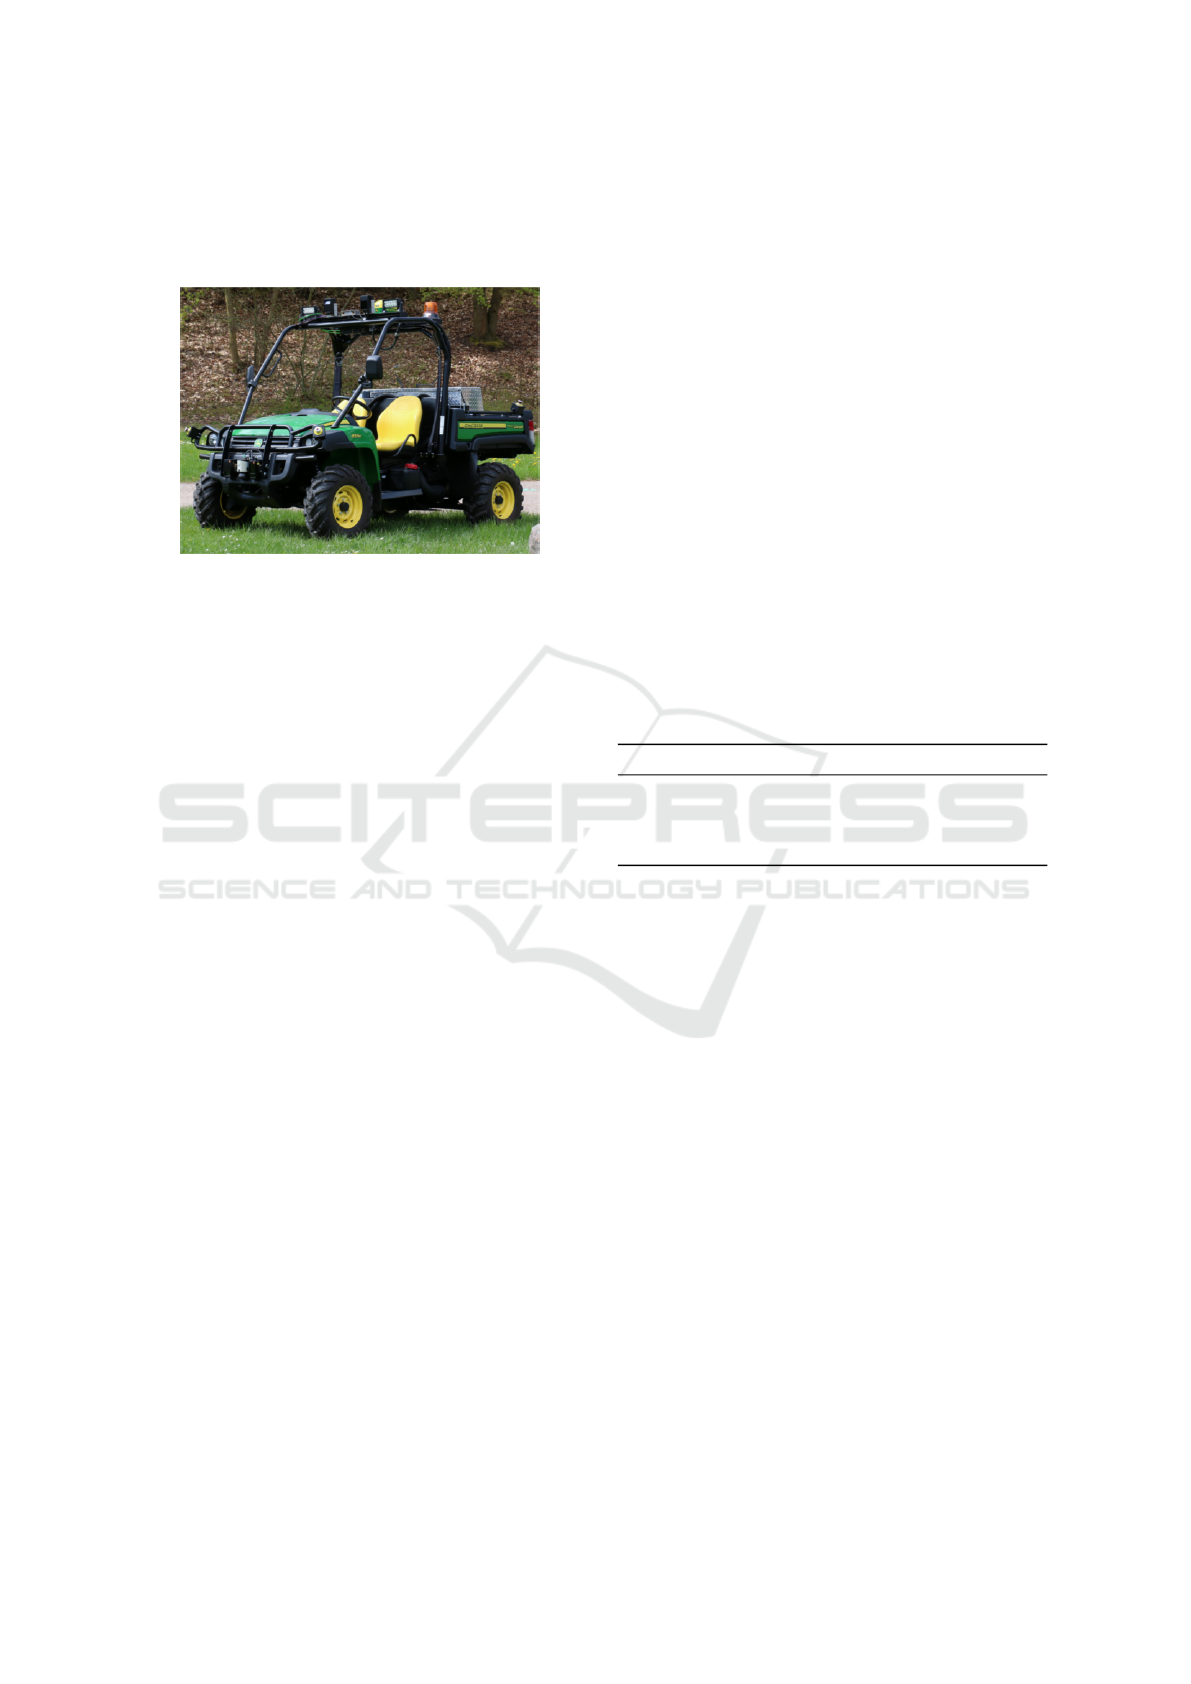
Lab of the University of Kaiserslautern in a simulated
and real-world scenario. It is a four wheel drive vehi-
cle with a 17kW diesel engine.
Figure 8: John Deere GatorX855D.
The robot contains several sensor systems. For the
presented test, the following localization sensors were
used:
GNSS U-blox NEO-7P
GNSS Starfire 3000 (RTK)
IMU Micro Strain 3DM-GX3-25
Odometry HS35 Absolute Encoder
Based on sensor data sheets, following initial qualities
are calculated
~
σ
GNSS (ublox)
= (σ
lat
,σ
lon
,σ
alt
= 1 m)
~
σ
GNSS (SF )
= (σ
lat
,σ
lon
,σ
alt
= 0.025 m)
~
σ
IMU
= (σ
Φ
,σ
ψ
= 0.06 rad,σ
ϕ
= 1.0 rad,
σ
a
x
,σ
a
y
,σ
a
z
= 0.556 776 436 ms
−2
,
σ
v
Φ
,σ
v
ψ
,σ
v
ϕ
= 0.000 035 7 rads
−1
,
σ
m
x
,σ
m
y
,σ
m
z
= 0.556 776 436 0T)
~
σ
Odometry
= (σ
v
x
= 0.004 882 813 ms
−1
,
σ
v
ϕ
= 0.1 rad s
−1
)
for the GNSS latitude σ
lat
, longitude σ
lon
, alti-
tude σ
alt
. The IMU data is denoted by roll σ
Φ
,
pitch σ
ψ
, yaw σ
ϕ
, accelerations σ
a
x
,σ
a
y
,σ
a
z
, an-
gular velocities σ
v
Φ
,σ
v
ψ
,σ
v
ϕ
and magnetic fields
σ
m
x
,σ
m
y
,σ
m
z
. Odometry system delivers the vehicle’s
velocity σ
v
x
and heading rate σ
v
ϕ
.
Implementation. The system is implemented us-
ing Finroc, a C++ and Java robot control framework,
which offers a highly modular structure, is real-time
capable, lock-free, and has zero-copy implementa-
tions (Reichardt et al., 2012).
Simulation Tests. Simulated tests are performed
with V-Rep (virtual robot experimentation platform).
V-Rep is a versatile multipurpose robot simulator
which supports C/C++, Python, Java, Lua, Matlab,
Octave and Urbi controllers (Freese et al., 2010). It
provides a C-API which exchanges data with the Fin-
roc framework. Special attention was given to cor-
rectly model sensor and vehicle characteristics as they
are specified by data sheets or were observed dur-
ing operation. The advantage of simulated testing is
the reproducibility of the tests due to the controlla-
bility of the environment. It enables a comparison of
the robot’s behavior under versatile testing conditions
with changed sensor setups or disturbances and pro-
vides an exact ground truth for evaluation.
The simulated GatorX855D followed a closed,
curved path of 870 m. First, a Starfire 3000 GNSS
with a higher precision was used. The modeled sen-
sor contained noise, delays and had lower update
rates than other sensors. Average, median and max-
imum errors and corresponding standard deviations
and variances are provided in Table 1.
Table 1: Localization errors for Starfire 3000 GNSS.
Sensor Mean Median Max. Var. Std. Dev.
IMU 0.143 m 0.139 m 0.524 m 0.004 m 0.065 m
GNSS 0.135 m 0.139 m 0.305 m 0.001 m 0.026 m
Odometry 0.349 m 0.296 m 0.835 m 0.025 m 0.158 m
Fusion 0.186 m 0.188 m 0.377 m 0.001 m 0.031 m
It can be observed that GNSS mean and maximum er-
rors are lowest which results from integration errors
of other components. The fusion output is slightly
worse than the standalone GNSS data. This is due
to low GNSS noise in the simulation scenario. Here,
the sensor is confident concerning its quality which
has a large impact on the fusion output. Nonethe-
less, GNSS, especially a Starfire system, suffers of-
ten from signal loss when the satellite configuration
is not good enough or obstacles such as buildings
are nearby. Therefore, it can be assumed that real
world results will look different and other percepts
have a larger impact. Other sensors are stabilized by
the GNSS which prevents the integration errors from
growing too large. Nonetheless, due to lower update
rates, they interpolate signal gaps.
In a second test, the GatorX855D used the cheaper
u-blox system with a larger noise instead of the high
precision Starfire GNSS. The results are given in Ta-
ble 2.
They contain larger errors than the first test.
Nonetheless, the mean error does not scale linear with
the GNSS uncertainty and the average fusion result is
much better than the outputs of the individual sensor
ICINCO 2017 - 14th International Conference on Informatics in Control, Automation and Robotics
520
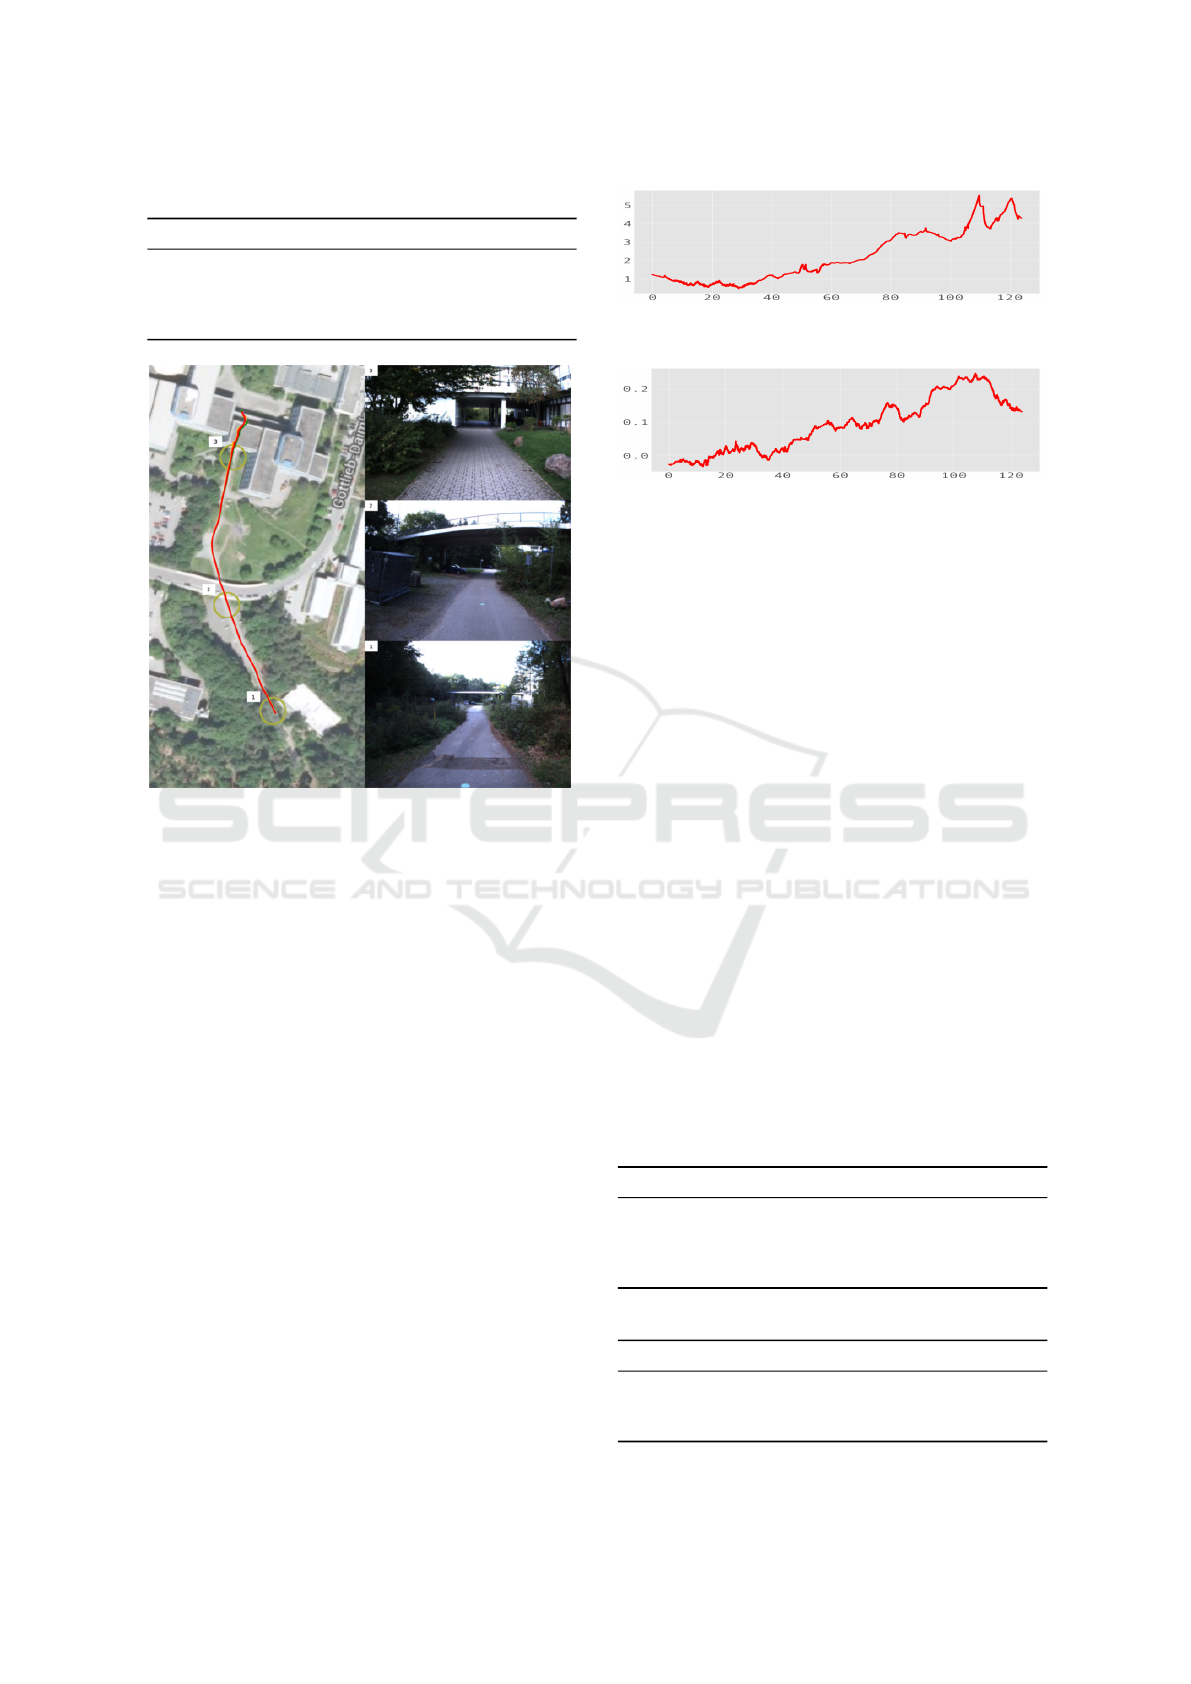
Table 2: Localization errors for u-blox GNSS.
Sensor Mean Median Max. Var. Std. Dev.
IMU 0.582 m 0.571 m 1.478 m 0.047 m 0.217 m
GNSS 0.432 m 0.388 m 1.755 m 0.061 m 0.247 m
Odometry 0.409 m 0.400 m 1.347 m 0.038 m 0.195 m
Fusion 0.344 m 0.326 m 1.200 m 0.030 m 0.174 m
Figure 9: Test environment next to the University of Kaiser-
slautern.
measurements including the GNSS. The lower qual-
ity and higher noise of the GNSS causes a higher er-
ror margin but still stabilizes the system. Other units
interpolate and compensate signal drifts and jumps
which improves the overall result.
Another observation is that high errors and low
variances indicate a systematic error of a module.
This is caused by the propagation of wrong quality
values caused by percepts assuming a better quality
than actually present. Once observed, the unknown
error source has to be identified and an appropriate
detection mechanism can be added to the network.
Real-World Tests. The localization network was
additionally tested in a real-world scenario. Testing in
simulation has several benefits, nonetheless it cannot
replace tests on a real robotic platform since only a
limited amount of environmental effects can be mod-
eled in a virtual environment. The aim is the obser-
vation of the BBS under real conditions. For this pur-
pose, the system was compared with a Carlson square
root filter (Carlson, 1973).
The GatorX855D traveled a pathway next to
the Rhineland-Palatinate forest to the University
of Kaiserslautern over a distance of approximately
Figure 10: Difference of Carlson and percept filter position.
Figure 11: Difference of Carlson and percept filter orienta-
tion.
250m. The scene and traveled path are depicted in
Figure 9 as overlay to a satellite image of the area. It
contains different ground conditions as paved areas,
sand, grass, and cobblestones. At the starting point in
the south (1), the robot is surrounded by forest. Dur-
ing navigation towards the building it passes a bridge
(2), travels next to the building and finally passes
through a tunnel (3). For localization, the u-blox
GNSS, IMU and odometry system were used. The
vehicle traveled with an appropriate speed of 2ms
−1
.
First, some general remarks are presented. Fig-
ure 10 depicts the spacial difference of both filters
over the total travel time while the yaw orientation
difference can be seen in Figure 11. Obviously, both
systems slightly diverge over time. Nonetheless, the
maximum difference between of filters is limited to
5.5m as stated in Table 3. It can be also seen that
the average difference of both systems is 2.1 m. The
systems have the largest shift when passing the tunnel
and GNSS system is affected from the building. Here,
also the orientation difference raises to about 0.22rad
while the average difference is about 0.1 rad. Notably,
the fused components of the percept filter have simi-
lar characteristics as the general fusion output. This
results from constant feedback of the BBS.
Table 3: Differences to Carlson filter.
Sensor Mean Median Max. Var. Std. Dev.
IMU 2.110 m 1.852 m 5.617 m 2.137 m 1.461 m
GNSS 2.084 m 1.917 m 7.854 m 1.692 m 1.301 m
Odometry 2.235 m 1.870 m 5.854 m 1.890 m 1.374 m
Fusion 2.219 m 1.870 m 5.549 m 1.887 m 1.374 m
Table 4: Difference of fusion inputs to result.
Sensor Mean Median Max. Var. Std. Dev.
IMU 0.325 m 0.308 m 0.848 m 0.013 m 0.117 m
GNSS 1.440 m 1.433 m 2.679 m 0.113 m 0.337 m
Odometry 0.144 m 0.069 m 1.222 m 0.036 m 0.191 m
Quality-Based Behavior-Based Control for Autonomous Robots in Rough Environments
521
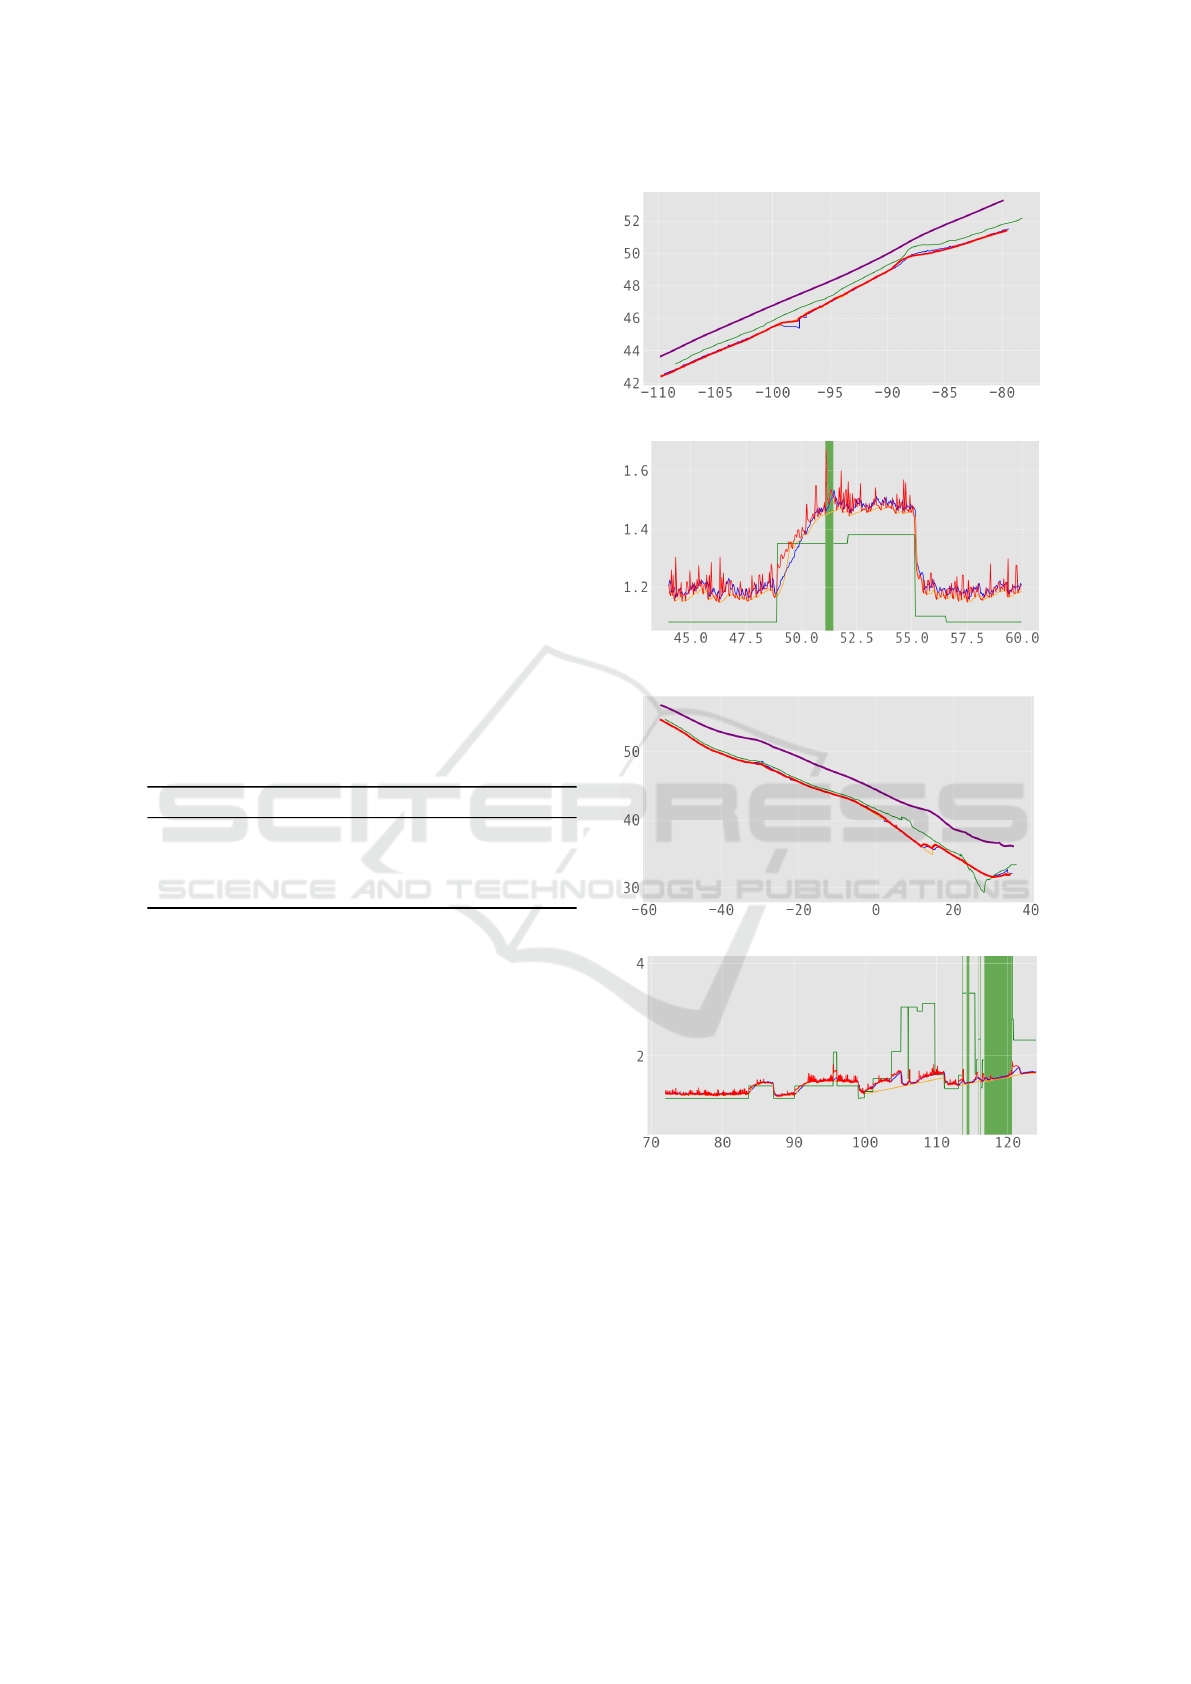
Table 4 shows the relation of fusion inputs and the
fusion result. The fusion result follows strongly the
odometry data. Thereby, the mean difference between
odometry pose to fusion output is 0.14m while the the
maximum error is limited by 1.2 m. In contrast, the
maximum GNSS error raises up to 2.6 m. The effect
can be explained by a temporarily decreased GNSS
quality. During such an occurrence, the odometry and
IMU gain a larger influence in the fusion, which stabi-
lizes the output. The other poses start to diverge from
the GNSS pose. After GNSS recovery, the fused pose
and GNSS pose merge again and the system output is
corrected which causes a pose shift.
The quality characteristics of the test can be seen
in Table 5 and are strongly related to the fusion re-
sult. The average GNSS quality could not be calcu-
lated since the system failed several times and qual-
ity value was degraded to infinity. Nonetheless, the
GNSS quality stabilizes other qualities since it does
not suffer from error integration. In general, it can be
assumed that the GNSS average quality is better than
the quality of other degrading units. This assumption
is supported by the median quality value where the
GNSS is more certain.
Table 5: Qualities of components and fusion.
Sensor Mean Median Max. Var. Std. Dev.
IMU 1.773 m 1.649 m 2.540 m 0.047 m 0.21 m
GNSS – 1.527 m ∞ m – –
Odometry 1.731 m 1.620 m 2.278 m 0.036 m 0.191 m
Fusion 1.771 m 1.646 m 2.155 m 0.052 m 0.229 m
Two areas of the testing environment are now con-
sidered in more detail. First, the filter results in area
next to the bridge (2) are discussed and interpreted.
The localization result is shown in Figure 12 while
the quality information is depicted in Figure 13.
The Carlson filter result (purple) is slightly shifted
in comparison to the percept filter (red). The fusion
percepts are shown for GNSS (green), odometry (yel-
low) and IMU (blue). Here, based on the open fil-
ter structure, detailed information of each component
and the internal states are available. Therefore, the
composition of the result can be retraced afterwards or
influenced during operation. When the GatorX855D
approaches the bridge, the GNSS quality degrades
due to a GNSS shadow which can be seen in the qual-
ity plot. Under the bridge, the system fails for a short
time span caused by satellite loss which is indicated
by the green bar. Therefore, the other percepts de-
grade over time but are corrected via the input feed-
back. While the GNSS quality is low, IMU and odom-
etry gain a larger influence in the fusion and the total
quality decreases from approximately 1.2 m to 1.5 m
Figure 12: Localization results for bridge.
Figure 13: Quality visualization for bridge.
Figure 14: Localization results for tunnel.
Figure 15: Quality visualization for tunnel.
uncertainty due to the error integration. The IMU
peak within the position plot corresponds to the in-
crease of GNSS sigma. During this time, the qual-
ity feedback is rejected and IMU and odometry work
without GNSS stabilization. Respectively, the GNSS
recovery can be seen as left shift in the position plot
when the diverging systems merge again.
Next, the tunnel area is analyzed. Figure 14 shows
the localization result of the percept filter (red) and
Carlson filter (purple). Corresponding qualities are
ICINCO 2017 - 14th International Conference on Informatics in Control, Automation and Robotics
522
depicted in Figure 15. Similar to the previous re-
sults, there is a shift between both systems while the
percept-based approach relates stronger to the GNSS
position (green). The GNSS suffers from errors when
the vehicle is close to the building or within the tun-
nel. The GNSS drifts in front and within the tun-
nel which is not considered for the localization re-
sult. During this phase, the system follows mainly
the odometry data (yellow) with support of the IMU
(blue). The fused pose shows a sudden shift during
the recovery of the GNSS system. Here, the fusion
percepts converge again, also the quality values are
adjusted. Shifts can be damped by applying an ad-
ditional low pass filter to the pose result. The fused
quality degrades stronger within the tunnel than close
to the bridge and has a deviation of approximately
1.75m.
As already mentioned, both systems (percept and
Carlson) have a position shift with respect to each
other which results from the lower trust of the Carl-
son sensor model into the GNSS system required to
handle erroneous situations as they appear in the test.
This prevents undesired shifts as shown in the tun-
nel but is therefore also weaker considered by the fil-
ter. The GNSS’s purpose is to support position deltas
of odometry and IMU and limit their integration er-
rors. In contrast, the percept filter benefits from the
high amount of non-linearity provided by the individ-
ual evaluation percepts. Nonetheless, it requires the
detection of all quality affecting events. An overcon-
fident unit can heavily disturb the overall system.
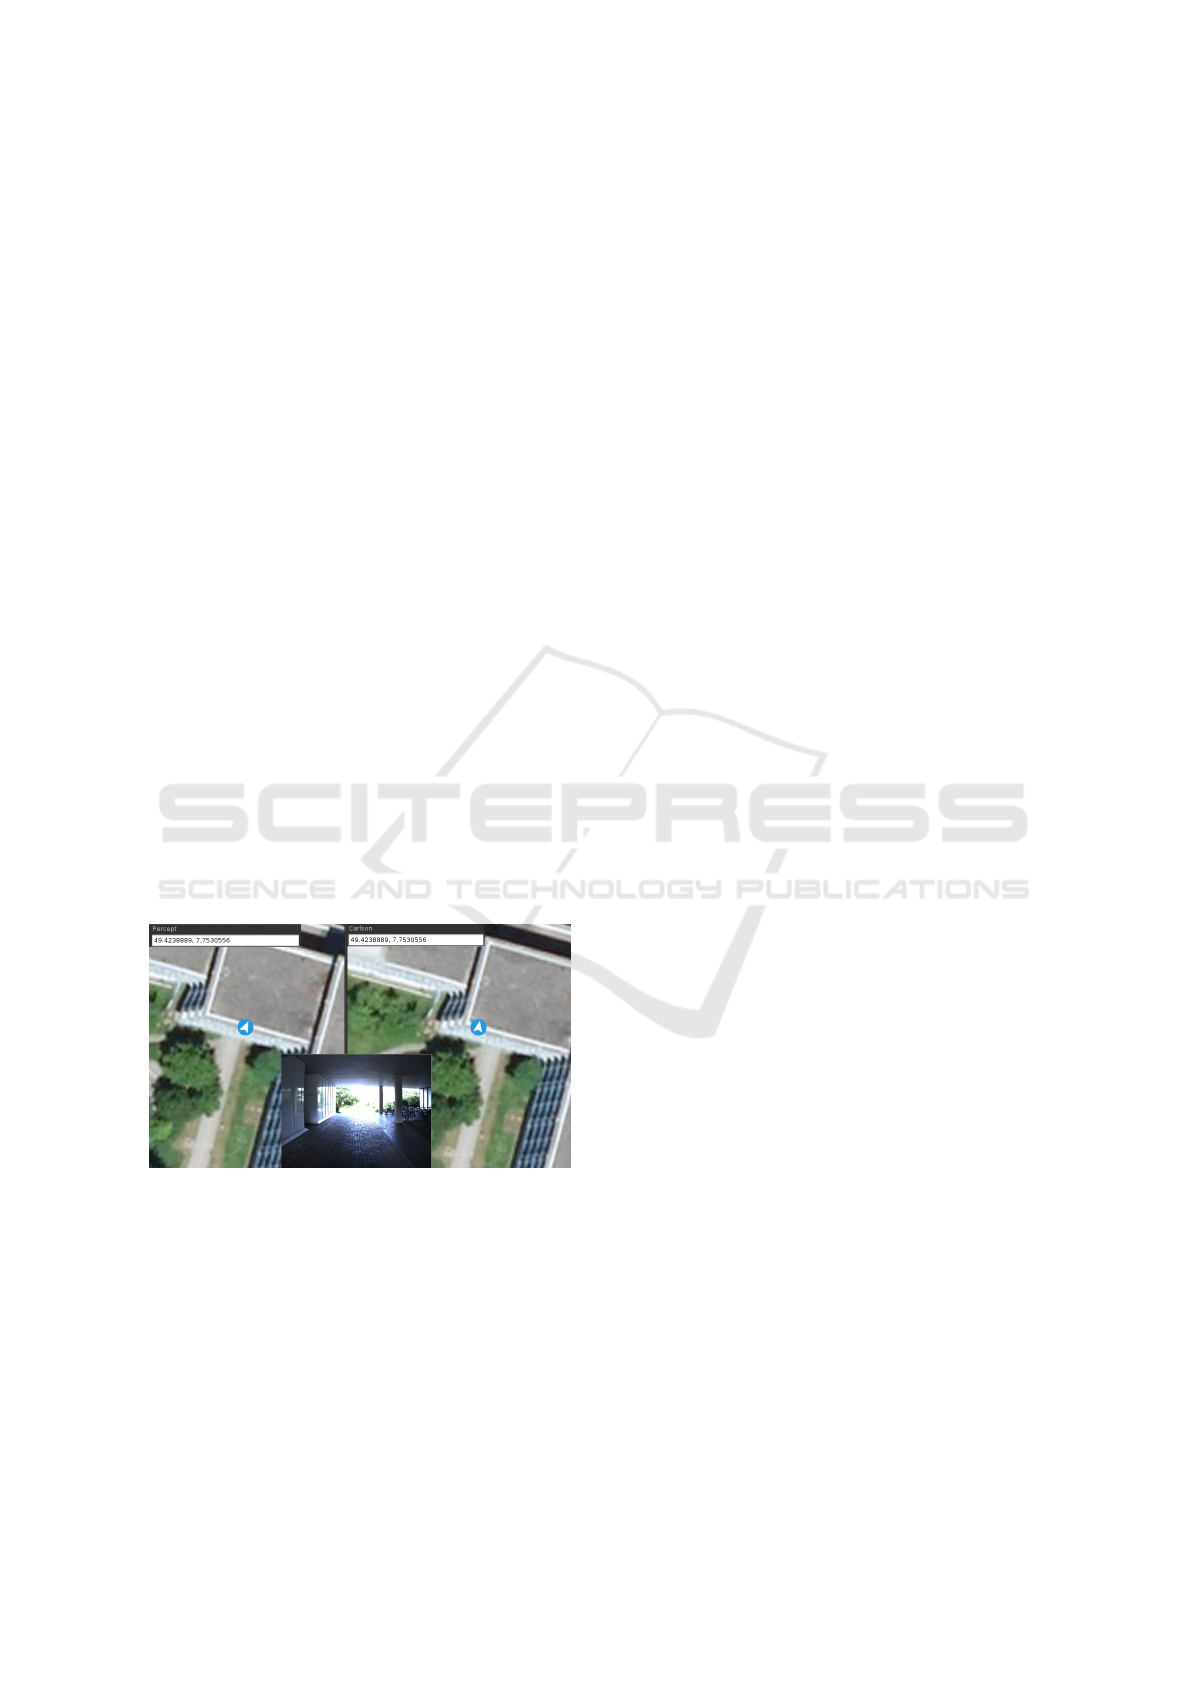
Figure 16: Comparison of Percept filter (left) and Carlson
filter (right) and corresponding robot view.
Figure 16 visualizes a situation in which the described
pose shift arises. The percept filter is depicted left
and the Carlson filter to the right while between both
images the corresponding camera view is given. The
Carlson pose is shifted too much to the left and is al-
ready located within the left hand side of the building
while the percept pose is on the right hand side of
the pathway which corresponds better to the recorded
picture.
9 CONCLUSION AND FUTURE
WORK
This paper presents a new approach for data qual-
ity based perception within behavior-based systems.
Therefore, the concept of data quality in context of
sensor and perception data was defined and corre-
sponding fusion algorithms was presented. Addition-
ally, a standard structure for advanced predictive fil-
ters based on data quality was discussed. In contrast
to state of the art filters like Kalman filters and their
extended versions, the presented approach offers an
open structure with enhanced traceability, reusability,
and extensibility. The stepwise assessment of percep-
tion data allows for a separated consideration of dif-
ferent quality influencing aspects and thus follows the
well established divide and conquer principle mak-
ing the system understandable, while the modularity
in combination with the fusion algorithms allows for
an easy extension of the perception system without
requiring any modifications to the existing percep-
tion network. Making the results of different quality
aspect evaluations explicitly available shows a great
potential for self assessment by introducing observer
modules monitoring the error sources. Additionally,
the propagation of the error source enables the control
system to act accordingly. By adhering to the iB2C
behavior interface standard in the implementation, a
seamless integration into the control system as well
as advanced bidirectional perception-control interac-
tion is supported. Thus, the perception system is able
to take advantage of knowledge about the system’s
intentions and the control system can use the quality
information to change its control strategy.
To demonstrate the capabilities of the approach,
a localization perception network was presented.
Its bottom-up development procedure was described
step-by-step starting at the robots hardware interface
up to the estimated pose. Error detection percepts
were derived for all sensors and added to the structure.
The combined results were fused and a prediction per-
cept was added according to the predictive filter pat-
tern. The localization approach was tested using the
GatorX855D robot within a simulated environment
and a real world application. Effects like data inter-
polation, perception data quality degradation, wrong
quality data and the errors of the localization result
were pointed out and discussed. In real world tests,
predefined pathways were followed incorporating dif-
ferent environmental conditions where GNSS failures
could be observed and the impact on the system an-
alyzed. In addition, a Carlson localization filter ran
in parallel and the results of both systems were com-
pared showing a slightly better performance of the
Quality-Based Behavior-Based Control for Autonomous Robots in Rough Environments
523

presented approach while offering the already men-
tioned advantages. Despite the rather restricted low
level application example, the presented approach is
versatile and can be used in arbitrary context as long
quality metrics can be defined. In contrast to com-
monly used Kalman filters, the used models are not
restricted to be linear such that also high level percep-
tion with complex non-linear models is supported.
In future works, the quality concept will be ex-
tended to other perception processes. The huge range
of perception algorithms offers various applications
of the new perception network. Thereby, the impact
of quality metrics to the different algorithms will be
examined and standard based operations will be de-
fined. Furthermore, the concept should be used for
robot control. Different applications of the quality
data like influence on the robots navigation will be in-
vestigated. For example, the robot could navigate in a
more cautious way (keeping a larger distance to obsta-
cles or reducing speed) if there are uncertain data de-
tected. Another, topic is the usage of behavior meta-
signals as virtual sensors. By incorporating knowl-
edge about the systems intentions into the perception
system, more sophisticated cross evaluations could be
performed and the overall data quality raised.
REFERENCES
Arkin, R. (1998). Behavior-Based Robotics. MIT Press,
Cambridge, MA, USA.
Bader, K., Lussier, B., and Schn, W. (2017). A fault toler-
ant architecture for data fusion: A real application of
kalman filters for mobile robot localization. Robotics
and Autonomous Systems, 88:11 – 23.
Berns, K., Kuhnert, K.-D., and Armbrust, C. (2011). Off-
road robotics - an overview. KI - K
¨
unstliche Intelli-
genz, 25(2):109–116.
Brooks, R. A. (1986). A robust layered control system for a
mobile robot. IEEE Journal of Robotics and Automa-
tion, 1:14–23.
Carlson, N. A. (1973). Fast triangular formulation of the
square root filter. AIAA journal, 11(9):1259–1265.
Fleischmann, P., Pfister, T., Oswald, M., and Berns, K.
(2016). Using openstreetmap for autonomous mobile
robot navigation. In Proceedings of the 14th Interna-
tional Conference on Intelligent Autonomous Systems
(IAS-14), Shanghai, China. Best Conference Paper
Award - Final List.
Freese, M., Singh, S., Ozaki, F., and Matsuhira, N. (2010).
Virtual robot experimentation platform v-rep: A ver-
satile 3d robot simulator. In Ando, N., Balakirsky,
S., Hemker, T., Reggiani, M., and von Stryk, O., edi-
tors, International Conference on Simulation, Model-
ing and Programming for Autonomous Robots (SIM-
PAR), volume 6472 of Lecture Notes in Computer Sci-
ence, pages 51–62. Springer.
Iagnemma, K., Kang, S., Shibly, H., and Dubowsky,
S. (2004). Online terrain parameter estimation for
wheeled mobile robots with application to planetary
rovers. IEEE Transactions on Robotics, 20(5):921–
927.
Jones, J. (2004). Robot Programming: A practical guide to
Behavior-Based Robotics. McGraw-Hill.
Kalman, R. E. (1960). A new approach to linear filtering
and prediction problems. Journal of Basic Engineer-
ing, 82:35–45.
Khaleghi, B., Khamis, A., Karray, F. O., and Razavi, S. N.
(2013). Multisensor data fusion: A review of the state-
of-the-art. Information Fusion, 14(1):28 – 44.
Langley, R. B. (1999). Dilution of precision. GPS World,
10(1):52–59.
Lenser, S., Bruce, J., and Veloso, M. (2002). A Modular Hi-
erarchical Behavior-Based Architecture, pages 423–
428. Springer Berlin Heidelberg, Berlin, Heidelberg.
Mantz, F. and Jonker, P. (2007). Behavior-based perception
for soccer robots. In Vision Systems: Applications,
chapter 5, pages 147–164. I-Tech Education and Pub-
lishing.
Matari
´
c, M. J. (1997). Behavior-based control: examples
from navigation, learning, and group behavior. Jour-
nal of Experimental and Theoretical Artificial Intelli-
gence, 9(2):323–336.
Proetzsch, M. (2010). Development Process for Complex
Behavior-Based Robot Control Systems. PhD thesis,
Robotics Research Lab, University of Kaiserslautern,
M
¨
unchen, Germany.
Reichardt, M., F
¨
ohst, T., and Berns, K. (2012). Introducing
finroc: A convenient real-time framework for robotics
based on a systematic design approach. Technical
report, Robotics Research Lab, Department of Com-
puter Science, University of Kaiserslautern, Kaiser-
slautern, Germany.
Sch
¨
afer, B. H. (2011). Robot Control Design Schemata and
their Applications in Off-road Robotics. PhD thesis,
Robotics Research Lab, University of Kaiserslautern,
M
¨
unchen, Germany.
Simanek, J., Reinstein, M., and Kubelka, V. (2015). Evalu-
ation of the ekf-based estimation architectures for data
fusion in mobile robots. IEEE/ASME Transactions on
Mechatronics, 20(2):985–990.
Thrun, S., Burgard, W., and Fox, D. (2006). Probabilistic
Robotics. MIT Press, Cambridge, MA, USA.
ICINCO 2017 - 14th International Conference on Informatics in Control, Automation and Robotics
524
