
Information Flows at OS Level Unmask Sophisticated Android Malware
Val
´
erie Viet Triem Tong
1
, Aur
´
elien Trulla
1
, Mourad Leslous
1
and Jean-Franc¸ois Lalande
2
1
EPI CIDRE, CentraleSupelec, Inria, Universit
´
e de Rennes 1, CNRS, IRISA UMR 6074, F-35065 Rennes, France
2
INSA Centre Val de Loire, Univ. Orl
´
eans, LIFO EA 4022, F-18020 Bourges, France
Keywords:
Android, Malware, System Flow Graph.
Abstract:
The detection of new Android malware is far from being a relaxing job. Indeed, each day new Android
malware appear in the market and it remains difficult to quickly identify them. Unfortunately users still pay
the lack of real efficient tools able to detect zero day malware that have no known signature. The difficulty is
that most of the existing approaches rely on static analysis coupled with the ability of malware to hide their
malicious code. Thus, we believe that it should be easier to study what malware do instead of what they
contain. In this article, we propose to unmask Android malware hidden among benign applications using the
observed information flows at the OS level. For achieving such a goal, we introduce a simple characterization
of all the accountable information flows of a standard benign application. With such a model for benign
apps, we lead some experiments evidencing that malware present some deviations from the expected normal
behavior. Experiments show that our model recognizes most of the 3206 tested benign applications and spots
most of the tested sophisticated malware (ransomware, rootkits, bootkit).
1 INTRODUCTION
Once Android has became the most popular mobile
platform, it has also became the mobile operating sys-
tem most heavily targeted by malware. The main goal
of these malware is to make money thanks to the user
and unbeknownst to the user. In the same time, app
store providers try to prevent malicious apps from en-
tering official market or to remove them once entered.
For that purpose, these providers can resort to auto-
mated security analysis or manual reviews of security
experts. The automated approaches are mainly based
on static program analysis that tries to statically detect
if applications are responsible of sending messages
to premium services, or exfiltrating personal private
data.
In 2012, Zhou et al. claim that current market-
places are functional and relatively healthy since they
have discovered less than 0.5% of infection rate (Zhou
et al., 2012). We believe that this result has two dif-
ferent interpretations: either the tools used to keep
the markets clean are very efficient, or malware are
more clever and succeed to evade detection engines.
A deeper study of this work reveals that existing tools
are efficient to detect only simple malware that mainly
try to send text messages to premium phone numbers.
Moreover, the range of more sophisticated malware is
not included in the study of Zhou et al. For in-
stance, they do not study ransomware, the malware
that requests an amount of money from the user while
promising to release a hijacked resource in exchange.
In the same way, malware that erase user’s data from
the device and turn it into part of a hacker botnet, as
done by the malware Mazar
1
, are not included in the
study. We believe that any malware will succeed to
defeat classical program analysis by relying on obfus-
cation, dynamic code loading or ciphering. We claim
here that trying to clean the market by resorting only
to classical static program analysis is a lost cause.
In this paper, we propose a different approach that
aims to explore first how a benign Android appli-
cation and its created processes should interact with
other elements of the operating system. The original-
ity of this approach is that we do not care about the na-
ture of the executed code but we focus on how appli-
cations disseminate information in the operating sys-
tem during one execution. More precisely, we study
which operations a non-malicious application is able
to perform: we translate these operations in terms
of information flows between files, sockets and pro-
cesses of the operating system. We explain each infor-
mation flow and this way, we build a generic graph of
1
https://heimdalsecurity.com/blog/security-alert-mazar-
bot-active-attacks-android-malware/
578
Tong, V., Trulla, A., Leslous, M. and Lalande, J-F.
Information Flows at OS Level Unmask Sophisticated Android Malware.
DOI: 10.5220/0006476705780585
In Proceedings of the 14th International Joint Conference on e-Business and Telecommunications (ICETE 2017) - Volume 4: SECRYPT, pages 578-585
ISBN: 978-989-758-259-2
Copyright © 2017 by SCITEPRESS – Science and Technology Publications, Lda. All rights reserved

all allowed information flows in the operating system
due to the execution of an Android application. We
put this generic graph to the proof: we executed more
than 3206 applications attested as benign by anti-virus
software used by Virustotal
2
. We verify that these be-
nign executions are conformed to the expected normal
pattern.
Finally, we claim that an attack of a sophisticated
malware induces behaviors that deviate from the le-
gitimate one, from the operating system point of view.
To evaluate the effectiveness of our approach, we led
experiments on nine sophisticated malware such as
rootkits, bootkits, and ransomware extracted from the
Kharon dataset (Kiss et al., 2016). We show that these
experiments easily spot malware since they exhibit
graphs out of the expected pattern.
In the rest of this article, after reviewing the state
of the art in Section 2, we develop this idea and we
introduce in Section 3 how an Android application in-
teracts with the system environment. We represent all
existing information flows between files, sockets and
processes in the Android system generated by the ex-
ecuted application under review. We also show, using
two examples, the difference between a benign ap-
plication and a malware. Then, Section 4 introduces
formally the characterization model of a normal ap-
plication execution. Finally, Section 5 verifies the ac-
curacy of the approach on a dataset of 3206 goodware
and Section 6 evaluates the efficiency of the approach
on a collection of malware.
2 STATE OF THE ART
To build reliable detection solutions, researchers have
worked on collecting relevant features characterizing
malware. Such features can be collected statically or
dynamically. Most of the proposed frameworks use
static analysis in order to build signature detection
tools or to help dynamic analysis. Works that dy-
namically analyze applications use dynamic features
to build HIDS or NIDS algorithms.
One of the first papers that worked on dynamic
Android malware detection have been proposed by
Schmidt et al. in 2008 (Schmidt et al., 2008). They
implemented a live monitoring solution that collects
system observables such as filesystem access, net-
work events or Java features of the application. This
first proposal has been improved and exploited in
AASandBox (Blasing et al., 2010), which provides
a full environment for executing a malware and ex-
tracting both kernel events (such as syscalls) and Java
2
https://www.virustotal.com
events such as Runtime.Exec(). Advanced techniques
characterizing calls at thread level give good classifi-
cation results (Lin et al., 2013).
Researchers have investigated a wide set of pos-
sible features to extract (Wu et al., 2012; Shabtai
et al., 2012; Afonso et al., 2014). In one of these first
works (Shabtai et al., 2012), authors have proposed
Andromaly, a framework that collects CPU and en-
ergy consumption, network statistics and the number
of running processes. Then, a lot of classification al-
gorithms have been investigated and compared with
different parameters such as the setup of the training
set of applications or the impact of the use of dif-
ferent devices. In 2014, Neuner et al. proposed a
comparison of most known platforms (Neuner et al.,
2014) in order to show the features used by dynamic
analysis tools. All the proposals use very similar fea-
tures. Many papers use tainting techniques (Enck
et al., 2010), similarly to this paper, but they mainly
use it to monitor access to private data.
Without a real user in charge of running applica-
tions manually, it is a challenge to execute correctly
a malware and observe it. Recent approaches have
proposed solutions to target the suspicious code and
then to stimulate the executed malware. In (Zheng
et al., 2012), a static analysis of the bytecode helps to
trigger automatically the applications’ UI. In (Abra-
ham et al., 2015), authors proposed to modify the ap-
plication control flow to reach the suspicious code.
In (Wong and Lie, 2016), authors compute the set
of inputs that trigger the suspicious code using static
analysis. All these techniques help to automatize the
execution of Android malware. Combined with taint-
ing techniques, information flows generated from an
execution can be obtained automatically for a collec-
tion of malware.
Compared to previous approaches, this paper is
the first to use information flow graphs to build an An-
droid malware detection technique. We believe that a
simple formalism of legitimate information flows can
easily spot sophisticated malware that would reveal
their behavior at the OS level. In the next section,
we describe more formally the graph representation
of these flows before moving in Section 4 to the char-
acterization of flows of a benign application.
3 OS INTERACTIONS OF APPS
On Android operating systems, third party applica-
tions can be downloaded from official and non official
markets, or manually installed. All of them are in-
stalled on the device by deploying an archive with the
extension .apk. The installation process first consists
Information Flows at OS Level Unmask Sophisticated Android Malware
579

in decompressing this archive. Usually, it contains the
compiled code of the application (classes.dex) and
a file AndroidManifest.xml that describes the appli-
cation (activities, permissions, . . . ). Lastly, an .apk
archive also contains all resources (i.e. images, .xml
config files, databases) needed by the application.
To build our detection methodology, we need to
describe how an Android application contaminates
the operating system during its execution. In par-
ticular, we do not care about the nature of the ex-
ecuted code but we are more interested to discover
which files have been accessed, which processes were
created, which IP addresses the application has con-
tacted, and recursively how these contaminated ob-
jects have themselves influenced the operating sys-
tem. For this purpose, we propose to capture all the
information flows inside the operating system caused
by the execution of an application. We represent these
information flows on a particular graph called System
Flow Graph (or SFG for short) (Andriatsimandefitra
and Viet Triem Tong, 2014). Examples of SFG issued
from malware observations and used latter in this pa-
per can be found in the Kharon dataset (Kiss et al.,
2016) available at kharon.gforge.inria.fr/dataset. For-
mally, a SFG is a pair (V , E) where V is a set of
vertices and E is a set of edges. A vertex v in V de-
notes objects that contain information in the operating
system as files, sockets or processes. An edge be-
tween two vertices denotes an information flow from
a source to a destination.
In practice, we construct these SFGs using An-
droBlare, an information flow monitor at the operat-
ing system level combined with GroddDroid (Abra-
ham et al., 2015), a framework to automatically exe-
cute applications and force suspicious code execution
when needed. AndroBlare attaches a first mark to a
particular content of an information container. Af-
terward, each time a marked object accesses a non
marked one, the mark is propagated to the non marked
object. The mark transits in the system through ex-
tended attributes of files and on processes. Each ob-
served flow is logged and the whole log is transformed
into a SFG. GroddDroid (Abraham et al., 2015) au-
tomatizes the execution of applications by stimulating
the graphical interface and monitors the execution.
In the remainder of this paper, the presented
graphs are computed from observing a single execu-
tion of an Android application where only one piece
of information is initially marked: the APK file that
has been downloaded on the device. Indeed, the
archive is the original information that we want to
monitor the dissemination.
Figure 1 gives an example of an SFG that results
from monitoring an Android application. Files are
represented by (gray) rounded boxes, processes are
represented by (green) ellipses, and sockets are rep-
resented by (blue) stars. This application is a virtual
piano installed from the initial node, the orange one
whose name is com.als.grandpiano.free.apk.
We have analyzed it on VirusTotal and none of
the 54 anti-viruses have detected a malware in
it. The graph tells us which files and pro-
cesses are modified or influenced by the archive
com.als.grandpiano.free.apk. In particular we
can focus on the process named grandpiano.free
that executes the application. The neighborhood of
this node is the direct resources of the application. In
our figure, we learn that the application uses database
files (.db), sounds files (.sf2) and a compiled C li-
brary (.so). The graph also shows a particular pro-
cess system server, colored in yellow, which inter-
acts with many other processes. System server is
a particular process used to deliver Android services
to other applications. This process firstly verifies if
the application has the right permission to access the
requested service and secondly accesses the service.
In a benign application’s graph, such as the vir-
tual piano’s one, interactions with the objects of the
Android operating system can be explained: an appli-
cation is allowed to create files to make persistent data
and can request services through system server. On
the contrary, malware graphs present interactions that
cannot be explained easily and correspond to abnor-
mal behaviors. For example, the graph of the Sim-
pleLocker malware (Kiss et al., 2016) (malware that
encrypts the user’s files and exacts a ransom from
him), which is depicted in Figure 2, presents inter-
esting variations. Similarly to the graph of virtual
piano, the graph presents the same normal pattern:
the original APK file in orange, the process executing
the application that creates files in its neighborhood
and the requests to services through system server.
Additionally, a precise observation shows that the ap-
plication has created an encrypted version of all me-
dia files belonging to the users (.enc files). Never-
theless, we consider these interactions as normal be-
cause these file nodes are in the neighborhood of the
rg.simplelocker process. We also observed a pro-
cess named Tor and some interactions between it and
remote IP addresses. Tor was not installed on the
device before the execution of SimpleLocker which
means that the application has installed it. This part
of the graph has no explanation for a non malicious
application: a normal one should not dialog with a
remote server through Tor. We lead some extra re-
search on this sample: these IP addresses were Tor
relay nodes and the malware was anonymously com-
municating with the attacker in order to verify that the
SECRYPT 2017 - 14th International Conference on Security and Cryptography
580
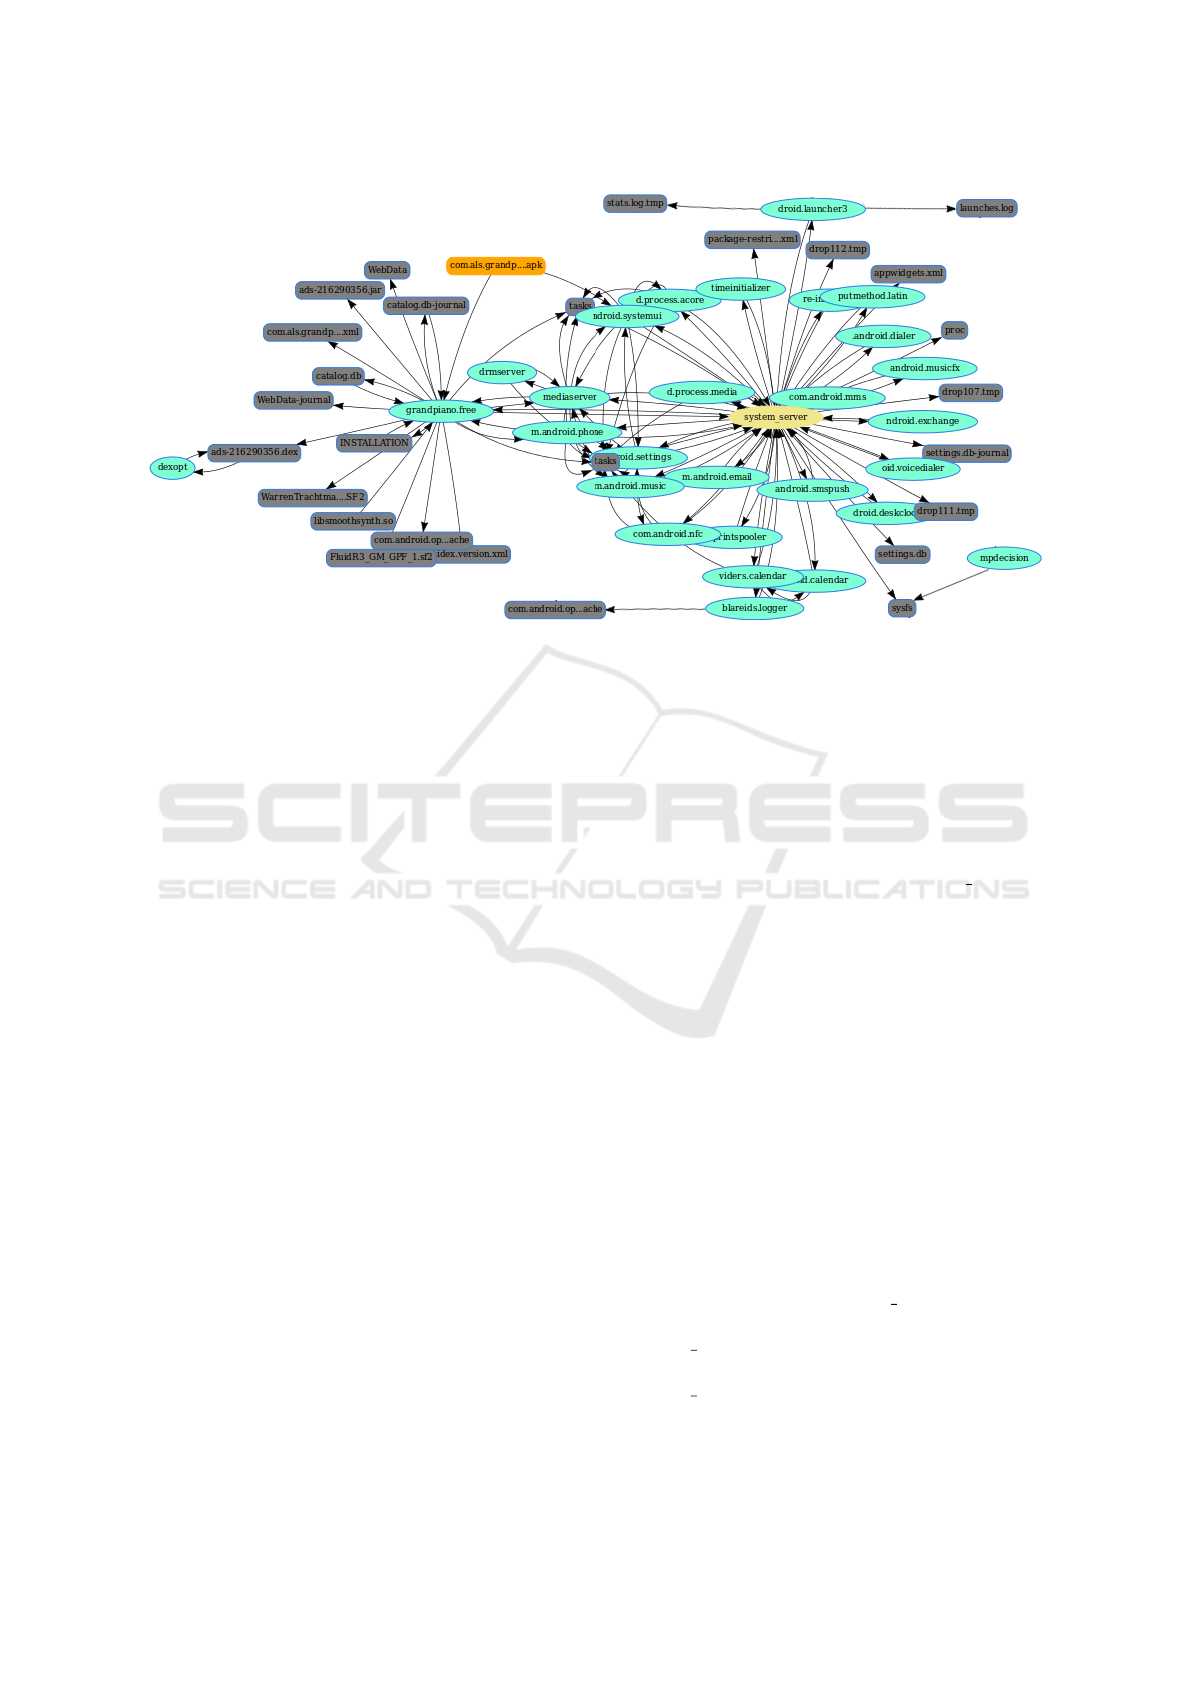
Figure 1: System Flow Graph of virtual piano application.
user has paid the ransom before deciphering his files.
The question explored in this article is thus the
following: can we compute a set of characteristics
over system flow graphs that allows to distinguish be-
nign Android applications from malicious ones? In-
tuitively, the expected answer is Yes, we can. We will
show in the following that benign applications always
exhibit graphs where only expected and identified pat-
terns appear, and malicious applications exhibit addi-
tional isolated patterns.
4 NORMAL BEHAVIORS
In this section, we formally define what is an expected
normal behavior of an observed SFG graph. Such a
”normal behavior” describes the expected interactions
between the application and the operating system dur-
ing its execution.
Since we focus on interactions between processes
and sockets or files, we have to define the behavior of
an Android application from this point of view. For
that purpose we introduce the following terminology.
An information flow from an object A towards an ob-
ject B means that the content of B has been influenced
by the content of A. A flow from A to B is denoted
by A → B. Moreover, when we introduce the nota-
tion A →
1
B to denote that an information flow from
A to B that is mandatory. In the same way the notation
A →
0
B indicates that a flow from A to B may exist.
Lastly, we write X →
0...?
Y to denote that information
flows from an object of type X towards an object of
type Y may appear one or several times.
We also introduce a terminology for objects. As
we install a malware using an .apk archive (its code
and resources), this archive is the unique source
of information that we want to monitor, we intro-
duce the notation Apk for this file. Then, the par-
ticular object that corresponds to the process exe-
cuting the code of the application is denoted App.
Objects of the Android operating system are de-
noted by their system name (as system server,
android.browser, media server, ...). Lastly,
file (resp. process, socket) is used to denote a
variable object of type file (resp. process, socket).
Using this terminology, we are now able to
formalize an application behavior in terms of in-
formation flows. To do this, we turn back to the
Android permissions list. We translate each permis-
sion in terms of information flows involved in the
operating system. For instance, to access the device
camera, an application must declare the CAMERA
permission in its manifest. To use it, the developer
can use the android.hardware.camera2 package
that provides an interface to individual cameras
connected to the Android device. The execution
of this package’s methods implies a verification of
the permissions granted to the application and the
effective camera access. This access is indeed relayed
by the particular process system server. Such an
access will induced information flows App →
system server → android.camera2
for the access and android.camera2 →
system server → App due to the data sent by
the camera. This short example illustrates how we
have studied all possible operations of an application
Information Flows at OS Level Unmask Sophisticated Android Malware
581
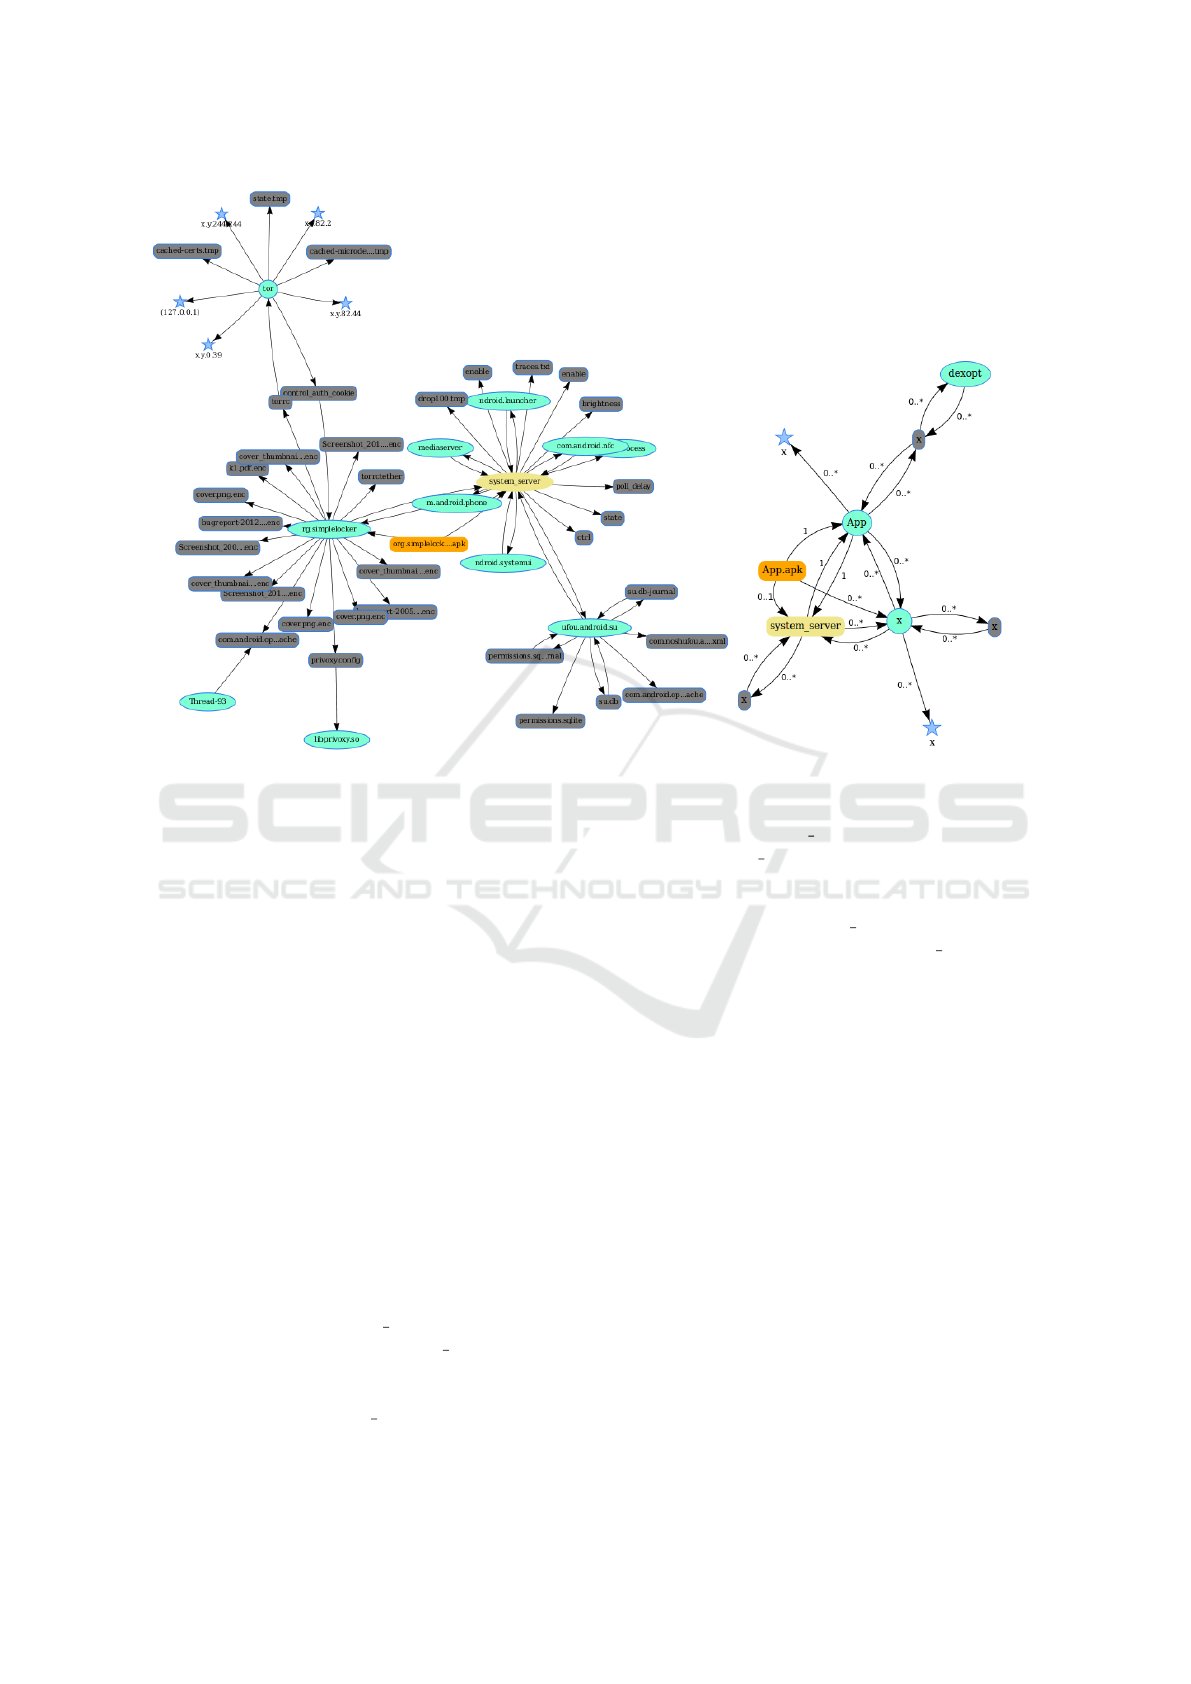
Figure 2: System Flow Graph of the malware SimpleLocker. Figure 3: Generic pattern of a benign
application.
and how we have translated these operations in terms
of information flows. Thus, we describe the expected
behavior of an application in five main parts.
1) The process running the application is issued
from the archive: in terms of information flow it
simply means that any information flow on the form
Apk →
1
App is accountable and mandatory. Other-
wise, it means that running the application has failed.
2) Interactions with own resources: each applica-
tion is allowed to make some computation by itself
and to use the resources contained in its own archive.
In terms of information flow it means that the process
running the application (the App object) can be a des-
tination of flows: file →
0...?
App. Dually to these
operations, the process running the application can be
a source of flows towards its own external resources
(such as configuration, sound and scores files). In
terms of information flows, it means that flows of the
form App →
0...?
file are allowed and accountable.
All these flows are allowed but not mandatory.
3) Requests to Android services: informa-
tion flows between system server and App are
considered normal. As system server dele-
gates service requests to other processes (for ex-
ample for audio, contacts, etc.), any flow that
comes out from system server is thus legit-
imate. It means that information flows of the
form App → system server →
0...?
file and
App → system server →
0...?
process →
0...?
file are allowed and accountable: these flows hap-
pen because of a service request. The reciprocal
flows file →
0...?
system server → App and
file →
0...?
process →
0...?
system server →
App ) are allowed and accountable. Flows of these
forms are allowed but not mandatory.
4) Internet or network connection: Android appli-
cations are allowed to request access to remote servers
if they have the right permission. They can also del-
egate this access to the web browser. This induce
flows of the form App →
0...?
socket, App →
0...?
android.browser →
0...?
socket.
5) Dynamic code loading: an Android appli-
cation can use a class loader that loads classes
from .jar and .apk files. Tod o so, the pro-
cess dexopt optimizes the archive and deploys the
dex output in writable directories. This dynamic
code loading is represented by the following flows:
App →
0...?
file →
0...?
dexopt and file →
0...?
dexopt →
0...?
App. These flows are allowed, ac-
countable but not mandatory. For example, on the left
side of Figure 1, we can observe that the application
has created a java archive ads-216290356.jar then
translated in ads-216290356.dex by dexopt.
Table 1 sums up this study by giving a generic ex-
SECRYPT 2017 - 14th International Conference on Security and Cryptography
582

Table 1: Allowed and accountable information flows.
GENERIC EXPRESSION OF ALLOWED INFORMATION FLOWS Mandatory
Application installation
Apk → App yes
Interaction with own resources
file →
0...?
App no
App →
0...?
files no
Services requests
App → system server →
0...?
file no
file →
0...?
process →
0...?
system server → App no
Services responses
file → system server →
0...?
App no
App → system server →
0...?
process →
0...?
file no
Remote connections
App →
0...?
socket no
App →
0...?
android.browser →
0...?
socket no
Package installation
App →
0...?
file →
0...?
dexopt no
file →
0...?
dexopt →
0...?
App no
pression of all allowed and accountable flows of an
Android application. In the same way, Figure 3 gives
a representation of a generic benign SFG. We claim
here that any information flow appearing in the SFG
of a benign application should be in one of the cate-
gories listed above. Other information flows have no
explanation and are symptoms of malicious activities.
5 GOODWARE EXPERIMENTS
This section aims to verify that the previous generic
representation succeeds effectively to capture normal
behaviors. For that purpose we lead experiments on
a collection of 3206 Android applications from the
Google Play store.
First, we submitted our 3206 applications to
VirusTotal to confirm that none of them are malware
or even suspicious. Then, we automatically execute
these applications on a real smartphone using Grod-
dDroid (Abraham et al., 2015). More precisely, Grod-
dDroid triggers elements of the user interface, like
button and combo box, and discovers the different
activities. Before every application’s analysis we re-
store a clean image of the device. Each execution is
monitored and represented by one system flow graph.
This part of the experiments has required more than
11 days of computation and generated 3206 graphs.
For each of these graphs, we lead the following
experiments: for each edge from A to B in the appli-
Table 2: Experiments on goodware behaviors.
MIN AVG
90TH 95th MAX
%ILE %ile
INITIAL SFG OF AN ANDROID APPLICATION
NB of nodes in
17 106 123 127 538
the initial SFG
NB of edges in
75 251 288 298 661
the initial SFG
SUB-SFG NOT INCLUDED IN THE EXPECTED BEHAVIOR
NB of nodes out
0 1 2 2 46the expected
normal behavior
NB of edges out
0 0.4 0 0.2 76the expected
normal behavior
Table 3: Experiments on malware behaviors.
MIN AVG
90TH 95th MAX
%ILE %ile
INITIAL SFG OF AN ANDROID APPLICATION
NB of nodes in
68 172 352 373 387
the initial SFG
NB of edges in
93 240 489 512 539
the initial SFG
SUB-SFG NOT INCLUDED IN THE EXPECTED BEHAVIOR
NB of nodes out
1 69 223 239 263the expected
normal behavior
NB of edges out
0 123 351 407 498the expected
normal behavior
cation’s graph, if A → B does not match any generic
edge in the generic form of a normal behavior then
this edge is considered out of the normal behavior. We
claim that if our generic form of a normal behavior is
complete then we would have almost no edges out of
the normal behavior. We obtained that 95% of these
goodware have less than one edge out of the expected
normal behavior (95th percentile value) which repre-
sented less than 0.2 percent of edges in their initial
graph. We have also observed extreme values where
46 nodes and 76 edges are out of the expected behav-
ior. A manual review of this extreme case reveals that
the graph was ill-formed because of an error in the
monitoring. Table 2 details all these results.
6 CAN MALWARE MIMIC
BENIGN APPS?
Before concluding, we study the efficiency of our ap-
proach to detect sophisticated malware.
As stated before we do not care about simple mal-
ware that earn money by calling or sending text mes-
sages to premium numbers. Moreover, malware that
simply send text messages or call premium numbers
Information Flows at OS Level Unmask Sophisticated Android Malware
583
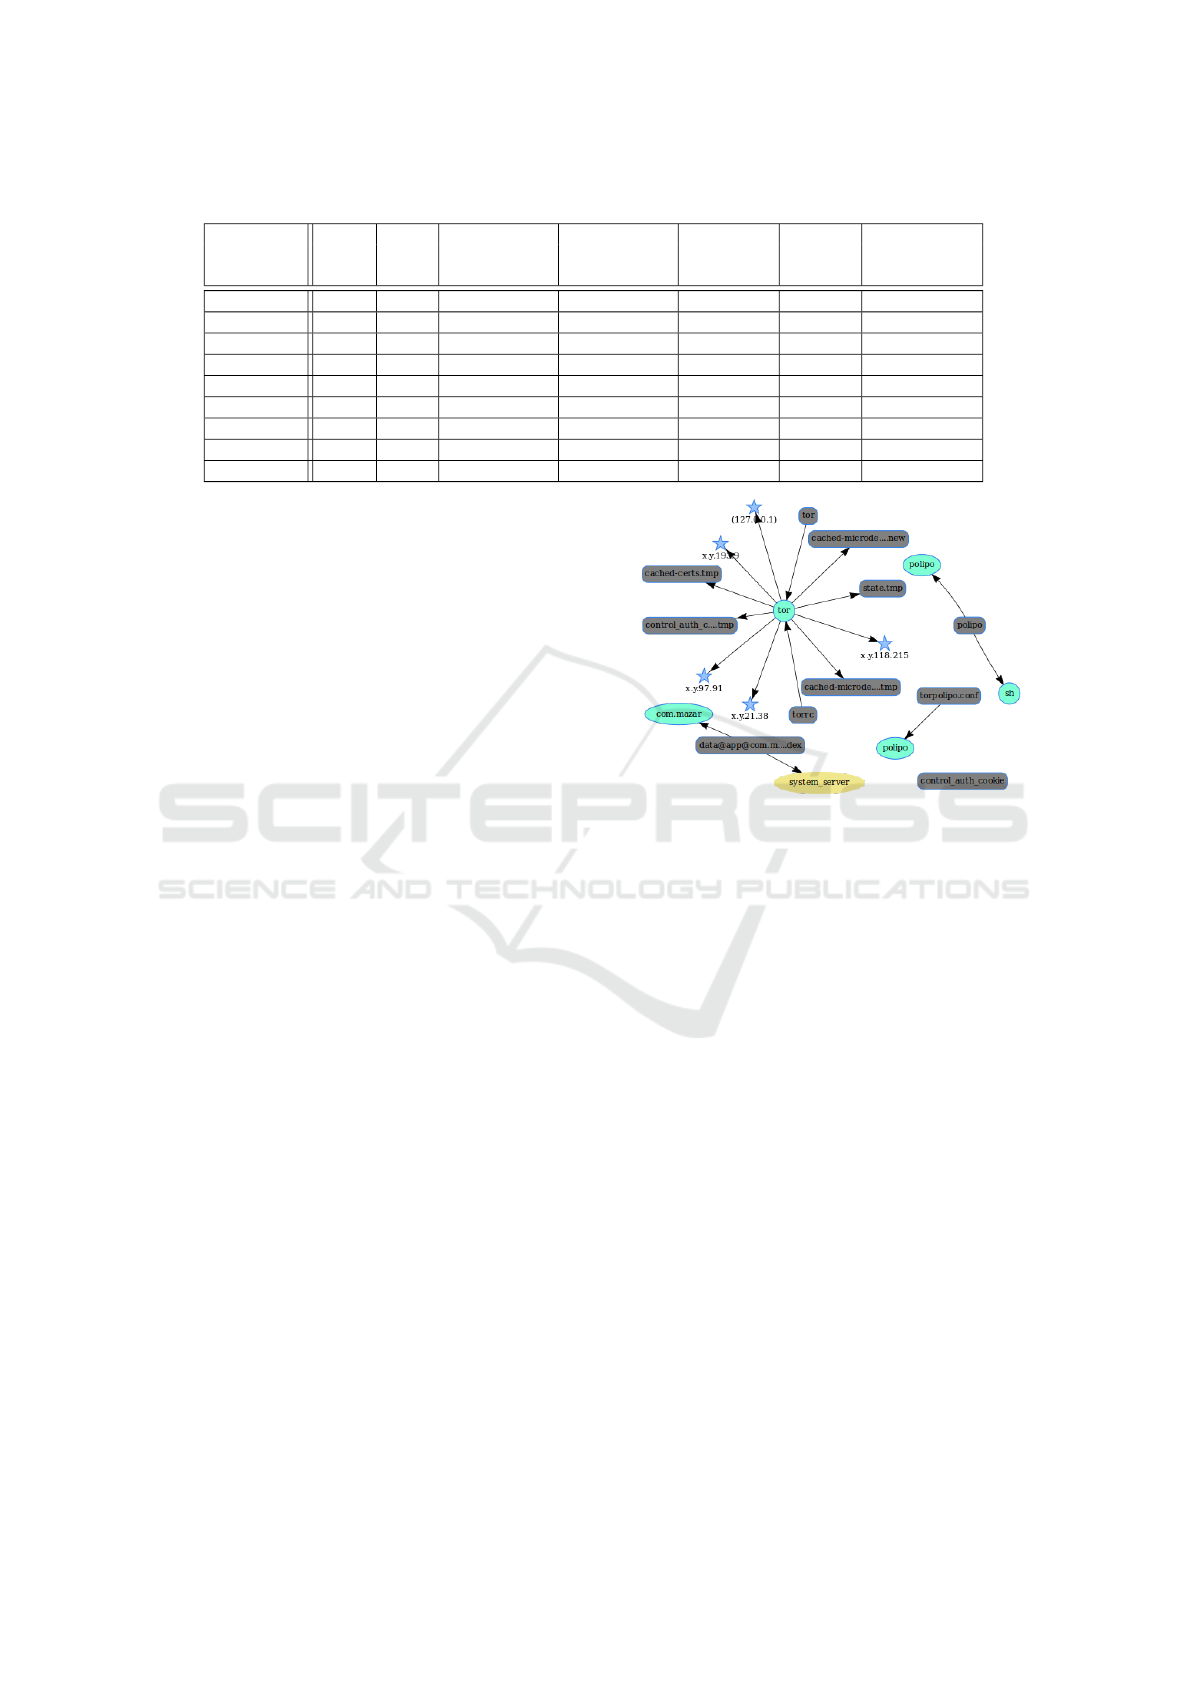
Table 4: Experiments on malware from the Kharon dataset (Kiss et al., 2016).
Nodes Edges Nodes out of Edges out of Length Detection
Nature of
in the in the the expected the expected of the result
the attack
SFG SFG normal behavior normal behavior maximal path
MobiDash 421 689 0 0 0 no
Adware
SimpleLocker 61 73 19 27 2 yes
Ransomware
Badnews 120 200 18 15 1 yes
App installer
WipeLocker 73 168 15 14 2 partially
DataEraser
DroidKungFu 96 167 20 26 4 yes
App installer
Cajino 82 182 22 9 2 yes
Spyware
SaveMe 28 58 6 8 3 yes
Spyware
Mazar 62 111 22 36 2 yes
Rootkit
Poison Cake 320 543 17 16 3 yes
Bootkit
exhibit a normal behavior for this approach: they ask
for a service for which they have requested the per-
mission. Thus, we focus on more sophisticated mal-
ware i.e. those that need to exploit a vulnerability
on the phone, make themselves persistent, ransom the
user or obey to a remote server. We claim that these
malware have a behavior that differs from the previ-
ous normal behavior. To evaluate this idea we led ex-
periments on a dataset (Kiss et al., 2016) containing
a ransomware (Simplelocker), an aggressive adware
(MobiDash), two spyware (Cajino and SaveMe), a
rootkit (Mazar), a data eraser (WipeLocker), a bootkit
(PoisonCake) and lastly two malware that install un-
desired applications (Badnews and DroidKungFu).
We applied exactly the same algorithm to check
if there exists a part of a malware graph out of the
expected normal behavior. Then we reviewed all the
remaining sub-graphs to verify if they reveal a ma-
licious symptom. These results, detailed in Table 4,
show that this method allows to point out sophisti-
cated malware as ransomware, rootkit or data eraser.
Indeed, these malware deviate from the normal ex-
pected behavior once they gain administrator privi-
leges, or install an application unbeknownst to the
user. For example, Figure 4 shows the part of the
graph out of the expected normal behavior for the
Mazar malware. The most interesting thing in this re-
maining graph is that it exhibits a connection to a re-
mote server through the anonymous network Tor (IP
addresses are anonymized). Additionally, we report
in Table 4 that we partially capture a behavior if we
can only observed that the malware has gained admin-
istrator privileges.
On the other side, this approach fails to spot ag-
gressive Adware (MobiDash) because displaying ads
can be considered as a normal behavior. Nevertheless
the graph of MobiDash has a huge amount of remote
connections in the graph even if each of them is part of
the expected behavior. Thus, we plan to enhance our
approach by taking into account the maximal number
of remote IP an application is authorized to contact.
Figure 4: Mazar’s graph out of the normal behavior.
We then tested this approach on 102 random mal-
ware whose behavior is less documented, extracted
from the website http://koodous.com. The results are
summarized in Table 3. This experiment confirms that
malware have behaviors that differ from the expected
normal behavior. More precisely, 95% of these mal-
ware have more than 407 edges out of the generic pat-
tern described in Figure 3. Only one malware (1%)
has a graph very close to this normal behavior, with 1
node and 0 edge in its final graph out of the expected
normal behavior.
All the material that was used for the ex-
periments described above are available on
http://kharon.gforge.inria.fr/goodware.html.
7 CONCLUSION
In this paper, we tackled the challenge of precisely
defining the normal behavior of Android applica-
tions at the operating system level. To this end, we
proposed the idea of defining this normal behavior
through information flows between files, processes
and sockets observed during the execution of an ap-
plication. This way, we introduced the first model of a
SECRYPT 2017 - 14th International Conference on Security and Cryptography
584

normal behavior at system level for an Android appli-
cation. To verify if this model is complete enough to
capture the real behavior of benign Android applica-
tions we compared it with a large corpus of executions
obtained from benign applications. In a second part,
we led experiments on malicious applications and
showed that this approach easily spot sophisticated
malware such as ransomware, rootkits, data erasers,
app installers or random chosen malware.
ACKNOWLEDGEMENTS
This work has received a French government sup-
port granted to the COMIN Labs excellence labora-
tory and managed by the National Research Agency
in the ”Investing for the Future” program under refer-
ence ANR-10-LABX-07-01.
REFERENCES
Abraham, A., Andriatsimandefitra, R., Brunelat, A., La-
lande, J.-F., and Viet Triem Tong, V. (2015). Grod-
dDroid: a Gorilla for Triggering Malicious Behaviors.
In 10th International Conference on Malicious and
Unwanted Software, pages 119–127, Fajardo, Puerto
Rico. IEEE Computer Society.
Afonso, V. M., de Amorim, M. F., Gr
´
egio, A. R. A., Jun-
quera, G. B., and de Geus, P. L. (2014). Identify-
ing Android malware using dynamically obtained fea-
tures. Journal of Computer Virology and Hacking
Techniques.
Andriatsimandefitra, R. and Viet Triem Tong, V. (2014).
Capturing Android Malware Behaviour using System
Flow Graph. In The 8th International Conference on
Network and System Security, Xi’an, China.
Blasing, T., Batyuk, L., Schmidt, A.-D., Camtepe, S. A.,
and Albayrak, S. (2010). An Android Application
Sandbox system for suspicious software detection. In
5th International Conference on Malicious and Un-
wanted Software, pages 55–62. IEEE Computer Soci-
ety.
Enck, W., Gilbert, P., Chun, B.-G., Cox, L. P., Jung, J., Mc-
Daniel, P., and Sheth, A. N. (2010). Taintdroid: An
information-flow tracking system for realtime privacy
monitoring on smartphones. In Proceedings of the
9th USENIX Conference on Operating Systems De-
sign and Implementation, OSDI’10, pages 393–407,
Berkeley, CA, USA. USENIX Association.
Kiss, N., Lalande, J.-F., Leslous, M., and Viet Triem Tong,
V. (2016). Kharon dataset: Android malware under
a microscope. In The Learning from Authoritative Se-
curity Experiment Results workshop, San Jose, United
States. The USENIX Association.
Lin, Y.-D., Lai, Y.-C., Chen, C.-H., and Tsai, H.-C. (2013).
Identifying android malicious repackaged applica-
tions by thread-grained system call sequences. Com-
puters & Security, 39:340–350.
Neuner, S., Veen, V. V. D., and Lindorfer, M. (2014). En-
ter Sandbox: Android Sandbox Comparison. In 3rd
IEEE Mobile Security Technologies Workshop, San
Jose, CA.
Schmidt, A.-d., Schmidt, H.-g., Clausen, J., Camtepe, A.,
and Albayrak, S. (2008). Enhancing Security of
Linux-based Android Devices. In 15th International
Linux Kongress.
Shabtai, A., Kanonov, U., Elovici, Y., Glezer, C., and Weiss,
Y. (2012). ”Andromaly”: A behavioral malware de-
tection framework for android devices. Journal of In-
telligent Information Systems, 38(1):161–190.
Wong, M. Y. and Lie, D. (2016). IntelliDroid: A Targeted
Input Generator for the Dynamic Analysis of Android
Malware. In The Network and Distributed System
Security Symposium, number February, pages 21–24,
San Diego, USA. The Internet Society.
Wu, D.-J., Mao, C.-H., Wei, T.-E., Lee, H.-M., and Wu,
K.-P. (2012). DroidMat: Android Malware Detection
through Manifest and API Calls Tracing. Seventh Asia
Joint Conference on Information Security, pages 62–
69.
Zheng, C., Zhu, S., Dai, S., Gu, G., Gong, X., Han, X., and
Zou, W. (2012). SmartDroid: an automatic system for
revealing UI-based trigger conditions in android ap-
plications. In Second ACM workshop on Security and
privacy in smartphones and mobile devices, page 93,
Raleigh, NC, USA. ACM Press.
Zhou, Y., Wang, Z., Zhou, W., and Jiang, X. (2012). Hey,
you, get off of my market: Detecting malicious apps
in official and alternative android markets. In NDSS,
volume 25, pages 50–52.
Information Flows at OS Level Unmask Sophisticated Android Malware
585
