Model for Quality of Life Evaluation of Countries European Union
with using Rule-based Systems
Martin Šanda and Jiří Křupka
Institute of System Engineering and Informatics, Faculty of Public Administration, University of Pardubice,
Studentská 84, Pardubice, Czech Republic
Keywords: AHP, EU, Fuzzy Sets, Fuzzy Inference System, Quality of Life Evaluation, Rule-based Systems, TOPSIS.
Abstract: This paper deals with the quality of life (QL) evaluation of countries European Union (EU) and progress of
this evaluation in years 2007, 2011 and 2015. QL evaluation is based on official Eurostat methodology for
QL evaluation - QL indicators for the EU, the data presented here come from several sources from within
the European Statistical System (ESS). The set of indicators is organised along the areas: Material living
conditions, Productive or main activity, Health, Education, Economic and physical safety, Governance and
basic rights and Natural and living environment. QL is evaluated with using rule-based systems method:
Technique for Order of Preference by Similarity to Ideal Solution (TOPSIS) - modification fuzzy TOPSIS
fuzzy inference system (FIS) and Analytic hierarchy process (AHP). The aim of this paper is creating model
for QL evaluation with using these methods, comparing results of these methods and their progression.
Result of model is final recommendation to reach the grant allocation for the countries or regional
development.
1 INTRODUCTION
Defining term QL brings dilemmas and each author
or institution has own approach and own solving this
problematic. If we occupy ourselves with defining
QL term, we have to consider influence of historical,
cultural and social changes, which take place in
given society.
The definition aptly describes the expert
discussions (Royuela et al., 2010), which state that
QL: “usually refers to the degree to which a person’s
life is desirable versus undesirable, often with an
emphasis on external components, such as
environmental factors and income. In contrast to
subjective well-being, which is based on subjective
experience, quality of life is often expressed as more
objective and describes the circumstances of a
person’s life rather than his or her reaction to those
circumstances.”
Among some common traits (Andráško, 2016)
which are typical for the issue of the QL research
also belongs a fragmentation of definitions, an
approach to the evaluation as well as
multidisciplinary and multidimensionality. The term
QL refers (Rapley, 2003) to human existence,
comprehension of meaning of life itself of individual
being. QL can be observed through two variables –
material and non-material part of human life and
includes individual way of life, not only individual
living conditions, but also living conditions of wider
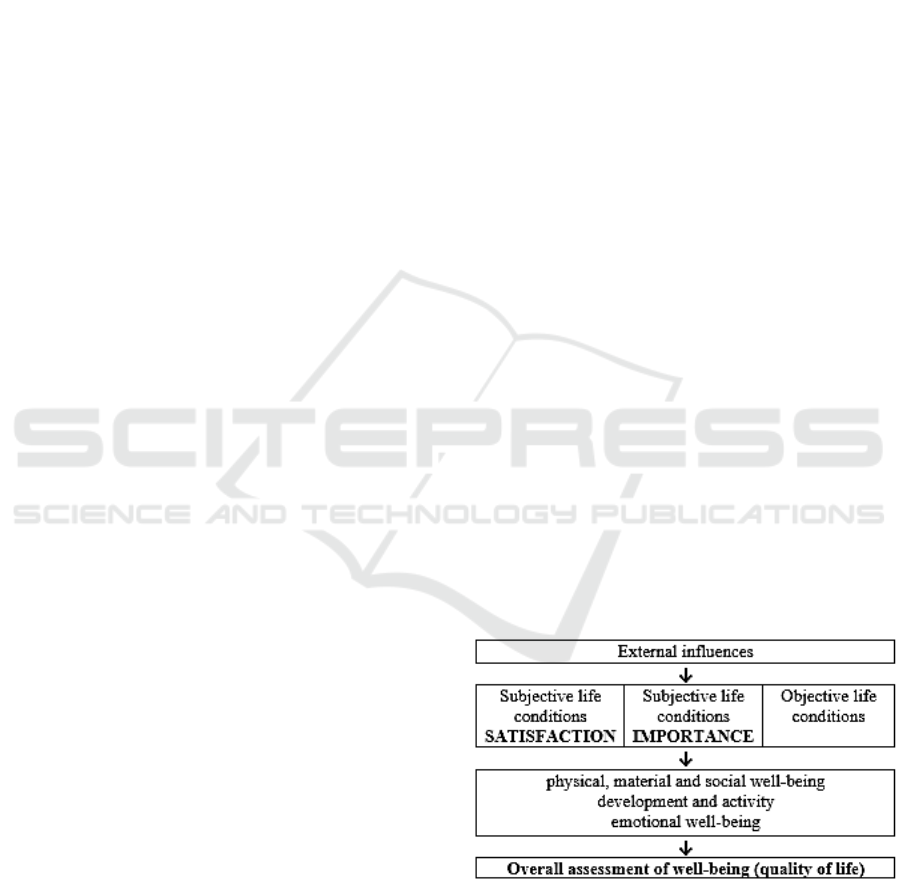
groups of society as a whole. Model of QL (Rapley,
2003) is in Figure 1.
Figure 1: Model of quality of life.
QL should be looked (Curtis et al., 2002;
Phillips, 2006) upon as a multidimensional variable,
which contains information about psychosocial
status of an individual which is influenced by, for
example, age, gender, education, social status,
Šanda, M. and K
ˇ
rupka, J.
Model for Quality of Life Evaluation of Countries European Union with using Rule-based Systems.
DOI: 10.5220/0006476604730479
In Proceedings of the 12th International Conference on Software Technologies (ICSOFT 2017), pages 473-479
ISBN: 978-989-758-262-2
Copyright © 2017 by SCITEPRESS – Science and Technology Publications, Lda. All rights reserved
473

economical situation or individual’s values. QL can
be viewed as availability of options, from which an
individual can pick during filling his life.
2 QUALITY OF LIFE
EVALUATION
The QL evaluation is a difficult thing and exist a lot
opinions and approaches. QL is evaluated by the
using of indicators. Individual indicators then form a
set of indicators or the whole methodology for
evaluating the QL. As examples of methodologies
(approaches) of QL evaluation we can quote: Active
Ageing Index (AAI, 2015); Economist Intelligence
Unit Limited (EIU, 2015); Eurofound (EF, 2015);
Better Life Index (OECD,2015).
The Eurostat official methodology was selected
for the created model. This methodology comprised
nine areas for QL evaluation and for evaluation were
selected indicators in years 2007, 2011, 2015. These
years have been selected due to the availability of
data and the trend of evaluation of the individual
countries. In this paper and in this model will be
evaluated countries, that have become members of
the EU in 2004 - Czech Republic, Estonia, Cyprus,
Latvia, Lithuania, Hungary, Malta, Poland, Slovenia
and Slovakia with compared to the EU-wide
average.
The created model will then be applicable to
other states or other selections. Unfortunately, only
27 pointers from seven areas were available for
evaluation, so this model will work with this
number. In the case of availability of data for
multiple indicators, the model could be expanded
(more indicators and areas). List of indicators is
described by Eurostat (2017): area of indicators
(area): indicators (unit) - sign.
Material living conditions (area A): indicator
Mean and median income (unit Euro) - K1, At-
risk-of-poverty rate (% of total population) - K2,
S80/S20 income quintile share ratio (quotient) -
K3, Actual individual consumption per capita
(Nominal expenditure per inhabitant in Euro) -
K4, Severely materially deprived people (% of
total population) - K5, (In)ability to make ends
meet (% of total population) - K6, Share of total
population living in a dwelling with a leaking
roof, damp walls, floors or foundation, or rot in
window frames of floor (% of total population) -
K7, Overcrowding rate (% of total population) -
K8, Share of people living in under-occupied
dwellings (% of total population) - K9,
Productive or main activity (area B):
Unemployment rate (%) - K10, People living in
households with very low work intensity (% of
total population aged less than 60) - K11,
Average number of usual weekly hours of work
in main job by economic activity (hour) - K12,
Population in employment working during
unsocial hours - nights (%) - K13, Temporary
contracts (%) - K14,
Health (area C): Self-perceived health, good and
very good (%) - K15, Self-reported unmet needs
for medical examination, too expensive or too far
to travel or waiting list (%) - K16,
Education (area D): Education attainment,
tertiary education (% of total population) - K17,
Early leavers from education and training (% of
the population aged 18-24 with at most lower
secondary education and not in further education
or training) - K18, Individuals' level of Internet
skills (% of Individuals who completed at least 2
of the 6 internet-related activities) - K19, People
that participated in education or training in the
four preceding weeks (%) - K20,
Economic and physical safety (area E):
Population unable to face unexpected financial
expenses (% of total population) - K21,
Population in arrears, debt (% of total
population) - K22, Crime, violence or vandalism
in the area (% of total population) - K23,
Governance and basic rights (area F): Gender
employment gap (difference between the
employment rates of men/ women aged 20-64) -
K24, Gender pay gap in Industry, construction
and services, except public administration,
defense, compulsory social security (average
gross hourly earnings of male/female paid
employees as a % of average gross hourly
earnings of male paid employees) - K25,
Natural and living environment (area G):
Pollution, grime or other environmental
problems (% of total population) - K26, Noise
from neighbours or from the street (% of total
population) - K27.
3 MODEL FOR EVALUATION
As described in the previous section, 27 indicators
from seven areas of the Eurostat official
methodology from 2007, 2011 and 2015 were
selected for the QL evaluation.
ICSOFT 2017 - 12th International Conference on Software Technologies
474
3.1 Describe of Model
For QL evaluation has proven to be a beneficial use
of system engineering methods (for example Šanda
and Mandys, 2017; Šanda and Křupka, 2016;
Křupka et al., 2010; Kačmárová et al., 2013) among
which, among other things, are the methods of
multi-criteria decision making, rule-based systems
and fuzzy logic.
The combination of these methods was been
used to solve problems and creating model. In model
were used TOPSIS method (respectively its fuzzy
modification) and FIS for solving problem and QL
evaluation. Subsequently, the AHP method was
used to compare the ranking results between the
methods. The model then worked with defined fuzzy
sets (FSs) too. The general scheme of the model is in
Figure 2.
Figure 2: Model for quality of life evaluation.
In the previous text were described the issue of
QL assessment, data source and selected indicators.
The following will be described methods, which
have been used to solve the problem - "core" of the
model.
3.2 Fuzzy Sets
Fuzzy logic was also used for the solution - fuzzy
sets were defined for QL evaluation. Based on
previous work in this field QL were defined 4 fuzzy
sets for area evaluation and 5 FS for total QL
evaluation - described below. In this article the
intervals of FS were specified and there were used
FS of trapezoidal shape of MF in the form [a b c d]
Mathworks (2017), where parameters ‘a’ and ‘d’
locate the ’feet’ of the trapezoid and the parameters
‘b’ and ‘c’ locate the ‘shoulders’.
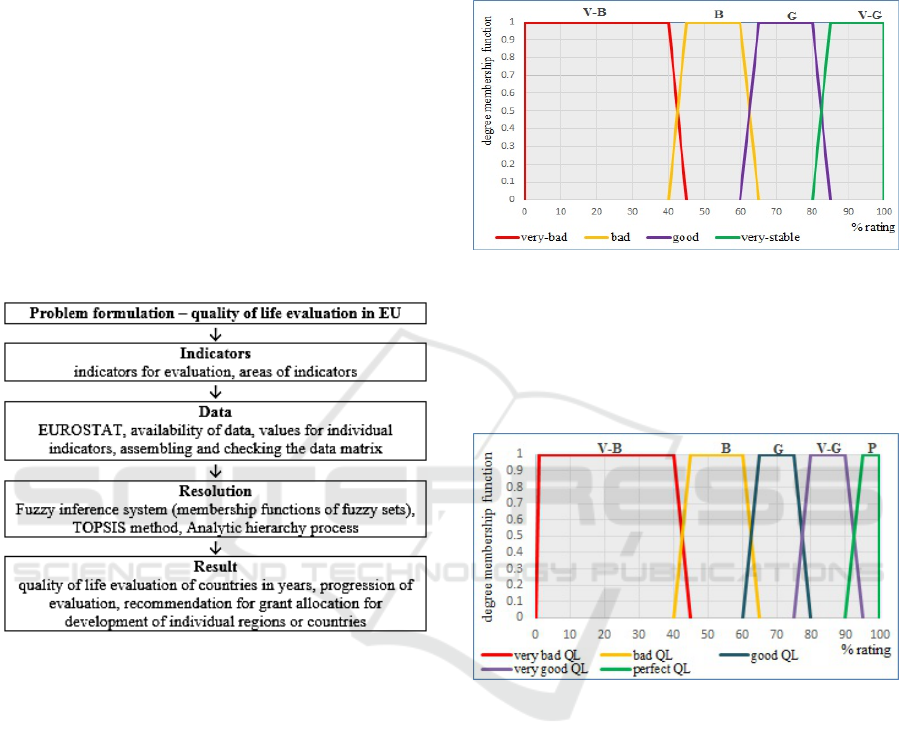
Defined FS and their linguistic variables for
areas evaluation: very bad [0 0 0.4 0.45], bad [0.4
0.45 0.6 0.65], good [0.6 0.65 0.8 0.85], very good
[0.8 0.85 1 1.2]. A graphical image of the defined FS
is in the Figure 3.
Figure 3: Fuzzy sets for areas evaluation.
Defined FS and their linguistic variables for total
evaluation: very bad [0 0 0.4 0.45], bad [0.4 0.45 0.6
0.65], good [0.6 0.65 0.75 0.8], very good [0.75 0.8
0.9 0.95] and perfect [0.9 0.95 1 1]. A graphical
image of the defined FS is in the Figure 4.
Figure 4: Fuzzy sets for total evaluation.
3.3 Using Methods in Model
The model worked with methods TOPSIS and its
fuzzy modification, FIS and AHP.
TOPSIS method is according to Senouci et al.
(2016), Chen and Hwang (1992) one of the multi-
criterial decision algorithm, which is based on the
option selection. It is assumed that the maximization
character of all criteria (if all criteria are not
maximization, it is necessary to transform them).
TOPSIS ranks the subjects according to the score,
when the highest is the best resolution.
The basic rule is that, the preferred alternative
should have the shortest distance from the ideal
resolution and the longest distance from the negative
– the worst resolution. In the created model was
used the extension of TOPSIS - fuzzy TOPSIS,
Model for Quality of Life Evaluation of Countries European Union with using Rule-based Systems
475
where defined fuzzy sets were used. Weights of
indicators were solved with share (1/27).
General structure of FIS is used for the resolution
according to Zadeh (2015); Hu et al. (2017); Yang et
al. (2017); Bělohlávek et al. (2002) and Kang et al.
(2017). Before its own QL evaluation with FIS
usage, it is necessary to resolve: normalized matrix,
define the rules and fuzzy sets for the QL evaluation,
Mamdani type of FIS was used. Based on
experimental FIS settings (Šanda and Křupka,
2017), it was the optimal solving trapezoidal shape
of membership function (MF) and method Centre of
Gravity used in defuzzification. The number of rules
depends on the number of criteria in the individual
area (for area B is 5) and the number of defined FSs
(for areas 4), for area B it is 45, a total 1024 rules.
Examples of rules of area B:
Rule
54
: If (K10 is very-bad) and (K11 is very-
bad) and (K12 is bad) and (K13 is very-good)
and (K14 is bad) then (QL-area-B is bad)
Rule
907
: If (K10 is very-good) and (K11 is good)
and (K12 is very-bad) and (K13 is good) and
(K14 is good) then (QL-area-B is good).
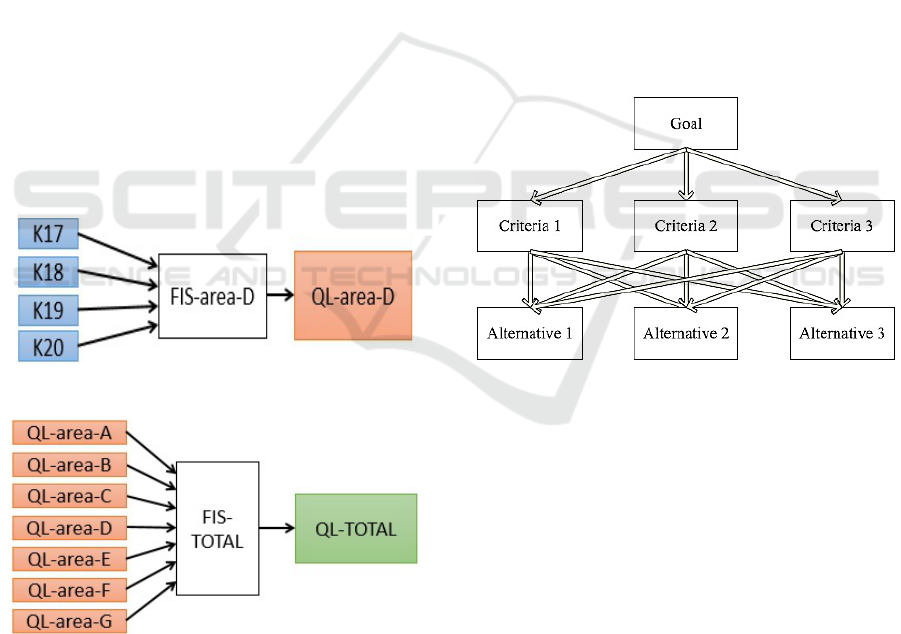
Inputs to FIS-area are indicators (chapter 2), output
is QL evaluation of area; inputs to FIS-TOTAL are
outputs form FIS of areas, output is total QL
evaluation - see in Figures 5 and 6.
Figure 5: Hierarchy structure of FIS for QL-area-D.
Figure 6: Hierarchy structure of FIS QL-total evaluation.
AHP is (Dweiri, 2016) a multi-criteria decision
making method. It is developed by Saaty to assist in
solving complex decision problems by capturing
both subjective and objective evaluation measures.
AHP uses a pair-wise comparison of the criteria
importance with respect to the goal. This pair wise
comparison allows finding the relative weight of the
criteria with respect to the main goal. If quantitative
data is available, the comparisons can be easily
performed based on a defined scale or ratio and this
cause the inconsistency of the judgment will be
equal to zero which leads to perfect judgment. If
quantitative data is not available, a qualitative
judgment can be used for a pair wise comparison.
This qualitative pair wise comparison follows the
importance scale suggested by Saaty. The same
process of pair-wise comparison is used to find the
relative importance of the alternatives with respect
to each of the criteria. Each child has a local
(immediate) and global priority (weight) with
respect to the parent. The sum of priorities for all the
children of the parents must equal 1. The global
priority shows the alternatives relative importance
with respect to the main goal of the model. The pair-
wise comparison is performed in matrix format to
check the consistency of the judgment.
It breaks a complex problem into hierarchy or
levels as shown in Fig. 7.
Figure 7: Example AHP structure.
3.4 Extension of Model
One of the aims of this article is the recommendation
for the grant allocation or a grant for regional
development (e.g. for the region with long-lasting
bad results) and per cent value of the grant for the
selected region. This recommendation is based on
the EIU (2015), which is in the Table 1. In this
article this approach is modified namely percentage
(per cent amount) of from the "development"
operational program (which would be specially
created). It is then possible to specifically define the
area for the grant allocation from the partial results
of the QL evaluation of the single areas.
ICSOFT 2017 - 12th International Conference on Software Technologies
476

Table 1: Suggestion for allowance.
QL evaluation rating (%) Suggested allowance (%)
80 - 100 0
70 - 80 5
60 - 70 10
50 - 60 15
50 or less 20
4 RESULTS
In the following tables 2 and 3 are the QL evaluation
results of using fuzzy TOPSIS and FIS.
Table 2: Results of fuzzy TOPSIS method.
Country 2007 2011 2015
EU 73.86% 60.56% 75.10%
Czech Republic 61.18% 61.86% 63.15%
Estonia 53.50% 59.20% 46.42%
Cyprus 67.83% 64.99% 65.67%
Latvia 59.88% 49.77% 62.21%
Lithuania 50.81% 52.96% 52.10%
Hungary 63.32% 55.58% 71.03%
Malta 50.93% 66.28% 53.26%
Poland 70.81% 59.20% 60.49%
Slovenia 57.34% 66.50% 62.56%
Slovakia 56.20% 60.56% 55.61%
The results show that, on the basis of selected
indicators, in the selected years, the Baltic States are
the worst, further partial unstable values are reported
in values Hungary and Poland. The Czech Republic,
Cyprus, Malta, Slovenia and Slovakia show a
positive trend relative to the EU average. The island
states, Slovenia and the Visegrad group can then be
labelled as states whose results are above the EU
average after accession. On the other hand, the
countries of the Baltic States have lagged behind the
EU average. The result can be explained by the fact
that it is the republics from Soviet Union.
Table 3: Results of FIS.
Country 2007 2011 2015
EU 52.50% 70.00% 74.61%
Czech Republic 58.34% 52.50% 76.38%
Estonia 52.50% 52.65% 70.00%
Cyprus 52.50% 70.00% 70.00%
Latvia 21.03% 52.50% 52.50%
Lithuania 52.50% 52.50% 52.50%
Hungary 52.50% 53.53% 52.50%
Malta 66.57% 70.00% 70.00%
Poland 52.50% 52.65% 52.50%
Slovenia 70.00% 76.24% 76.24%
Slovakia 52.50% 70.00% 76.24%
Differences between the fuzzy TOPSIS and FIS
were as follows - 2007: average 12,92% and median
12,66%; 2011: 5,91% and 6,55%; 2015: 11,75% and
13,22%.
The results of these methods were then compared
with the results of the AHP. The comparison showed
that the biggest differences were in all the Baltic
countries, partly in Hungary and Slovakia, rarely in
Malta and Slovenia. In general, it can be said from
the results that the larger differences were between
the FIS and AHP methods. Table 4 shows an
example of differences in ranking in 2011 (fT is
fuzzy TOPSIS).
Table 4: Comparison ranking between methods.
Country fT/AHP FIS/AHP fT/FIS
EU 1 2 3
Czech Republic 1 0 1
Estonia 1 1 2
Cyprus 2 1 1
Latvia 1 5 6
Lithuania 2 3 5
Hungary 2 7 5
Malta 0 0 0
Poland 2 4 2
Slovenia 2 2 0
Slovakia 2 3 3
5 CONCLUSIONS
On the basis of the results of the individual methods,
it is possible to compile tables with recommendation
for grant allocation, which should be directed to the
development of states or region. Tables 5, 6 and 7
are recommendations for individual years, the
"Average" column indicates the average
recommendation for grant allocation.
Table 5: Recommendation for the grant allocation 2007.
Country fTOPSIS FIS Average
Czech Republic 10.00% 15.00% 12.50%
Estonia 15.00% 15.00% 15.00%
Cyprus 10.00% 15.00% 12.50%
Latvia 15.00% 20.00% 17.50%
Lithuania 15.00% 15.00% 15.00%
Hungary 10.00% 15.00% 12.50%
Malta 15.00% 10.00% 12.50%
Poland 5.00% 15.00% 10.00%
Slovenia 15.00% 5.00% 10.00%
Slovakia 15.00% 15.00% 15.00%
Model for Quality of Life Evaluation of Countries European Union with using Rule-based Systems
477

Table 6: Recommendation for the grant allocation 2011.
Country fTOPSIS FIS Average
Czech Republic 10.00% 15.00% 12.50%
Estonia 15.00% 15.00% 15.00%
Cyprus 10.00% 5.00% 7.50%
Latvia 20.00% 15.00% 17.50%
Lithuania 15.00% 15.00% 15.00%
Hungary 15.00% 15.00% 15.00%
Malta 10.00% 5.00% 7.50%
Poland 15.00% 15.00% 15.00%
Slovenia 10.00% 5.00% 7.50%
Slovakia 10.00% 5.00% 7.50%
From these two tables, it is clear that the highest
recommendation is for Baltic States. Higher is
recommendation partly in the Visegrad group.
On the contrary, Table 7 shows that the years are
gradually improving and the trend is positive, so the
overall recommendation is less range.
Table 7: Recommendation for the grant allocation 2015.
Country fTOPSIS FIS Average
Czech Republic 10.00% 5.00% 7.50%
Estonia 20.00% 5.00% 12.50%
Cyprus 10.00% 5.00% 7.50%
Latvia 10.00% 15.00% 12.50%
Lithuania 15.00% 15.00% 15.00%
Hungary 5.00% 15.00% 10.00%
Malta 15.00% 5.00% 10.00%
Poland 10.00% 15.00% 12.50%
Slovenia 10.00% 5.00% 7.50%
Slovakia 15.00% 5.00% 10.00%
The total results based on Tables 5, 6 and 7 are
then as follows: Latvia (recommendation for the
grant allocation is 15,83%), Lithuania (15%),
Estonia (14,17%), Hungary and Poland (12,5%),
Czech Republic and Slovakia (10,83%), Malta
(10%), Cyprus (9,17%) and Slovenia (8,33%). These
results again confirm the "lagging" of the Baltic
states, the good results of the island states and the
attractions are also the same result Czech Republic
and Slovakia (Czechoslovakia before year 1993).
If we take a closer look at the three groups -
"Island states" (Cyprus and Malta), the Visegrad
group (Czech Republic, Hungary, Poland and
Slovakia) and the Baltic States (Estonia, Lithuania
and Latvia), the recommendation for the Baltic
States is 15%, Visegrad group 11.7% and "Island
states" 9.6%. This grant recommendation for the
Baltic States that is one of the important
conclusions.
Recommendations for further work and
development of the model include the use of
multiple methods of system engineering, their
synthesis and analysis; using more criteria; the
inclusion of indicators for weights and areas;
availability of data (current disadvantage).
The created model for QL evaluation can then be
adjusted according to the number of available
criteria, supplemented by more (available) years and
applied to other states or groups of countries. The
model for QL evaluation can be used, for example,
for evaluating regions (NUTS2 or NUTS3) or the
like. The topic for further work is also to deal in
more detail with the recommendation for grant
allocation, the grant source, etc.
ACKNOWLEDGEMENTS
This article was supported by the projects No.
SGS_2017_019 of the Ministry of Education, Youth
and Sports of CR with title ‘Models Synthesis and
Analysis for Implementation Support of Smart Cities
and Regions Concept’ at the Faculty of Economics
and Administration, University of Pardubice.
REFERENCES
Andráško, I., 2016. Kvalita života v mestách: východiská,
prístupy, poznatky. Brno: Masarykova univerzita,
2016. ISBN 978-80-210-8269-4.
Active Ageing Index, 2015 [online]. Concept,
Methodology and Final Results. Available on:
http://www1.unece.org/stat/platform/display/AAI/V.+
Methodology.
Bělohlávek, R., G. J. Klír, H. W. Lewis and Way, E.,
2002. On the capability of fuzzy set theory to represent
concepts. International Journal of General Systems.
31(6), 569-585. DOI: 10.1080/0308107021000061894.
ISSN 0308-1079.
Curtis, J. et al., 2002. Measure of the Quality of Dying and
Death: Initial Validation Using After-Death Interviews
with Family Members. J. Pain Sympt. Management,
vol. 24, no. 1, p. 17−31.
Dweiri, F. et al., (2016). Designing an integrated AHP
based decision support system for supplier selection in
automotive industry. Expert Systems with
Applications. 62, 273-283.
DOI: 10.1016/j.eswa.2016.06.030. ISSN 09574174.
EIU, 2015 [online]. Liveability Ranking and Overview. In
The Economist Intelligence Unit. Available on:
http://www.investtoronto.ca/InvestAssets/PDF/Report
s/EIU-Liveability-Ranking-and-Overview-August-
2015.pdf
Eurofound, 2015 [online]. Surveys Eurofound. Available
on: http://www.eurofound.europa.eu/surveys.
Eurostat: Quality of life (QOL). Eurostat: Your key to
European statistic. 2017. European Commission.
ICSOFT 2017 - 12th International Conference on Software Technologies
478

Available at WWW: http://ec.europa.eu/eurostat/web/
gdp-and-beyond/quality-of-life/data
Hu, X., W. Pedrycz, O. Castillo and Melin, P., 2017.
Fuzzy rule-based models with interactive rules and
their granular generalization. In Fuzzy Sets and
Systems. 307, 1-28. DOI: 10.1016/j.fss.2016.03.005.
ISSN 01650114.
Chen S. J. and Hwang C. L., 1992. Fuzzy Multiple
Attribute Decision-Making. In Methods and
Applications. Springer-Verlag, New York. ISBN: 978-
3-540-54998-7.
Kang, Y. K., H. Kim, G. Heo and Song, S. Y., 2017.
Diagnosis of feedwater heater performance
degradation using fuzzy inference system. Expert
Systems with Applications. 69, 239-246. DOI:
10.1016/j.eswa.2016.10.052. ISSN 09574174.
Kačmárová, M., Babinčák, P. and Mikulášková, G., 2013.
Teórie a nástroje merania subjektívne hodnotenej
kvality života. Vyd. 1. Prešov: Filozofická fakulta
Prešovskej univerzity v Prešove. 253 s. Acta Facultatis
philosophicae Universitatis Prešoviensis. ISBN 978-
80-555-0972-3.
Křupka, J., Kašparová, M., and Jirava, P., 2010.
Modelování kvality života pomocí rozhodovacích
stromů. E & M Ekonomie a Management, roč. 13, č.
3. s 130-146, ISSN 1212-3609.
MathWorks: trapmf, 2017 [online]. United States: The
MathWorks. [cit. 2017-02-23]. Available on:
https://www.mathworks.com/help/fuzzy/trapmf.html.
OECD, 2015 [online]. Bettr Life Index – Edition 2015.
Available on: http://stats.oecd.org/Index.aspx?DataSet
Code=BLI#
Phillips, D., 2006. Quality of Life: Concept, Policy and
Practice. London: Routledge. 276 p. ISBN 978-0-415-
32355-0.
Royuela, V., Moreno, R. a Vayá, E., 2010. Influence of
Quality of Life on Urban Growth: A Case Study of
Barcelona. In Regional Studies. Vol. 44., Issue 5, s.
551–567. ISSN 0034-3404.
Rapley, M., 2003. Quality of Life Research: A Critical
Introduction. London: SAGE. 286 s. ISBN 978-0-
7619-5456-9.
Senouci, M. A., Said H. and Abdelhamid M., 2016. Utility
function-based TOPSIS for network interface selection
in Heterogeneous Wireless Networks.
DOI: 10.1109/ICC.2016.7511563.
ISBN 10.1109/ICC.2016.7511563.
Šanda, M. and Křupka, J., 2017. Evaluation of the life
quality in the regions of the Czech Republic in the
years 2000-2015 using fuzzy inference system. In
Proceedings of the 29th International Business
Information Management Association Conference.
Norristown: International Business Information
Management Association-IBIMA. ISBN 978-0-
9860419-7-6.
Šanda, M. and Křupka, J., 2016. Rule-based system for
quality of life evaluation in socio-cultural field. In
Proceedings of the 11th International Joint
Conference on Software Technologies. Porto:
SciTePress - Science and Technology Publications.
s. 342-347. ISBN 978-989-758-194-6.
Šanda, M. and Mandys, J., 2017. Quality of life evaluation
in NUTS3 regions of Czech Republic and progression
of evaluation in years 2000 - 2015. In Proceedings of
the 21th International Conference Current Trends in
Public Sector Research. Brno: Masarykova univerzita.
s. 113-121. ISBN 978-80-210-8448-3.
Yang, X., F. Yu, W. Pedrycz and Way, E., 2017. Long-
term forecasting of time series based on linear fuzzy
information granules and fuzzy inference system. In
International Journal of Approximate Reasoning.
81(6), 1-27. DOI: 10.1016/j.ijar.2016.10.010. ISSN
0888613x.
Zadeh, L. A., 2015. Fuzzy logic-a personal perspective.
Fuzzy Sets and Systems. 281, 4-20. DOI:
10.1016/j.fss.2015.05.009. ISSN 01650114.
Model for Quality of Life Evaluation of Countries European Union with using Rule-based Systems
479
