
Emotions Detection based on a Single-electrode EEG Device
Royl
´
an Quesada-Tabares, Alberto J. Molina-Cantero, Isabel M. G
´
omez-Gonz
´
alez,
Manuel Merino-Monge, Juan A. Castro-Garc
´
ıa and Rafael Cabrera-Cabrera
ETS Ingenier
´
ıa Inform
´
atica, Departamento de Tecnolog
´
ıa Electr
´
onica, Universidad de Sevilla, Spain
Keywords:
Emotions, Signal Processing, Single EEG Electrode, Classification Analysis.
Abstract:
The study of emotions using multiple channels of EEG represents a widespread practice in the field of research
related to brain computer interfaces (Brain Computer Interfaces). To date, few studies have been reported in
the literature with a reduced number of channels, which when used in the detection of emotions present results
that are less accurate than the rest. To detect emotions using an EEG channel and the data obtained is useful
for classifying emotions with an accuracy comparable to studies in which there is a high number of channels,
is of particular interest in this research framework. This article uses the Neurosky Maindwave device; which
has a single electrode to acquire the EEG signal, Matlab software and IBM SPSS Modeler; which process
and classify the signals respectively. The accuracy obtained in the detection of emotions in relation to the
economic resources of the hardware dedicated to the acquisition of EEG signal is remarkable.
1 INTRODUCTION
There are two main theories about the nature of emo-
tions. One of them posits the existence of a relatively
low number of basic emotions (families of emotions)
that are universal for all human beings (Ekman et al.,
1987; Levenson, 2011). At least six families have
been proposed: happiness, sadness, repulsion, anger,
fear and surprise. The dimensional theory, on the
other hand, considers that emotions are represented in
an N-dimensional space, where two of the coordinate
axes would explain most of the emotional variations.
These axes are called Valence and Arousal (Russell
and Barrett, 1999). Valence is related to pleasure and
varies from negative values (very unpleasant) to pos-
itive values (very pleasant). Arousal is related to the
intensity of emotion, ranging from very low to very
high. The two theories of emotions are not contra-
dictory to each other. In fact the six basic emotions
can be characterized according to their valence and
arousal.
The theory of basic emotions includes, in turn, a
locationist model that assumes that each emotional
category starts from a specific place of the brain and
body. Specifically, fear is located in the amygdala; the
feeling of repulsion, in the insula; anger in the orbito-
frontal cortex (OFC) and sadness in the anterior
cortex of the cingulate (ACC) (Vytal and Hamann,
2010). Dimensional theory is included within the so-
called constructionist model where it is asserted that
emotions are psychological events that emerge from
basic physiological operations, which are not specific
to emotions. In (Lindquist et al., 2012) the authors
propose a model with four components: core affect,
a body sensory input that is experienced as pleasant /
unpleasant (valence) with some degree of excitation;
conceptualization, which links the body sensations
with previous experiences to endow them with mean-
ing; emotional words, used as support of emotional
categories that are not clearly differentiable from the
sensitive point of view; and executive attention, which
focuses on some of the incoming stimuli. Some neu-
roimaging results have corroborated that, unlike what
the locationist model predicts, any region that was ac-
tivated during a basic emotion, was also activated for
at least one other emotion (Lindquist et al., 2012).
This suggests the existence of neural networks that
interact with each other to generate the emotions, in-
stead of precise places (locationist model). For exam-
ple the amygdala is recruited for both fear and repul-
sion, so it takes different functionalities depending on
the neural network that uses it.
There is no one theory that dominates, taking into
account the results of neuroimaging, which can be in-
terpreted differently according to the procedure used
for the treatment of the data. (Hamann, 2012) summa-
rizes the existing controversy pointing out that in the
future, the analysis of animal models and studies on
patients with brain injuries should be undertaken,
Quesada-Tabares, R., Molina-Cantero, A., Gómez-González, I., Merino-Monge, M., Castro-García, J. and Cabrera-Cabrera, R.
Emotions Detection based on a Single-electrode EEG Device.
DOI: 10.5220/0006476300890095
In Proceedings of the 4th Inter national Conference on Physiological Computing Systems (PhyCS 2017), pages 89-95
ISBN: 978-989-758-268-4
Copyright © 2017 by SCITEPRESS – Science and Technology Publications, Lda. All rights reserved
89
which have been reported as tending more towards a
locationist theory.
Emotions can be determined in several ways:
through the analysis of gestures (facial or other), texts,
speech (Liu et al., 2011), as well as the activity of var-
ious physiological variables. The electroencephalo-
gram (EEG) is one of these variables. In this arti-
cle we analyze the EEG and make use of the two-
dimensional model.
There are a large number of devices with which
EEG activity can be measured. These vary in price
and how the measurement obtained is transmitted
(wired or wireless). The use of a wireless device was
opted for due to the advantages in mobility and adapt-
ability it offers. Some devices that are on the market
with these characteristics are: Emotiv (emo, ), Neu-
rosky Mindwave (emo, ) and Enobio(eno, ). Emotiv
offers better results than the Neurosky Mindwave if it
is used for the evaluation of cognitive processes (Das
et al., 2014). Instead of the support offered, usabil-
ity and its price so competitive is selected to make
this study the Neurosky Mindwave. This has been
widely used by the scientific community for the de-
velopment of various applications such as the detec-
tion of sleepiness (Van Hal et al., 2014), level of at-
tention (Liu et al., 2013), stress (Crowley et al., 2010;
Maki et al., 2012), and so on. It is a device that of-
fers developers and researchers the possibility to treat
the measured signal, but it also comes integrated with
a system that processes and delivers characteristics of
the post-processing to the user, which will not be used
in our case.
For the study and comprehension of the EEG sig-
nal, the analysis of the bands is widely used. An-
other feature used to study the EEG signal is the frac-
tal dimension (Wang and Sourina, 2013; Siamaknejad
et al., 2014) (in this study the Higuchi algorithm was
used (Cervantes-De la Torre et al., 2013)). A fractal
dimension close to 2 indicates that the signal is very
complex, however a value close to 1 means that the
signal is close to a line.
This study aims to analyze the characteristics of
EEG signal, study the statistical behavior and make
a classification of the emotional states using a set of
images.
2 METHODOLOGY
2.1 Materials
To acquire the EEG signal we used Neurosky Mind-
wave. This device has an electrode placed at Fp1, ac-
cording to the standard 10-20 system, and a fixed
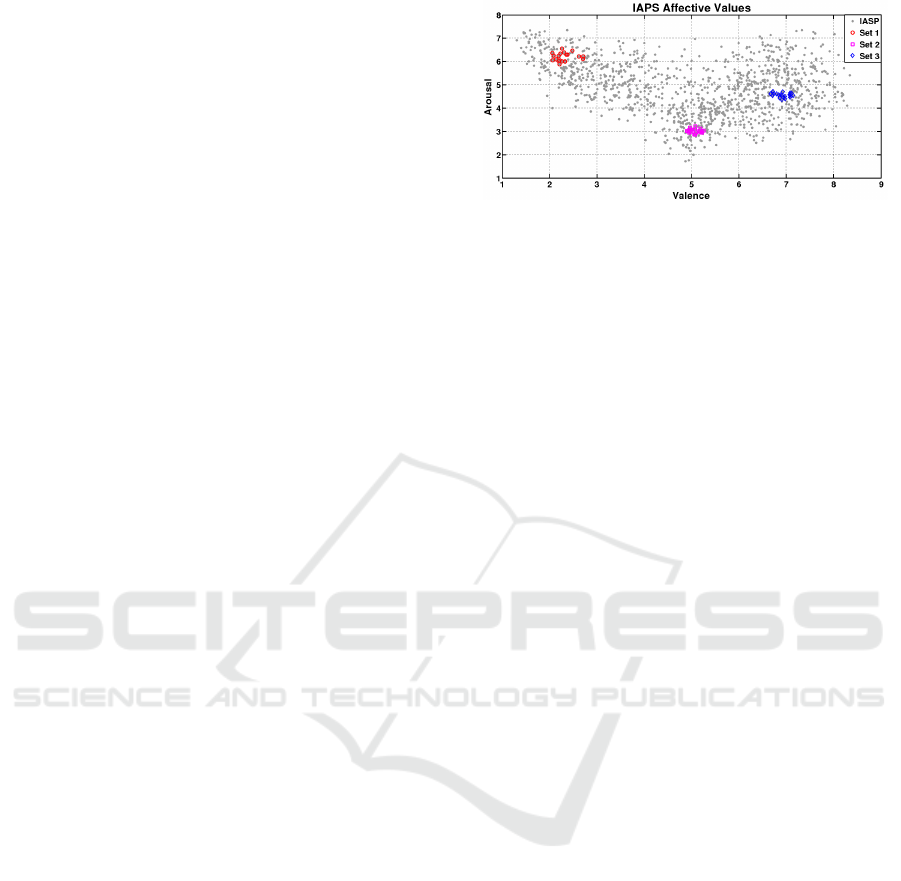
Figure 1: Valence and arousal values of the selected pic-
tures.
sampling frequency of 512Hz with a bluetooth inter-
face. The data is read, saved and processed using
Matlab 8.4.0.150421 (R2014b). To study the signal
features we used the IBM SPSS Modeler, this soft-
ware is a set of tools of data mining that allows for
the quick development of predictive models, which
offers a wide variety of modeling methods from au-
tomated learning, artificial intelligence and statistics
(Corporation, 2012).
2.2 Experimentation
Seven people took part in the experiment. Their av-
erage age was 29.85 with a standard deviation of
8.97. The experiment consists of displaying 60 pic-
tures of the IAPS (International Affective Picture Sys-
tem), formed by three different groups of valence and
arousal pairs (Figure 1), The first group has 2.306
± 0.43 valence and 6.1890 ± 0.04 arousal, the sec-
ond 5.063 ±0.24 valence and 3,020 ± 0.02 arousal,
while the third 6,921 ± 0.032 valence and 4,551 0.02
arousal.
Figure 2 depicts the timeline of the experiment.
Before starting it, the SAM test was applied (Self-
assessment manikin). This test allows a quick self-
assessment of each participant indicating their initial
values of valence and arousal. Then, the sixty IAPS
pictures were shown randomly, each displayed for 6s,
following the same procedure as in (Aftanas et al.,
2001). Between each picture a resting picture with
a black background and a gray cross in the center was
shown for 4s (Hosseini and Naghibi-Sistani, 2011).
This time lag between IAPS pictures reduces the over-
lapping effect on the EEG signal.
A Matlab software was developed to show the pic-
tures, record the EEG data sent by Neurosky and in-
troduce time marks to build EEG epochs associated
with each IAPS picture and resting period. All the
sessions were recorded by a WebCam to contrast any
possible anomaly in the signal. Finally, participants
completed a new SAM test for each picture.
PhyCS 2017 - 4th International Conference on Physiological Computing Systems
90

2.3 Signal Processing
The EEG signal was segmented using windows of 512
samples (1-s) with a hop size of 64 samples (overlap-
ping 87.5 %). A procedure has been developed for the
automatic analysis of each epoch, in order to identify
whether it contains a valid EEG signal, or whether it is
contaminated by any type of artifact. These artifacts
may have different sources: blinks, winks, eye move-
ments, motion artifact, or muscle activity (EMG). In
our case, the main source of artifacts have an ocular
origin, because of the position of the electrode, al-
though what is also important is the electrical activity
of the frontal and temporal muscles and the artifacts
due to the movement of the electrode.
The pre-processing of the signal looks to identify
possible artifacts in each epoch. To accomplish this,
we have used two features: the difference between
the maximum and minimum sample value (MinMax),
and the total energy (ESF) of the signal after applying
a Savitzky-Golay lowpass filter (order 2 and length
35) (Schafer, 2011). Figure 3 shows the feature space.
Epochs containing muscular activity have values of
the MinMax feature that are similar or a bit higher
than those of the epochs with only EEG, but with
more energy from the filtered signal (ESF). Blinking
or EEG-only windows have similar values in the ESF
feature but differ in MinMax. Finally, windows with
motion artifact contain values of these features that
surround those obtained by other types of artifacts.
For all these reasons, the use of thresholds (maxi-
mum and minimum) of each dimension of the feature
space has been proposed, to limit and facilitate the
automatic detection of valid EEG container segments
and blinks (as shown in Figure 3) with an accuracy of
96 % and 98 % respectively. The method followed is
conservative in the selection of valid epochs, reducing
the number of false positives at the cost of increasing
false negatives.
While motion and EMG artifact are infrequent, the
ocular ones are not. There are techniques for remov-
ing ocular artifacts from the EEG signal. It is known
that ocular artifacts influence, fundamentally, the low-
est energy bands (δ, θ and part of α) so their non-
elimination of analysis windows could distort the re-
sults. One of the most used techniques for elimination
of these artifacts is based on the analysis of indepen-
dent components (Stone, 2004), but, for their applica-
Figure 2: Experimental sequence.
Figure 3: Feature spaces values for motion artifacts (pink),
muscular activity (blue), blinks (green) and EEG (black).
The selected areas to identify EEG and EEG+blinks epochs
are also shown.
tion, at least two EEG channels are required, which do
not exist in our case. However, in (Szibbo et al., 2012)
a technique has been developed to eliminate such arti-
facts in a single channel. It is based on applying a low
pass filter of the Savitzky-Golay type, with the same
characteristics as the one used for the calculation of
the ESF feature. Therefore, if an epoch is identified
as a blinking container, this type of filter is applied
before proceeding to the study in frequency.
The epochs containing no artifacts or only blinks
which have been previously removed are then win-
dowed with a Hamming function to reduce spectral
leakage. Then the squared fast Fourier transform
(FFT) is applied to each segment to obtained the typi-
cal energy bands:δ, θ, α and β. The fractal dimension
is also calculated, so a total of 5 values per epoch were
obtained.
2.4 Analysis
The averages of energy bands and fractal dimension
of the epochs contained in every 6s of picture were
obtained. From those averages the relation θ/β and
θ/α was also included in the posterior analysis. This
gives a total of 3x 20 x 7 numerical values for each
set of images, picture and subject. Then we apply two
different types of analysis: statistical and classifica-
tion. The first looked for significant differences for
each feature among the 3 sets of pictures. The second
analysis sought to identify the accuracy in the detec-
tion of each set using a classifier based on a decision
tree.
Emotions Detection based on a Single-electrode EEG Device
91

Table 1: Averaged values of each feature, subject and set of pictures. Values are ×10
7
.
Subject Set1 Set2 Set3
δ θ α β
θ
β
θ
α
hfd δ θ α β
θ
β
θ
α
hfd δ θ α β
θ
β
θ
α
hfd
1 6,04 5,12 2,3 3,21 1,59 2,22 1,58 3,36 3,65 1,95 3,08 1,18 1,86 1,59 4,02 3,98 1,96 2,89 1,37 2,02 1,58
2 2,06 2,49 2,63 3,9 0,63 0,94 1,66 2,1 2,59 2,95 4,08 0,63 0,87 1,65 2,19 3,26 2,85 3,77 0,86 1,14 1,65
3 4,32 5,48 4,37 8,64 0,63 1,25 1,57* 4,58 5,83 4,98 8,61 0,67 1,17 1,55* 4,06 5,63 4,67 8,3 0,67 1,2 1,58*
4 2,96 3,29 1,77 5,34 0,61 1,85 1,64 2,15 1,91 1,1 5,11 0,37 1,73 1,64 2,45 2,2 1,29 5,14 0,42 1,69 1,65
5 2,18 2,64 1,56* 3,81 0,69 1,69 1,68 1,61 2,09 1,1* 3,51 0,59 1,88 1,68 2,29 2,88 1,47* 3,6 0,8 1,95 1,67
6 4,68 4,94 3,09 4,5 1,09 1,6 1,58* 4,54 4,64 3,09 4,73 0,98 1,5 1,6* 3,56 4,4 3,05 4,76 0,92 1,44 1,63*
7 1,11 1,24 0,69* 4,51 0,27 1,78 1,71* 2,62 1,9 1,32* 4,53 0,41 1,43 1,68* 2,13 2,53 1,64* 5,07 0,49 1,53 1,69*
2.4.1 Study 1
The mathematical tool used to perform the first anal-
ysis was ANOVA (Analysis of Variance) applied to
each person and to the seven features ordered by set
of images, in order to check if, at least one of the sets
of images, is significantly different from the rest.
2.4.2 Study 2
The second analysis was performed using the classi-
fication algorithm C5.0, which generates a decision
tree. The division of the samples was based on the
node that offers the maximum gain of information in
each level and allows several divisions in more than
two subgroups iteratively until it arrives to perform
Divisions that do not have a significant impact on the
model, which are discarded. The 7 features are taken
as input data for each image and have three nominal
values (the three sets in which the images have been
grouped). Then for each person the accuracy of the
correspondence established between each image and
its respective group is calculated. This is done using
IBM SPSS Modeler software, with the option of par-
titioning the data, to ensure that they have not used
the same information as in the model generation.
3 RESULTS
Table 1 shows the absolute values of the features ob-
tained for Study 1, grouped according to a sub-set
of images and a subject. The values that have been
shown to be statistically significant, with a value of
p < 0.5, are emboldened. Subjects 3, 6 and 7 ob-
tained values significant for the fractal dimension and
subjects 5 and 7 in the α band. However, there is not
a clear relationship between features’ behavior and
changes on valence and arousal. For example, for
subject 3, the fractal dimension has a behavior con-
cave with the sub-set of images (from set1 to set3).
However, for the subject 6, the same feature, has a
growing monotone behavior. Subject 7 has a concave
behavior too although between Set2 and the Set3 there
are no changes in the fractal dimension.
Subjects 5 and 7 show significant changes in the
α band. However, like with the fractal dimension,
there is not a regular pattern of behavior of this feature
when we vary the sub-set of images. For example,
while subject 7 shows a behavior growing monotone
in the α band (from Set1 towards Set3), subject 5, has
a concave behavior.
In Table 2 the results of classification by subject
can be seen, which are around 81% accurate.
Table 2: Accuracy in detecting emotional states.
Subject Accuracy
1 78,33%
2 78,33%
3 76,67%
4 73,33%
5 91,67%
6 81.67%
7 85%
Mean 80.71%
4 DISCUSSION
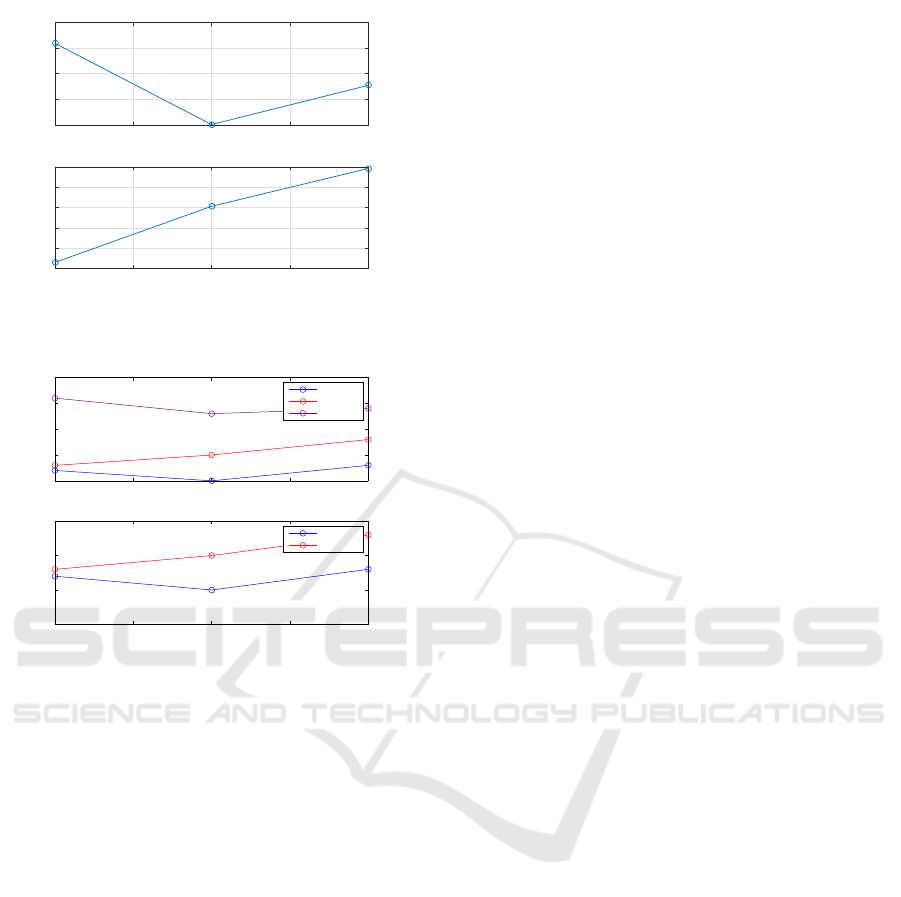
To facilitate the understanding of the results, the
Arousal and Valence results according to IAPS (Fig-
ure 1) and the most significant features (hfd and
α), depending on the groups of selected images, are
shown (See figures 4 and 5).
4.1 Significant Features Analysis
The fractal dimension is related to the complexity of
the EEG signal, which is increased in neural activa-
tion processes. In (Colibazzi et al., 2010) an experi-
ment was carried out with neuroimaging to find out
which areas of the brain are activated by know vi-
sual stimuli categorized with different values of va-
lence and arousal. It is suggested that a stimulus with
positive valence decreases activity in the right hemi-
sphere, mainly in r-dLPFC and AMCC areas. In con-
trast, for a stimulus with positive excitement, activity
in the left hemisphere present a growing monotony,
fundamentally in thalamus and amygdala. Since the
measurement system mainly picks up the activity that
is located in the left hemisphere, the signal must be
PhyCS 2017 - 4th International Conference on Physiological Computing Systems
92
Set
1 1.5 2 2.5 3
Arousal
3
4
5
6
7
Set
1 1.5 2 2.5 3
Valence
2
3
4
5
6
7
Figure 4: Valence and Arousal variation of the three set of
selected pictures.
1 1.5 2 2.5 3
1.55
1.6
1.65
1.7
1.75
hfd
Subject 3
Subject 6
Subject 7
1 1.5 2 2.5 3
1.5
1.55
1.6
1.65
Alpha Band
Subject 5
Subject 7
Figure 5: Variation of the two statistically significant fea-
tures for each set and subject.
more influenced by the arousal than by the valence.
Moving from set1 to set2 it is shown a decrease in
arousal and an increase in valence is shown, but the
fractal dimension for subjects 3 and 7 decreases as a
consequence of that reduction of activity in the left
hemisphere. When passing from set2 to set3, both
valence and arousal increase, growing the fractal di-
mension, as occurs with subjects 3, 6 and 7.
Another neuroimaging study (Nielen et al., ) de-
termines that the zones that are activated during
changes of valence and arousal differ from the pre-
vious one, but which also justify, to some extent, the
changes obtained in the fractal dimension. In it, the
arousal increase is correlated with the activity’s in-
crease in the areas associated with the medium tem-
poral gyrus (mT) and vLPFC. The behavior of valence
is more complex, as for negative values of this there is
a reverse neuronal activity with valence in the LPFC
and direct with it for positive values in the orbito-
frontal and mT regions. All activation areas can influ-
ence the signal sensed with greater or lesser weight.
In any case, the change from set1 to set2 causes a gen-
eralized decrease of the prefrontal and temporal act-
ivity that could justify the decrease of the fractal di-
mension. The step from set2 to set3 shows increase
of activity in orbito-frontal (valence) and mT (va-
lence and arousal). There may be some compensation
in the measured signal as a function of the valence,
as both the sensor Fp1, affected by the orbitofrontal
zone, such as reference (located near the temporal
lobe) could counteract its effect, leaving only the de-
pendence of the arousal on the reference sensor, and,
therefore, in the recorded signal. This could justify
the increase of the fractal dimension.
The behavior of the other feature, the α band, does
not correspond to any valid fact in the revised scien-
tific literature. For example, an EEG system with 19
electrodes was used in (Valenza et al., 2015) to an-
alyze the influence of valence and arousal on power
bands. The authors used pictures of IAPS classified
according to two classes of valence (positive and neg-
ative) and four levels of arousal. It was concluded
that there were significant changes in the bands θ and
β in the PFC and the parietal zone for intermediate
values of arousal. In (Aftanas et al., 2001), using 62
electrodes, they found significant differences in the
band θ in the anterior temporal zone. There are ef-
fects of lateralization, since for negative valences, it
was observed a greater synchronization (activation) in
the left hemisphere, whereas for positive valences, the
same effect was observed in the opposite hemisphere.
4.2 Classification Results
In (Yoon et al., 2013) a method was proposed to iden-
tify four emotional states: active, commitment, plea-
sure and neutral using the same system as in this pa-
per, but instead of being based on the pure signal,
it is based on two parameters: levels of mediation
and attention. The achieved classification accuracy
was 66% with data from 42 participants. In (Brown
et al., 2011) the percentage of classification was 82%,
higher than that obtained in this last work, but based
on the use of 9 electrodes, located mainly in the pre-
frontal area and in both hemispheres and based on
the ratio of the α band between the sensors located
in symmetrical positions between both hemispheres.
In (Chanel et al., 2007) 9 bands distributed between
[4, 20] Hz were used as features for training two
classifiers (LDA -Linear Discriminant Analysis- and
SVM -Support Vector Machine-) and three classes
(excitated, little excited, neutral) for arousal and two
classes for valence (positive, negative). The best re-
sults were obtained with SVM with 67% for arousal
and 76% for valence. In (Liu et al., 2011; Sourina and
Liu, 2011) , the fractal dimension was used to classify
states of excitation and valence with three electrodes.
Emotions Detection based on a Single-electrode EEG Device
93

One of them, located at FC6, was used for the arousal
and the difference between the AF3-F4 electrodes, for
the valence. Using three states for each variable (pos-
itive, neutral and negative) they achieved an accuracy
ranging from 70% up to 100% in some cases. In (Bos
et al., 2006) power bands were used as features for the
classifier and a reduced number of electrodes. In par-
ticular, for arousal it was observed that the best clas-
sification result, 97.4 was with β band between the
electrodes F3 / F4, while that for valence, the result
was of the 92.3% in the same F3/F4 or in Fpz.
4.3 Affective Assessment
Finally, figure 6 shows the averages of reported
arousal and valence for each set of pictures per subject
(circle) and the averages for all subjects (*).
Figure 6: Mean experimental valence and arousal values for
each set of pictures and subject.
Although it can be seen that averages per sub-
ject approximate to the values of the IAPS (except
for set1, whose valence is greater and the arousal is
lower), the dispersion of the values reported for each
of the 20 pictures is quite higher than those indicated
in the IAPS database. These variations could be due
to cultural factors. In a study carried out in Spain with
more than 800 people, an adaptation of the values of
valence and excitation of the IAPS have been pro-
posed (Molt
´
o et al., 1999). The results differ slightly
from values reported in the IAPS, but, in the case of
this work, the dispersion obtained for each set was
even larger than the collection made by the Spanish
adaptation. This could justify, in large part, why sig-
nificant variations among the measured features for
the different sets of pictures have not been obtained.
5 CONCLUSIONS
The study shows the way in which an EEG channel
is used and can perceive the response of neuronal ac-
tivity to stimuli; in our case, visual stimuli.The va-
lidity of using a low-cost commercial device such as
Neurosky MindWave for the acquisition of the signal
is checked. After implementing a classification algo-
rithm, emotions are detected with an average accuracy
of 81% of total stimuli.This value exceeds the results
obtained in most of the studies reported in the liter-
ature, either for those who use a reduced number of
channels of EEG or for those who make the measure-
ment with a considerable number of electrodes.
There seems to be a direct correlation between
the signal complexity and the arousal; on the con-
trary, having a single electrode does not have suffi-
cient information to give any conclusions about the
valence.There are variations between the IAPS data
and those reported by the people in the SAM test ap-
plied at the end of the experiment. It could influence
in the correspondence between the features expected,
taking as reference the IAPS and those experienced
by the subjects.
ACKNOWLEDGMENTS
We would like to thank all of those involved in the
realization of this study and the anonymous review-
ers who helped us improve this document with their
comments.
REFERENCES
Aftanas, L., Varlamov, A., Pavlov, S., Makhnev, V., and
Reva, N. (2001). Affective picture processing: event-
related synchronization within individually defined
human theta band is modulated by valence dimension.
Neuroscience letters, 303(2):115–118.
Bos, D. O. et al. (2006). Eeg-based emotion recognition.
The Influence of Visual and Auditory Stimuli, pages
1–17.
Brown, L., Grundlehner, B., and Penders, J. (2011). To-
wards wireless emotional valence detection from eeg.
In 2011 Annual International Conference of the IEEE
Engineering in Medicine and Biology Society, pages
2188–2191. IEEE.
Cervantes-De la Torre, F., Gonz
´
alez-Trejo, J., Real-
Ram
´
ırez, C., and Hoyos-Reyes, L. (2013). Fractal
dimension algorithms and their application to time
series associated with natural phenomena. In Jour-
nal of Physics: Conference Series, volume 475, page
012002. IOP Publishing.
PhyCS 2017 - 4th International Conference on Physiological Computing Systems
94

Chanel, G., Ansari-Asl, K., and Pun, T. (2007). Valence-
arousal evaluation using physiological signals in an
emotion recall paradigm. In 2007 IEEE International
Conference on Systems, Man and Cybernetics, pages
2662–2667. IEEE.
Colibazzi, T., Posner, J., Wang, Z., Gorman, D., Gerber,
A., Yu, S., Zhu, H., Kangarlu, A., Duan, Y., Rus-
sell, J. A., et al. (2010). Neural systems subserving
valence and arousal during the experience of induced
emotions. Emotion, 10(3):377.
Corporation, I. (2012). Manual de usuario de IBM SPSS
Modeler 15. page 280.
Crowley, K., Sliney, A., Pitt, I., and Murphy, D. (2010).
Evaluating a brain-computer interface to categorise
human emotional response. In 2010 10th IEEE In-
ternational Conference on Advanced Learning Tech-
nologies, pages 276–278. Ieee.
Das, R., Chatterjee, D., Das, D., Sinharay, A., and Sinha,
A. (2014). Cognitive load measurement-a methodol-
ogy to compare low cost commercial eeg devices. In
Advances in Computing, Communications and Infor-
matics (ICACCI, 2014 International Conference on,
pages 1188–1194. IEEE.
Ekman, P., Friesen, W. V., O’Sullivan, M., Chan, A.,
Diacoyanni-Tarlatzis, I., Heider, K., Krause, R.,
LeCompte, W. A., Pitcairn, T., Ricci-Bitti, P. E., et al.
(1987). Universals and cultural differences in the
judgments of facial expressions of emotion. Journal
of personality and social psychology, 53(4):712.
Hamann, S. (2012). Mapping discrete and dimensional
emotions onto the brain: controversies and consensus.
Trends in cognitive sciences, 16(9):458–466.
Hosseini, S. A. and Naghibi-Sistani, M. B. (2011). Emo-
tion recognition method using entropy analysis of eeg
signals. International Journal of Image, Graphics and
Signal Processing, 3(5):30.
Levenson, R. W. (2011). Basic emotion questions. Emotion
Review, 3(4):379–386.
Lindquist, K. A., Wager, T. D., Kober, H., Bliss-Moreau, E.,
and Barrett, L. F. (2012). The brain basis of emotion: a
meta-analytic review. Behavioral and Brain Sciences,
35(03):121–143.
Liu, N.-H., Chiang, C.-Y., and Chu, H.-C. (2013). Recog-
nizing the degree of human attention using eeg signals
from mobile sensors. Sensors, 13(8):10273–10286.
Liu, Y., Sourina, O., and Nguyen, M. K. (2011). Real-
time eeg-based emotion recognition and its applica-
tions. In Transactions on computational science XII,
pages 256–277. Springer.
Maki, Y., Sano, G., Kobashi, Y., Nakamura, T., Kanoh,
M., and Yamada, K. (2012). Estimating subjective
assessments using a simple biosignal sensor. In Soft-
ware Engineering, Artificial Intelligence, Networking
and Parallel & Distributed Computing (SNPD), 2012
13th ACIS International Conference on, pages 325–
330. IEEE.
Molt
´
o, J., Monta
˜
n
´
es, S., Gil, R. P., Segarra, P., Verchili,
M. C. P., Ir
´
un, M. P. T., Ram
´
ırez, I., Hern
´
andez, M.,
S
´
anchez, M., Fern
´
andez, M., et al. (1999). Un m
´
etodo
para el estudio experimental de las emociones: el in-
ternational affective picture system (iaps). adaptaci
´
on
espa
˜
nola. Revista de psicolog
´
ıa general y aplicada:
Revista de la Federaci
´
on Espa
˜
nola de Asociaciones
de Psicolog
´
ıa, 52(1):55–87.
Nielen, M., Heslenfeld, D., Heinen, K., Van Strien, J., Wit-
ter, M., Jonker, C., and Veltman, D. Distinct brain sys-
tems underlie the processing of valence and arousal of
affective pictures. Brain and Cognition, 71(3).
Russell, J. A. and Barrett, L. F. (1999). Core affect, pro-
totypical emotional episodes, and other things called
emotion: dissecting the elephant. Journal of person-
ality and social psychology, 76(5):805.
Schafer, R. (2011). What is a savitzky-golay filter? [lec-
ture notes]. Signal Processing Magazine, IEEE,
28(4):111–117.
Siamaknejad, H., Loo, C. K., and Liew, W. S. (2014).
Fractal dimension methods to determine optimum eeg
electrode placement for concentration estimation. In
Soft Computing and Intelligent Systems (SCIS), 2014
Joint 7th International Conference on and Advanced
Intelligent Systems (ISIS), 15th International Sympo-
sium on, pages 952–955.
Sourina, O. and Liu, Y. (2011). A fractal-based algorithm of
emotion recognition from eeg using arousal-valence
model. In BIOSIGNALS, pages 209–214.
Stone, J. V. (2004). Independent Component Analysis. A
tutorial introduction. MIT Press.
Szibbo, D., Luo, A., and Sullivan, T. J. (2012). Removal of
blink artifacts in single channel eeg. In 2012 Annual
International Conference of the IEEE Engineering in
Medicine and Biology Society, pages 3511–3514.
Valenza, G., Greco, A., Lanata, A., Gentili, C., Menicucci,
D., Sebastiani, L., Gemignani, A., and Scilingo, E. P.
(2015). Brain dynamics during emotion elicitation in
healthy subjects: An eeg study. In 2015 AEIT Interna-
tional Annual Conference (AEIT), pages 1–3. IEEE.
Van Hal, B., Rhodes, S., Dunne, B., and Bossemeyer, R.
(2014). Low-cost eeg-based sleep detection. In En-
gineering in Medicine and Biology Society (EMBC),
2014 36th Annual International Conference of the
IEEE, pages 4571–4574. IEEE.
Vytal, K. and Hamann, S. (2010). Neuroimaging support
for discrete neural correlates of basic emotions: a
voxel-based meta-analysis. Journal of Cognitive Neu-
roscience, 22(12):2864–2885.
Wang, Q. and Sourina, O. (2013). Real-time mental arith-
metic task recognition from eeg signals. Neural Sys-
tems and Rehabilitation Engineering, IEEE Transac-
tions on, 21(2):225–232.
Yoon, H., Park, S.-W., Lee, Y.-K., and Jang, J.-H. (2013).
Emotion recognition of serious game players using
a simple brain computer interface. In ICT Con-
vergence (ICTC), 2013 International Conference on,
pages 783–786. IEEE.
Emotions Detection based on a Single-electrode EEG Device
95
