
A MILP Approach for the Joint Simulation of Electric Control
Reserve and Wholesale Markets
Timo Breithaupt, Thomas Leveringhaus, Torsten Rendel and Lutz Hofmann
Institute of Electric Power Systems, Leibniz Universität Hannover, Welfengarten 1, 30161 Hanover, Germany
Keywords: Electric Power Market, Electric Control Reserve Market, Power Plant Dispatch, MILP.
Abstract: A mixed integer linear programming (MILP) approach for the joint simulation of electric control reserve
and electricity wholesale markets is described. This generation dispatch model extends an existing
integrated grid and electricity market model covering the Continental European electric power system. By
explicitly modelling the markets for primary and secondary control reserve, the model can reproduce the
decisions of generating unit operators on which markets to get involved. Besides, the introduction of
integrality conditions allows considering start-up costs and the calculus of generating units to pass through
economically unattractive periods with low or even negative prices in order to avoid another start-up.
Finally, the MILP approach allows to consider the fact that primary and secondary control reserves
provision usually requires operation of the respective generating unit and to fully include storages into the
optimization problem. In this paper, the generation dispatch model is described in detail, key assumptions
are presented and the implementation status is explained.
1 INTRODUCTION
The electric power system in Europe currently
experiences a strong transition. Political objectives
promote the, often decentralized, generation of
electrical energy from renewable energy sources
(RES), the liberalization of power markets and
cross-border trading and – in some countries – the
decrease of nuclear power generation. The resulting
system is characterized through high volatility in
generation (esp. by wind and photovoltaics),
increasing cross-border trading, an increasing
number of atypical market situations with very low
or even negative electricity prices (esp. in Germany
(Genoese et.al, 2010)) and in some cases high grid
expansion requirements in all voltage levels.
In order to analyze this transition scientifically,
e.g. in terms of generation dispatch, electricity
prices, load flows, and grid expansion demand, an
integrated grid and electricity market model (IGEM)
has been developed to simulate current and future
electric power supply scenarios. The model focusses
on the interconnected transmission grid of
Continental Europe, but can also be used to analyze
other regions, if respective data is provided and
possibly existing differences in market structures are
taken into account.
More and more, the liberalization finds its way
into the markets for primary control reserve (PCR)
and secondary control reserve (SCR). In the past, the
provision of PCR and SCR by large power plants
was instructed by the responsible transmission
system operator (TSO). Nowadays, local
liberalization leads to a market based allocation of
PCR and SCR in some European countries, while in
other countries the provision of PCR and SCR is still
instructed by the responsible TSO (ENTSO-E,
2015). Driven by the new ENTSO-E (European
Network of Transmission System Operators for
Electricity) Network Codes (ENTSO-E, 2017), the
provision of PCR and SCR will be liberalized
further and cross-border trading of PCR and SCR
shall be made possible (in fact it is already practiced
between some countries, e.g. between Germany and
several neighboring countries within the framework
of the International Grid Control Cooperation
(50Hertz Transmission et.al., 2014)).
In this paper, a method for the joint simulation of
electricity wholesale market and the markets for
PCR and SCR is developed and on this basis an
extension of the generation dispatch module of
IGEM is presented. While the existing module takes
into account only the electricity wholesale market
formulated as a linear programme, the new module
314
Breithaupt, T., Leveringhaus, T., Rendel, T. and Hofmann, L.
A MILP Approach for the Joint Simulation of Electric Control Reserve and Wholesale Markets.
DOI: 10.5220/0006441203140322
In Proceedings of the 7th International Conference on Simulation and Modeling Methodologies, Technologies and Applications (SIMULTECH 2017), pages 314-322
ISBN: 978-989-758-265-3
Copyright © 2017 by SCITEPRESS – Science and Technology Publications, Lda. All rights reserved
presented shall broaden the focus with respect to
the calculus of generating units that their costs
can be covered by revenues not only from the
wholesale market but also by providing PCR
and SCR,
the fact that for the provision of PCR and SCR
power plant operation normally is necessary,
power plants passing through pricewise
unattractive periods to avoid start-up costs,
and
a better representation of storages.
The existing model of IGEM described in
(Rendel, 2012) and (Rendel, 2015) is therefore
replaced by a mixed integer linear programming
(MILP) model including PCR and SCR dispatch.
Within this model, the generation dispatch is
calculated considering the interdependencies
between the different markets, cross-border trading
and storages for the whole period under
consideration.
The next chapter gives a brief overview about the
European power system, IGEM and key assumptions
for the generation dispatch module. In chapter 3, the
MILP approach for the generation dispatch module
is described in detail. Chapter 4 describes the
implementation status. The paper closes with a
conclusion and a description of further work
(chapter 5).
2 SIMULATION ENVIRONMENT
AND KEY ASSUMPTIONS
2.1 Simulation Environment
The area covered by IGEM nearly matches the
synchronous ENTSO-E grid area “Continental
Europe”, which reaches from Portugal in the West to
Romania in the East and from Denmark in the North
to Greece in the South and comprises 42 TSOs. To
facilitate changes and extensions, the whole model is
built modularly.
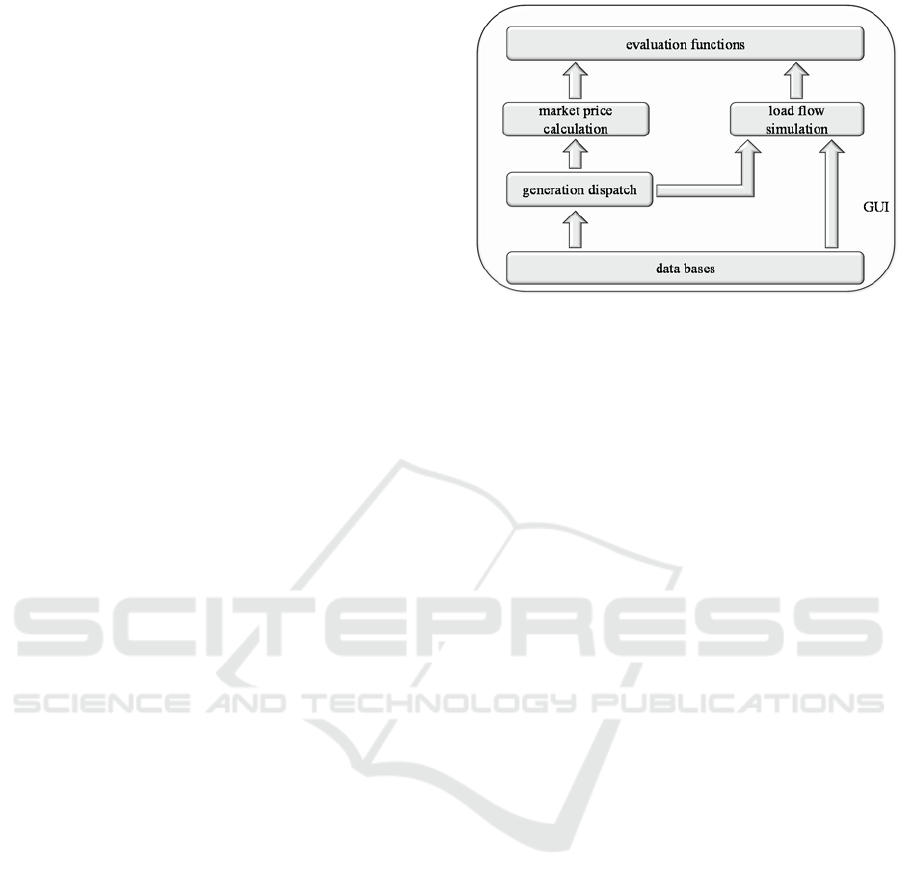
The basic model structure including the
generation dispatch module presented in this paper is
shown in Figure 1. The model is based on several
data bases comprising, among others, power plant
data, grid data, load data, feed-in time series of RES,
population data, market information, economic
indices and geographical data. Reference year for all
data presented in this paper is the year 2011. The
data is currently being updated to the reference year
2014, though.
Figure 1: Basic structure of IGEM.
The power plant data base contains about 1700
power plants and 500 storages with explicit position
data and about 3100 other entries with regionally
aggregated installed capacity of decentralized
generation. The level of regional aggregation is
determined by the data available. Depending on
availability, further information, such as energy
source, maximum capacity, year of construction and
efficiency (which is estimated using literature
values), is covered (Rendel, 2015). For generating
units with variable primary energy source, such as
wind, PV and hydro power plants, time series of
available energy for different geographical regions
are used (Rendel, 2015).
Load flow simulations are carried out using the
complete Newton Raphson load flow iteration and
are built on results of the generation dispatch.
Among others, modules to assign load, generation of
conventional power plants and generation of RES to
grid nodes are implemented. As different markets
are involved in the generation dispatch, the market
prices are no result of the dispatch module but have
to be calculated in a separate module.
Beyond that, for efficient usage IGEM has a
graphical user interface (GUI) and evaluation
functions such as to display generation dispatch,
electricity prices or power line utilization.
2.2 Key Assumptions
The model presented in this paper is based on the
following key assumptions:
The actual generation dispatch in Europe is
economically optimal.
Energy costs of PCR and SCR can be
considered indirectly.
All non-linear relations can be linearized or
neglected.
A MILP Approach for the Joint Simulation of Electric Control Reserve and Wholesale Markets
315

PCR and SCR can be allocated to generating
units on hourly basis.
Below, these assumptions are explained in more
detail and a brief description of the underlying
system is given.
In the countries covered by IGEM, the details of
the electricity wholesale markets (hereafter active
power market for a better differentiation to PCR and
SCR markets) differ, e.g. in terms of product
specifications, trading times and RES integration.
PCR and SCR provision is allocated partly market
based and partly determined by the relevant TSOs.
Additionally, not the generating units themselves but
their operators, who often operate several units and
have various contractual connections amongst each
other, are the market participants. However, these
structures are widely unknown. Assuming a market
driven cost optimal generation dispatch with respect
to active power production and PCR and SCR
provision enables abstraction from these details,
since a global optimization (cost minimization) with
an appropriate model time step (currently one hour)
produces the same results.
PCR and SCR are the main instruments of TSOs
to react on frequency deviations caused by
imbalances between load and generation by
counteracting these imbalances. While PCR is
designed for the first, very fast reaction within 30
seconds after the imbalance occurred; SCR is
designed to displace PCR within 15 minutes. There
are two types of costs related to PCR and SCR. The
provision of PCR and SCR results in capacity costs
caused by a more inefficient generation dispatch
compared to a dispatch only considering active
power production. The activation of PCR and SCR
results in energy costs for the additional infeed of
positive or negative power. These energy costs can
either be positive or negative. More information
about the approach to consider these costs in the
dispatch model is given in chapter 3. The provision
of tertiary control reserve (TCR), designed to
displace SCR currently is out of focus of IGEM, as
the requirements for TCR provision allow start-ups
for several types of power plants.
The electric power system is a complex techno-
economic system with various nonlinear
relationships. For instance, the efficiency of power
plants depends on the power output and can be
influenced by PCR provision, and start-up costs of
thermal power plants depend on the period of
idleness. Nevertheless, these relationships are
neglected or linearized in order to reduce model
complexity and to enable the deployment of highly
specialized MILP solvers.
Typically, PCR and SCR provision is allocated
for periods of several hours up to several days or
weeks. As already mentioned above, the relevant
market participants are generating unit operators
with various contractual relations amongst each
other and often operating several units. Therefore, it
is assumed that the operators allocate PCR and SCR
provision to the single generating units in an optimal
way for each model time step.
3 GENERATION DISPATCH
MODEL
Below, the generation dispatch model is described
according to the following convention: Vector
variables are lowercased and bold, matrices
uppercased and bold and scalars either uppercased or
lowercased, following given conventions, but not
bold. All variables are italicized. Variable indices
are italicized (e.g.
t
for different points in time),
notation indices are upright.
3.1 Objective Function
The optimization problem is formulated as
minimization of the total variable costs of electric
power production for the period under consideration
as shown in (1). Fixed costs are disregarded, as they
are not relevant for short-term operational planning.
T
min
f
x
(1)
The vector of optimization variables x consists
of three groups of variables representing all
generating devices except for storages (PP – power
plants), storages (STO) and power trade (T) for each
point in time.
TT T
PP S O
T
TT
[]xxxx
(2)
Power plants are described by their active
power (AP) production (
AP,PP
p
), a binary variable
indicating their operating status (
PP
op ), a binary
variable indicating whether they start-up at the
respective point in time (
PP
st
), and the symmetrical
(i.e. PCR can only be provided in positive and
negative direction) primary control reserve (
PCR,PP
p
),
positive secondary control (
SCRpos,PP
p
) and negative
secondary control (
SCRnegPP
p
) reserve provided:
SIMULTECH 2017 - 7th International Conference on Simulation and Modeling Methodologies, Technologies and Applications
316

TTTTTT
PP AP,PP PP PP PCR,PP SCRpos,PP
T
SCRnegPP
xpopstpp
p
(3)
Contrary to power plants, storages have two
operating modes that have to be considered
separately, because they partially differ in key
factors, such as efficiency and maximum capacity.
Therefore, the variables used to describe power plant
operation exist for each mode – storage mode
(STOin) and generating mode (STOout). However,
some adaptions are necessary to account for the
specifics of storages:
While PCR as a symmetrical product is
represented by one variable in power plant
modelling, the total PCR of storages can be
composed of different variables for both operating
modes. For instance, a storage in generating mode
with little load can provide negative PCR not only
by reducing its generation but also by switching to
storage mode. Further differences are the neglect of
start-up costs and a variable representing the state of
charge:
TT T TT
STO AP,STOout AP,STOin STOout STOin
TTT
PCRpos,STOout PCRpos,STOin PCRneg,STOout
TT T
PCRneg,STOin SCRpos,STOout SCRpos,STOin
TTT
SCRneg,STOout SCRneg,STOin STO
xp popop
ppp
pp p
ppe
(4)
Power trading (T) is modelled separately for AP,
PCR, SCRpos and SCRneg. Active power trading is
defined between different bidding zones (market
area for AP, often identical to countries) and control
reserve trading between control zones (area for
which PCR and SCR has to be provided, often
identical to area controlled by a TSO). These zones
can be, but do not have to be identical:
TTTT T
T T,AP T,PCR T,SCRpos T,SCRneg
xppp p
(5)
The coefficients of the objective function are
grouped in the same way as the optimization
variables:
TT TT
PP STO T
[]
ffff
(6)
The PP coefficients are given in (7). The costs
essentially determining the power plant dispatch are
the marginal costs
mc and the start-up costs
st
.
Marginal costs are the derivation of the total cost
function and therefore contain only variable cost
elements, essentially fuel costs and carbon dioxide
emission costs. Start-up costs incur for the start-up
of thermal power plants. These power plants require
a certain time up to several hours to heat up and
begin effective operation.
It is assumed that PCR does not cause any costs
directly, because it can only be offered
symmetrically by power plants, and frequency
deviations occur in both directions. Though, the
need for PCR and SCR provision causes costs
indirectly, as it changes the power plant dispatch
towards a more cost intensive state. The coefficients
for SCRpos and SCRneg shall cover the fact that the
activation of positive SCR directly generates costs
and the provision of negative SCR saves costs. The
costs depend on the deployment probability, which
in turn depends on the composition of the pool
providing SCR which cannot be considered within
this linear model. Therefore, an ordinal scale (
os ) is
introduced. This scale, calculated as a share of the
marginal costs, enables the optimizer to choose the
power plants with the relatively lowest costs for
SCR provision without knowing the exact costs.
However, these SCR costs can theoretically bias the
whole generation dispatch and should therefore be
set as close as possible to the real costs.
TT TT T TT
PP
-
00fmcscosos
(7)
Storages have no direct costs in the objective
function. They provide flexibility between different
points in time to the optimizer and can be used to
reduce the total costs in the period under
consideration:
TTTTT
STO
TTTTTT
TTT
0000000000
000
f
(8)
Power trade is also not represented with direct
costs in the objective function. It provides flexibility
between different bidding zones (AP) respectively
control zones (PCR and SCR) and can be used to
reduce the costs within each point in time by a more
efficient dispatch. In case of additional direct costs
for the use of power lines connecting different
bidding zones or control areas, they can be
considered with these coefficients, though:
TTTTT
T
0000f
(9)
All vector elements of
PP
x and
PP
f
are
structured as shown in (10). Each power plant
n is
represented with an own optimization variable and
its coefficient for each point in time
t
. The total
number of power plants is
N
. The model considers
T
different points in time.
A MILP Approach for the Joint Simulation of Electric Control Reserve and Wholesale Markets
317

AP,PP,1,1
AP,PP,2,1
AP,PP,1,2
AP,PP
AP,PP, ,
AP,PP, ,
nt
NT
P
P
P
P
P
p
(10)
All vector elements of
STO
x and
STO
f are
structured as shown in (11). Each storage
s
is
represented with an own optimization variable and
its coefficient for each point in time
t
. The total
number of storages is
S
.
AP,STOout,1,1
AP,STOout,2,1
AP,STOout,1,2
AP,STOout
AP,STOout, ,
AP,STOout, ,
s
t
ST
P
P
P
P
P
p
(11)
All vector elements of
T
x and
T
f
are structured
as shown in (12) depending on whether trade is
defined between bidding zones or control areas.
Each combination of exporting bidding zone
bze
(respectively exporting control area
cae ) and
importing bidding zone
bzi
(respectively importing
control area
cai
) is represented with an own
optimization variable and its coefficient for each
point in time
t
. The total number of bidding zones
is
BZ
(respectively
CA
for control areas).
T,AP,1,1,1 T,PCR,1,1,1
T,AP,2,1,1 T,PCR,2,1,1
T,AP,1,2,1 T,PCR,1,2,1
T,AP T,PCR
T,AP, , ,1 T,PCR, , ,1
T,AP, e, , T,PCR, e, ,
T,AP, , , T,PCR
;
BZ BZ CA CA
bz bzi t ca cai t
BZ BZ T
PP
PP
PP
PP
PP
PP
pp
,,,CA CA T
(12)
3.2 Lower and Upper Bounds
The lower (
lb
) and upper bounds (
ub
) of the
optimization variables as defined in (13) are given in
(14). They are structured in the same way as the
optimization variables and therefore are time-
dependent. Most of the bounds represent technical
limits of the modelled system respectively its
components. Each power plant and storage is
designed for certain operating ranges which cannot
be violated. In three cases, the upper bound is
infinite (
Inf ), because it is defined in inequality
constraints. Power trading is limited by the cross-
border trading capacities. The binary optimization
variables defined in (15) are bound by zero and one.
The remaining variables are continuous.
lb x ub
(13)
3.3 Inequality Constraints
The total power generation of a power plant
n
must
not exceed its rated power
r,PP, ,nt
P . The possible
activation of positive PCR and SCR has to be
considered by adding the PCR and SCRpos
provision to the active power generation as given in
(16).
Equation (17) forces the binary variable
PP, ,nt
op
to take the value one whenever the power plant
generates active power or provides PCR, as PCR
provision is not possible without power plant
operation. The provision of positive SCR generally
is allowed in standstill given that the power plant is
able to start-up quickly enough. Whether operation
is necessary for SRCpos provision is considered by
the coefficient
SCR,PP, ,nt
on , taking the value 1 in case
operation is necessary and zero in case it is not.
SIMULTECH 2017 - 7th International Conference on Simulation and Modeling Methodologies, Technologies and Applications
318

PCRmax,PP
SCRposmax,PP
SCRnegmax,PP
PCRmax,STOout
PCRmax,STOin
PCRmax,STOout
P
STOmin
;
Inf
p
p
p
Inf
Inf
p
p
lb ub
p
p
e
0
1
0
1
0
0
0
0
0
0
1
0
1
0
0
0
0
0
0
0
0
0
0
0
0
0
CRmax,STOin
SCRposmax,STOout
SCRposmax,STOin
SCRnegmax,STOout
SCRnegmax,STOin
STOmax
Tmax,AP
Tmax,PCR
TmaxSCRpos
Tmax,SCRneg
p
p
p
p
e
p
p
p
p
(14)
PP PP STOout STOin
,;,
NT ST
op st op op
(15)
AP,PP, , PCR,PP, , SCRpos,PP, , r,PP, ,
,
nt nt nt nt
PP P P
1, 2,..., , 1, 2,...,nNtT
(16)
AP,PP, , r,PP, PP, , PCR,PP, ,
SCR,PP, , SCRpos,PP, ,
0,
nt n,t nt nt
nt nt
PPopP
on P
1, 2,..., , 1, 2,...,nNtT
(17)
Most power plants must not fall below a
minimum generation limit for technical reasons.
Therefore, (18) defines
min, PP, ,nt
P as lower bound for
active power generation in case the power plant is in
operation. As the minimum generation is also valid
during (negative) PCR or SCRneg activation, their
provision is added to
min, PP, ,nt
P .
AP,PP, , min,PP, , PP, , PCR,PP, ,
SCRneg,PP, ,
-
0, 1, 2,..., , 1,2,...,
nt nt nt nt
nt
PPopP
P
nNtT
(18)
Start-ups are recognized by means of (21).
Whenever the binary variable
PP, ,nt
op changes from
zero to one between two consecutive points in time,
the binary variable
PP, ,nt
st takes the value one for the
respective power plant and point in time. For the
first point in time the variable is set by (19) and (20),
depending on the starting condition
1,n
c .
PP, ,1 PP, ,1 1,
, 1,2,...,
nnn
op st c n N
(19)
PP, ,1
1,
PP, ,1
if 0, 1, 2,...
1
if 1, 1,2,...
0
n
n
n
s
tnN
s
tnN
c
(20)
PP, , 1 PP, , PP, ,
-0,
nt nt nt
op op st
1, 2,..., , 2,3,...,nNtT
(21)
Equations (22) and (23) correspond to (16) but
are formulated separately for each operating mode of
storages. As already mentioned above, PCR is
divided into PCRpos and PCRneg for storages,
because provision can include change in operating
mode.
AP,STOout, , PCRpos,STOout , , SCRpos,STOout, ,
r,STOout, ,
, 1, 2,..., , 1, 2,...,
s
tstst
st
PP P
Ps StT
(22)
AP,STOin, , PCRneg,STOin, , SCRneg,STOin, ,
r,STOin, ,
, 1, 2,..., , 1, 2,...,
s
tstst
st
PP P
Ps St T
(23)
Corresponding to (17), (24) and (25) set
STOout, ,
s
t
op respectively
STOin, ,
s
t
op to one, whenever
the storage generates (stores) active power or
provides PCR in generating (storage) mode.
Similarly to (17), SCR is only considered, if the
associated coefficient is one.
AP,STOout, , r,STOout, , STOout, ,
PCR,STO, , PCRpos,STOout, ,
SCRpos,STO, , SCRpos,STOout, ,
0,
s
tstst
st st
st st
PPop
on P
on P
1, 2,..., , 1, 2,...,
s
St T
(24)
AP,STOin, , r,STOin, , STOin, ,
PCR,STO, , PCRneg,STOin, ,
SCRneg,STO, , SCRneg,STOin, ,
0,
st st st
st st
st st
PPop
on P
on P
1, 2,..., , 1, 2,...,
s
St T
(25)
Equations (26) and (27) correspond to (18).
Whenever the storage generates or stores active
power, the minimum generation respectively storage
A MILP Approach for the Joint Simulation of Electric Control Reserve and Wholesale Markets
319

must be exceeded. Additional provision of PCR and
SCR is considered analogously to (18).
AP,STOout, , min,STOout, , STOout, ,
PCRneg,STOout, , SCRneg,STOout, ,
-
0,
s
tstst
st st
PPop
PP
1, 2,..., , 1, 2,...,
s
St T
(26)
AP,STOin, , min,STOin, , STOin, ,
PCRpos,STOin, , SCRpos,STOin, ,
-
0,
st st st
st st
PPop
PP
1, 2,..., , 1, 2,...,
s
St T
(27)
Depending on the storage technology and its
design, storages are able to operate in generating and
storage mode in parallel. Whether this is possible for
certain storages is indicated by the parameter
STO, ,
s
t
pop
in (28).
STOout,, STOin,, STO,,
1,
s
tst st
op op pop
1, 2,..., , 1, 2,...,
s
St T
(28)
3.4 Equality Constraints
The electric load in each bidding zone
L, ,bz t
P must be
covered for each point in time following (29). The
load is virtually increased by exports and storages in
storage mode. It can be covered by active power
generation of power plants and storages as well as
by imports. The power plants and storages are
assigned to the bidding zone (control zone) they are
located in by the respective element
,nbz
pbi (
,
s
bz
s
bi )
of a power-plant-bidding-zone (storage-bidding
zone) incidence matrix
P
BI
(
SBI
). The elements
of this
NBZ
- (
SBZ
-) matrix are one if the
power plant
n
(storage
s
) is located in bidding
zone
bz
, otherwise they are zero .
11
1
,AP,PP,, ,AP,STOout,,
,AP,STOin,, T,AP,,,
T,AP, , ,
1
L, ,
1
,
NS
ns
SBZ
sbzi
bze bz
B
nbz nt sbz st
s
bz s t bze bzi t
bze bzi
Z
bze
bz
t
ibz
bz t
pbi P sbi P
sbi P P
PP
1, 2,..., ; 1, 2,...,bz BZ t T
(29)
Equations (30) to (32) correspond to (29). They
ensure an even balance between PCR, SCRpos and
SCRneg provision and demand for each control area.
Consequently, elements of the power-plant-control-
area (
P
CI
) and the storage-control-area incidence
matrix
SCI
are used. They can be built analogously
to the matrices used in (29).
, PCR,PP, , , PCRpos,STOout, ,
, PCRpos,STOin, , T,PCR, , ,
T,PC
11
11
1
R, , , PCRref, ,
,
nca nt sca st
sca st caec
NS
ns
SCA
scai
cae ca
CA
cae
cai ca
ai t
cae cai t ca t
pci P sci P
sci P P
PP
1, 2,..., ; 1, 2,...,ca CA t T
(30)
11
1
, SCRpos,PP, , , SCRpos,STOout, ,
, SCRpos,STOin, , T,SCRpos, , ,
T,SCRpos, , , SC
1
1
Rposref, ,
,
nca nt sca st
s
ca s t cae cai t
cae cai t ca
NS
ns
SCA
scai
cae ca
CA
cae
cai ca
t
pci P sci P
sci P P
PP
1, 2,..., ; 1, 2,...,ca CA t T
(31)
11
1
, SCRneg,PP, , , SCRneg,STOout , ,
,SCRneg,STOin,, T,SCRneg,,,
T,SCRneg, , , SC
1
1
Rnegref, ,
,
nca nt sca st
s
ca s t cae cai t
cae cai t ca
NS
ns
SCA
scai
cae ca
CA
cae
cai ca
t
pci P sci P
sci P P
PP
1, 2,..., ; 1, 2,...,ca CA t T
(32)
As already mentioned above, PCR must be
provided symmetrically by each generating unit. The
equality between positive and negative PCR
provided by storages is ensured by (33).
PCRpos,STOout , , PCRpos,STOin, ,
PCRneg,STOout, , PCRneg,STOin, ,
0,
st st
st st
PP
PP
1, 2,..., , 1,2,...,
s
St T
(33)
Beside power plant start-ups and the
corresponding start-up costs, the state of charge of
storages links the different points in time which
could otherwise be considered independently. The
variation in the state of charge for each storage
(defined at the end of each point in time
t
) is
represented by (34) and (35). Specific values for
start and end point (
STO,start,
s
E and
STOend,
s
E ) are
SIMULTECH 2017 - 7th International Conference on Simulation and Modeling Methodologies, Technologies and Applications
320

included by (34) and (36), while (36) is optional.
Active power generation reduces the state of charge
of the storage, active power storage increases it. For
both operating modes, the efficiency of the
respective mode (
STOout, ,
s
t
,
STOin, ,
s
t
) has to be
considered. Additionally, the state of charge is
reduced by SCRpos activation and increased by
SCRneg activation. As already mentioned above, the
individual deployment probability cannot be
modelled in this linear model. Therefore, the SCR
provision is multiplied by an activation coefficient (
SCRpos
ac
,
SCRneg
ac
) calculated as the historical mean
value of SCRpos respectively SCRneg activation
relative to the historical provision. Finally,
tributaries or outlets (water storages) or state-of-
charge-independent losses can be taken into account
by
STOtri, ,
s
t
E . The model time step
t
is used to
convert between power and energy.
AP,STOout, ,1
STOout, ,1
STOin, ,1 AP,STOin,s,1
SCRpos SCRpos,STOout, ,1
STOout, ,1
SCRpos STOin, ,1 SCRpos,STOin, ,1
SCRneg SCRneg,STOout, ,1
STOout, ,1
SCRneg STOin, ,1 SCRneg,STOin, ,
1
-
1
1
s
s
s
s
s
ss
s
s
ss
P
P
ac P
ac P
ac P
ac P
1
STO, , STOtri, ,1 STO,start,
-,
s
ts s
EEE
ttt
(34)
4 IMPLEMENTATION STATUS
The generation dispatch model described in this
paper has been implemented using Gurobi Optimizer
and is currently being tested. Additionally, functions
reducing the optimization variables (e.g. by pooling
generation with identical or similar properties within
the same bidding zone and control area, mainly RES
generation) and to calculate valid start values for the
optimization have been implemented.
It is intended to simulate periods of one year
with IGEM, as this period corresponds to most of
the available statistical data. Beyond that, there are
typical cycles within the electric power system,
mainly influenced by the climate, that can only be
fully covered by considering whole years, for
instance the use of hydro storage power plants (not
pumped-storage power plants) filled in winter and
spring to generate power in summer and fall.
In the current implementation status the
simulation of a whole year formulated as a single
optimization problem is too computationally
expensive. Therefore, shorter, overlapping periods
are optimized and then combined. It is assumed that
the horizon for operational planning of generating
units apart from hydro storage plants is significantly
shorter than one year. This is currently being
investigated by comparison of results for periods of
different length. However, this approach requires a
separate strategy for hydro storage plants which is
currently being investigated.
AP,STOout, ,
STOout, ,
STOin, , AP,STOin,s,
SCRpos SCRpos,STOout, ,
STOout, ,
SCRpos STOin, , SCRpos,STOin, ,
SCRneg SCRneg,STOout, ,
STOout, ,
SCRneg STOin, , SCRneg,STOin, ,
1
-
1
1
st
st
st t
s
t
st
st st
s
t
st
st s
P
P
ac P
ac P
ac P
ac P
STO, , STO, , STOtri, ,
-,
t
s
tst st
EE E
tt t
1, 2,..., , 2,3,...,
s
St T
(35)
STO, , STOend,
,1,2,...,
sT s
EEs S
1, 2,..., , 2,3,...,
s
St T
(36)
5 CONCLUSIONS
A MILP approach for a generation dispatch module
for an integrated grid and electricity market model
covering the Continental European electric power
system has been presented. Beside the electricity
wholesale market, the model covers the markets for
PCR and SCR. By this, the model reproduces the
decisions of generating unit operators on which
markets to get involved. Besides, the introduction of
integrality conditions allows to consider start-up
costs and the calculus of generating units to pass
through pricewise unattractive periods in order to
avoid another start-up. Finally, the MILP approach
allows to consider the fact that PCR and SCR
provision usually requires power plant operation and
to fully include storages into the optimization
problem.
A MILP Approach for the Joint Simulation of Electric Control Reserve and Wholesale Markets
321

The fundamental assumption justifying the
chosen modelling approach is a perfect allocation at
the existing power markets. This implies that a
global optimization – namely a minimization of all
variable costs in the period of consideration –
reproduces the power market results in terms of
generation dispatch, disregarding different products
and trading periods. As the results combine
considerations about several markets, no market
price can be derived directly from them. The
different prices have to be calculated in another
module of IGEM.
The generation dispatch module has been fully
implemented into IGEM. First results are plausible.
Though, improvements are required to simulate one
full year formulated as single optimization problem.
In future work, decomposition strategies and
heuristics focusing on the coupling between bidding
zones and different points in time will be evaluated
with respect to a possible reduction of the
computational effort, a market price calculation
module will be implemented, and the simulation
results will be evaluated by comparison to real
market results.
REFERENCES
50Hertz Transmission GmbH, Amprion GmbH, Elia
System Operator NV, TenneT TSO B.V., TenneT
TSO GmbH, TransnetBW GmbH, 2014. Potential
cross-border balancing cooperation between the
Belgian, Dutch and German electricity Transmission
System Operators. Available at:
www.regelleistung.net.
European Commission (EC), 2017. Final Draft of
Commission Regulation (EU) on Establishing a
Guideline on Electricity Balancing. Available at:
www.entsoe.eu.
European Network of Transmission System Operators for
Electricity, 2015. Survey on Ancillary Services
Procurement, Balancing Market Design 2014.
Available at: www.entsoe.eu.
Genoese, F., Genoese, M., Wietschel, M., 2010.
Occurrence of negative prices on the German spot
market for electricity and their influence on balancing
power markets. 2010 7th International Conference on
the European Energy Market, Madrid, pp. 1-6.
Rendel, T., 2015. Erweiterung und Plausibilisierung eines
Modells für die integrierte Simulation des
europäischen Verbundnetzes und Strommarktes.
Verlag Dr. Hut, München.
Rendel, T., Rathke, C., Breithaupt, T., Hofmann, L., 2012.
Integrated grid and power market simulation. 2012
IEEE Power and Energy Society General Meeting,
San Diego, CA.
SIMULTECH 2017 - 7th International Conference on Simulation and Modeling Methodologies, Technologies and Applications
322
