
Feature Extraction from sEMG of Forearm Muscles, Performance
Analysis of Neural Networks and Support Vector Machines for
Movement Classification
Luis Morales and Jaime Cepeda
Departamento de Automatización y Control Industrial, Escuela Politécnica Nacional Ladrón de Guevara,
E11-253, Quito, Ecuador
Keywords: Support Vector Machines, Feedforward Neural Networks, Pattern Recognition, EMG Signals, Feature
Extraction.
Abstract: The propose of this work is to extract different features from surface EMG signals of forearm muscles such
as MAV, RMS, NZC, VAR, STD, PSD, and EOF's. Signals are acquired through 8 channels from "Myo
Armband" sensor that is placed in the forearm of the human being. Then, identification and classification of
5 types of movements are done, including open hand, closed hand, hand flexed inwards, out and relax position.
Classification of the movement is performed through machine learning and data mining techniques, using two
methods such as Feedforward Neural Networks and Support Vector Machines. Finally, an analysis is done to
identify which features extracted from the sEMG signals and which classification method present the best
results.
1 INTRODUCTION
Nowadays advances in robotics have made life easier
for human beings, both domestically and industrially.
An application of the first one, is to assist people with
different types of disabilities, helping them to lead
their lives in the most normal way possible.
Specifically, in the case of people who have suffered
the loss of a superior member such as the amputation
of a hand, it is indispensable that the disabled person
recovers the ability to take or manipulate objects. The
muscular groups present in the forearm of the human
being are directly related to the different states of the
hand (Khushaba, Al-Timemy, Kodagoda, and
Nazarpour, 2016), for example, completely open,
closed, flexed inwards, flexed out, relax position, etc.
The surface EMG can be measured easily and
non-invasively (Nakajima, Keeratihattayakorn,
Yoshinari, and Tadano, 2014), through the use of dry
sensors, which measure the potentials generated by
muscle contractions. EMG signals are widely used to
perform medical diagnoses (Abel, Zacharia, Forster,
and Farrow, 1996), as well as to determine
movements of the upper limbs and thus control hand
prosthetics (Kawano and Koganezawa, 2016). With
multisensory information is possible identify human
hand motion via feature extraction and classification
(Ju and Liu, 2014)(Ju, Ouyang, Wilamowska-Korsak,
and Liu, 2013). There are different studies that have
allowed the estimation of mathematical models that
establish the generation of potentials in muscle
groups as in the case of those belonging to the
forearm, to study its behavior and its mechanism
which may be potentially used for assessment or
neuromuscular rehabilitation (Nakajima et al., 2014).
Other studies have focused on identifying different
states of the hand through myoelectric sensors placed
in the forearm, to control robotic prostheses
establishing states of supination, pronation, open and
closed hand, this through the classification of the
signals through the harmonic wavelet packet
transform (Wang, Zhiguo, Xiao, Hongbo, and
Zhizhong, 2006), and detection of the angle of the
hand, considering the position of relax, semi-flexed
and flexed to replicate those movements in an
orthopedic hand that may be useful for rehabilitation
(Kavya, Dhatri, Sushma, and Krupa, 2015), the
classification of these states is done through Support
Vector Machines (SVM). The force generated
between each of the fingers and the thumb is also
considered to determine the behavior of EMG signals
of the forearm (16 channels) and its relation to these
254
Morales, L. and Cepeda, J.
Feature Extraction from sEMG of Forearm Muscles, Performance Analysis of Neural Networks and Support Vector Machines for Movement Classification.
DOI: 10.5220/0006429402540261
In Proceedings of the 14th International Conference on Informatics in Control, Automation and Robotics (ICINCO 2017) - Volume 1, pages 254-261
ISBN: 978-989-758-263-9
Copyright © 2017 by SCITEPRESS – Science and Technology Publications, Lda. All rights reserved
movements which may be useful to identify precise
movements (Fang, Ju, Zhu, and Liu, 2014), and may
help identify which muscle group interacts in greater
proportion with each of these movements. There are
a lot of features that can be obtained from the signals
in time, frequency and wavelet domain. (Boostani and
Moradi, 2003), studying which of them improves the
results in the classification process.
This work proposes to identify and classify 5
types of movements, including
open hand, closed hand,
hand flexed inwards and flexed out and relax position,
through different patterns such as: Mean Absolute
Value “MAV”, Root Mean Square “RMS”, Number
Zero Crossing “NZC”, Variance “VAR”, Standard
Deviation “STD”, Power Spectral Entropy “PSD”,
and Empirical Orthogonal Functions “EOF's”,
extracted from the surface myoelectric signals in 8
channels from "Myo Armband" sensor that is placed
in the forearm of the human being. Classification of
the movement is performed through machine learning
and data mining techniques, using two methods such
as Neural Networks and Support Vector Machines,
finally an analysis is done to identify which pattern
extracted from the signal and which method of
classification present the best results, through
subjects/users of training and test groups.
2 METHODOLOGY
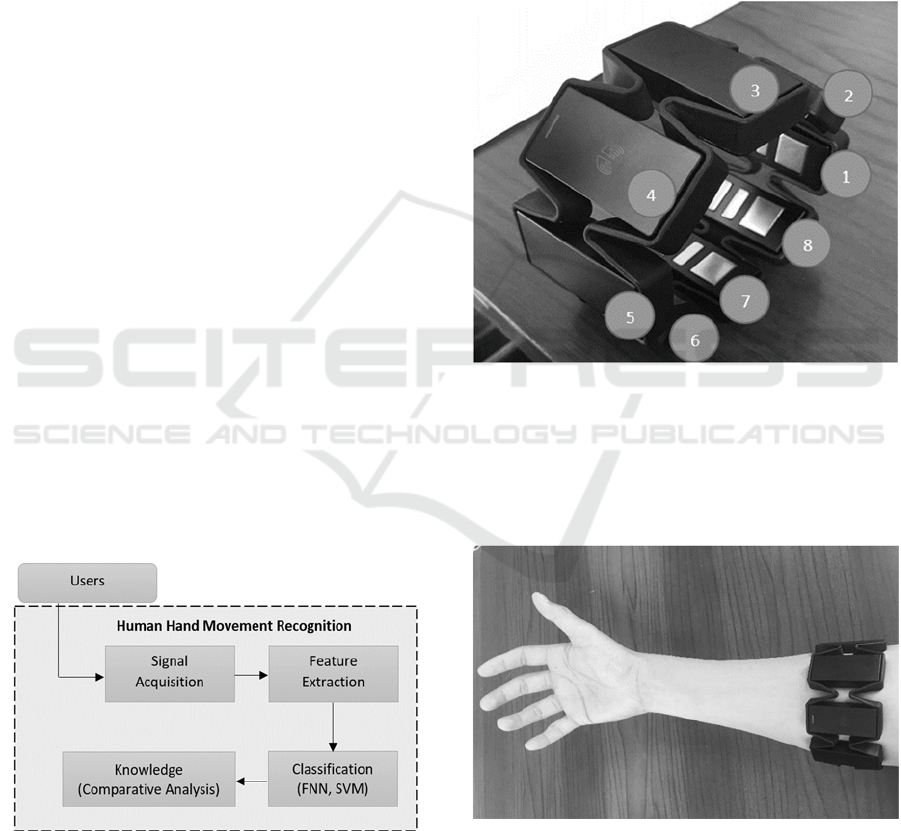
The system to be tested consists of the steps shown in
Figure 1, for the proposed analysis using different
features extracted for the sEMG signals, and
classified by two methods such as Feedforward
Neural Networks and Support Vector Machines.
Figure 1: Scheme of the proposed approach.
2.1 Signal Acquisition
In this work is performed feature extraction and
pattern recognition of a sEMG signals from the
forearm to identify different class of movements.
Signals are acquired using “Myo Armband” sensor,
which is a gesture recognition device worn on the
forearm and manufactured by Thalmic Labs. It uses a
set of electromyographic sensors that sense electrical
activity in the forearm muscles, combined with a
gyroscope, accelerometer and magnetometer to
recognize gestures.
The sensor consists of 8 channels (Figure 2) to
acquire the myoelectric signals of muscles of the
forearm from users/subjects.
Figure 2: Myo Armband Sensor and its channels.
This sensor allows to know the myoelectric
signals of the muscular groups present in the forearm
(Figure 3), the signals are acquired at a sampling
frequency of 200 Hz, and are normalized to values
between -1 and 1 as shown in Figure 4.
Figure 3: Positioning the sensor for signals acquisition.
Feature Extraction from sEMG of Forearm Muscles, Performance Analysis of Neural Networks and Support Vector Machines for
Movement Classification
255
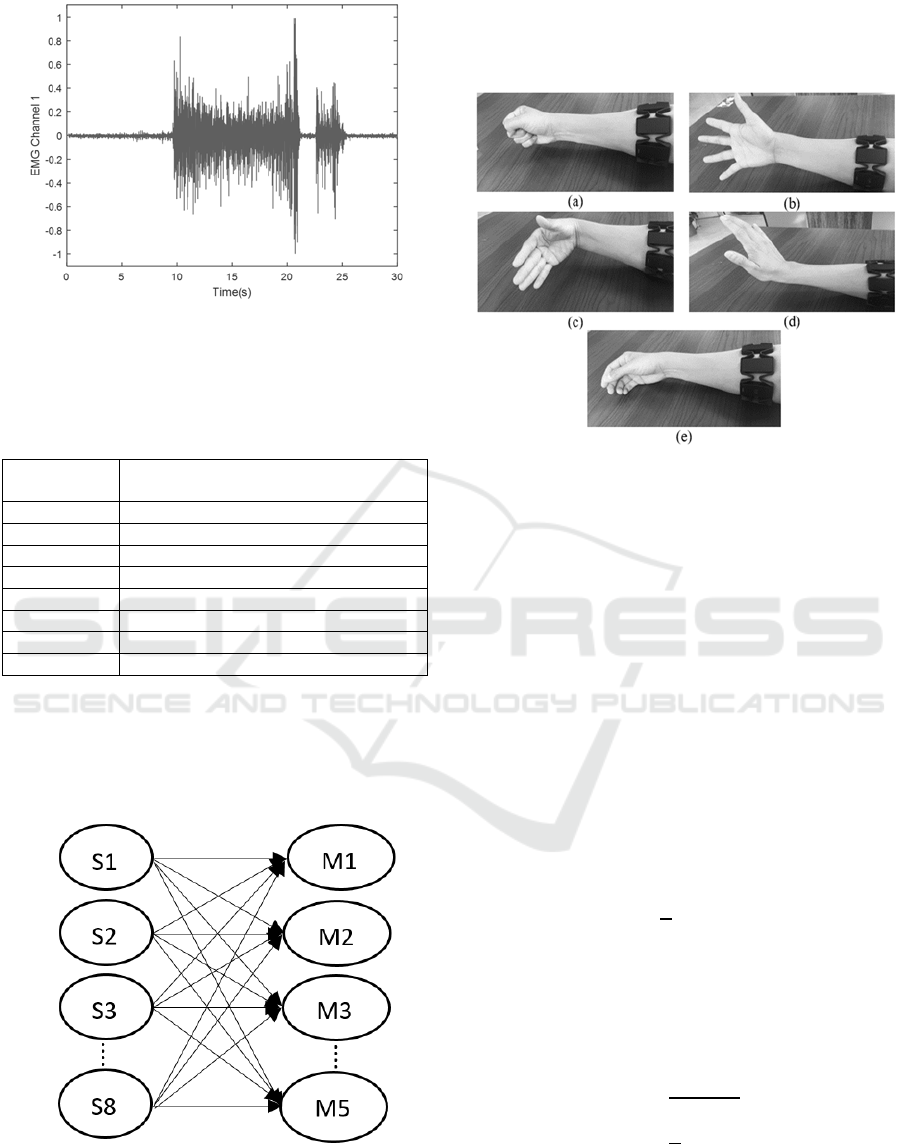
Figure 4: EMG signal acquired by Myo Armband Sensor.
The electrodes are in contact with the different
muscles around the forearm as shown in Table 1.
Table 1: Electrodes distribution in muscles of the forearm.
Myo
Armband
Muscle
Channel 1 Extensor Di
g
itorium Cummunis
Channel 2 Extensor Car
p
i Radialis
Channel 3 Brachioradialis
Channel 4 Pronator Teres
Channel 5 Flexor Digitorum Sublimas
Channel 6 Flexor Car
p
i Ulnaris
Channel 7 Flexor Di
g
itorum Profundus
Channel 8 Extensor Carpi Ulnaris
The signals acquired by the 8 channels of sensor
(S1, S2, ... S8) allow detecting 5 hand movements
(M1, M2, ... M5) which are produced by the
combination of contraction and relaxation of different
muscles in the forearm. Figure 5.
Figure 5: Multi-channel sensor and its relation with the
movements of the hand scheme.
Signal acquisition is made to fifteen user/subjects
who were separated in seven subjects for training and
eight subjects for test. They were asked to perform the
movements that are to be detected. Figure 6.
Figure 6: Proposed movements to identify a) closed hand,
b) open hand, c) hand flexed inwards d) hand flexed out e)
relax position.
2.2 Feature Extraction
Different features can be extracted from the obtained
signals (Boostani and Moradi, 2003), in this work has
been calculated parameters in time domain such as:
MAV, NZC, RMS, VAR, STD, and EOF, in the
frequency domain is calculated PSD. With these
parameters, is desired to reduce the number of signal
data to facilitate pattern recognition and movement
classification.
MAV (Mean Absolute Value): This feature
determines the mean value of the difference in
amplitudes of consecutive samples in a time
segment.
1
|
|
(1)
Where: x
i
is the value of -th sample, is the number
of samples.
RMS (Root Mean Square): This feature
determines the root mean square of consecutive
samples in a time segment.
1
(2)
NZC (Number Zero Crossing): is the number of
times that signal passes the zero-amplitude axis.
ICINCO 2017 - 14th International Conference on Informatics in Control, Automation and Robotics
256
(3)
10
0
VAR (Variance): This feature measures the
spread of data from the mean (̅) of consecutive
samples in a time segment.
1
1
|
̅
|
(4)
Where ̅ is the mean of data in a time segment.
STD (Standard Deviation): this feature measures
the data dispersion of consecutive samples in a
time segment from its mean.
1
1
|
̅
|
(5)
EOF (Empirical Orthogonal Function): is a time
series data mining technique that allows
decomposing time series into a sum of a set of
discrete functions namely EOF’s (Cepeda and
Colome, 2014).
In this work time series correspond to the signals
obtained from eight channels of the forearm F.
F
⋯
⋮⋱⋮
⋯
(6)
The SVD of F matrix has the form:
F
U
Λ
/
V
(7)
Where Λ
/
is a diagonal matrix with the square roots
of eigenvalues from U
or V
. U
and V
are an
orthogonal matrix whose columns are the
orthonormal eigenvectors of FF′ and F′F
respectively.
The number of selected eigenvectors of V
is
defined by eigenvalues of Λ, which allow a measure
of the corresponding explained variability (), and
whose elements are known as EOF’s.
∑
100%
(8)
Then the EOF’s will be used for training of
classifiers.
PSD (Power Spectral Entropy): is used to extract
information content in a discrete signal. To
calculate PSD is necessary to apply the FFT to the
signals in a finite time. The algorithm to calculate
this parameter is summarized to the following
steps (Zhang, Yang, and Huang, 2008):
- The discrete Fourier Transform
can be
computed by FFT. Considering
is the i-th
frequency of the spectrum.
- The Power Spectral Density is computed by:
1
|
|
(9)
- In this work, the sum of the
corresponding
to each frequency is the pattern that will be used.
(10)
2.3 Classification
In this work two methods of pattern recognition are
presented: Feedforward Neural Networks and
Support Vector Machines, then it is done a
comparison between the performance of the
classifiers when they are tested with different patterns
that are obtained from the acquired signals.
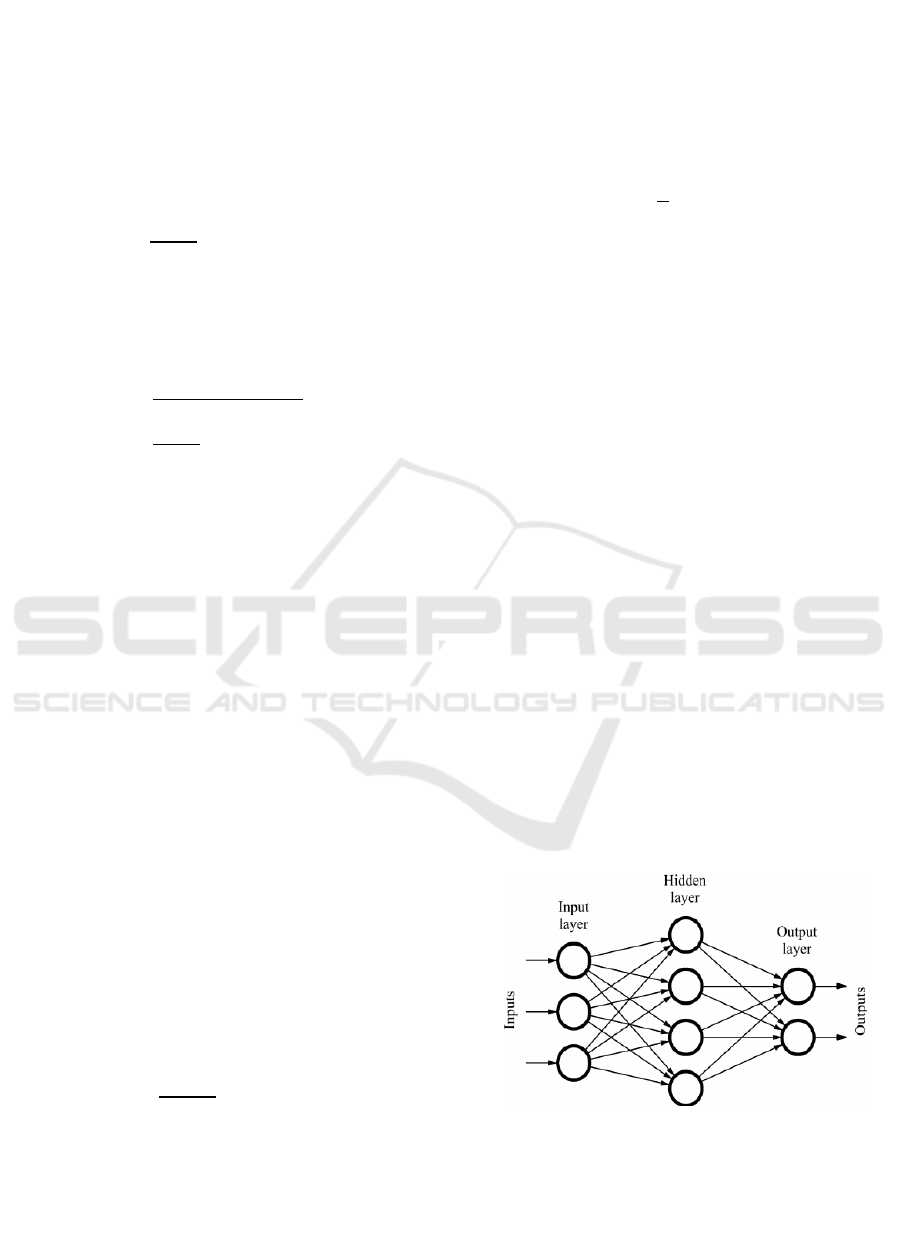
2.3.1 Feedforward Neural Networks (FNN)
Neural Networks are processing algorithms whose
operation simulates a biological brain. They can
process large parallel amounts of information, even if
it is partial and diffuse. This method can learn and
memorize very varied information and formalize it
and, of course, predictions from the data with which
it has been trained. They provide a powerful non-
linear interpolation tool and multidimensional. So,
they have been used mainly in identification and
prediction of patterns.
Figure 7: Feedforward Neural Network Scheme.
The feedforward topology is characterized by
running the processing in one direction only (Russell
and Norvig, 2009). Distinguishing three layers of
computation called neurons: input layer where the
Feature Extraction from sEMG of Forearm Muscles, Performance Analysis of Neural Networks and Support Vector Machines for
Movement Classification
257
data to be processed is received; the intermediate
layer or layers, where is the processing itself and the
output layer. (See Figure 7).
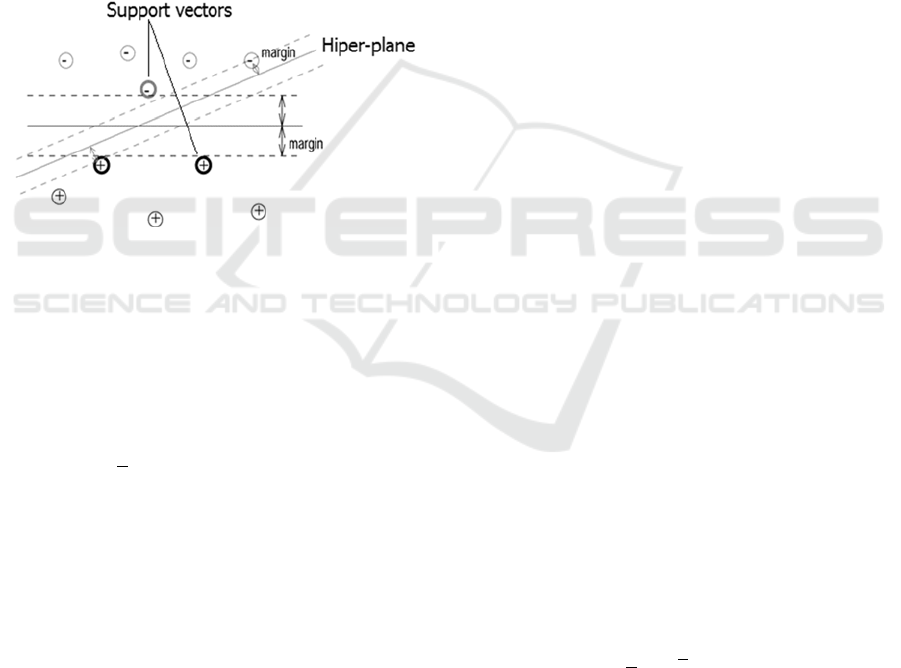
2.3.2 Support Vector Machines (SVM)
SVM is a supervised machine learning algorithm
which can be used for both classification or
regression challenges. However, it is mostly
used in classification problems. In this algorithm, is
plotted each data item as a point in n-dimensional
space (where n is number of features) with the value
of each feature being the value of a particular
coordinate. Then, is performed classification by
finding the hyper-plane that differentiate the two
classes. In Figure 8, is shown the representation of
SVM’s and the optimal hyperplane.
Figure 8: Representation of SVM’s.
Support Vector Classifiers (SVC) needs a priori
an off-line learning stage, in which the classifier must
be trained using a training set of data. Each element
in the training set contains one ¨target value¨ and
several attributes (Cepeda, 2013). Training involves
the minimization of the error function:
1
2
(11)
Subject to the constraints:
1
0
(12)
Where: is the margin parameter, is the vector of
coefficients, is the bias constant, and
represents
parameters for handling nonseparable data (inputs).
The index i labels the training cases.
represents
the class labels and
represents the independent
variables. The kernel is used to transform data from
the input (independent) to the feature space. Radial
Basis Kernel function used in this work, it has the
form (Chih-Wei Hsu, Chih-Chung Chang, 2008):
,
,0
(13)
In this work, the inputs are the different features
extracted of the signals of the forearm muscles and
the targets are the hand movements.
2.3.3 K-Fold Cross Validation
It is a technique used to measure how accurate is the
classification algorithm. In this method, the sample
data are divided into K subsets. One of the subsets is
used as test data and the rest (K-1) as training data.
The cross-validation process is repeated during K
iterations, with each of the possible subsets of test
data. Finally, the arithmetic mean of the results of
each iteration is performed to obtain a single result.
This method is very accurate since we evaluate from
K combinations of training and test data. In practice,
the choice of the number of iterations depends of the
measurement of the data set.
2.3.4 Reduction of Dimensionality of the
Data
In this work, it is identified the clusters belonging to
the 5 movements of the hand to verify its separation.
Data have been obtained through the 8 channels of the
sensor, then it necessarily to reduce their
dimensionality to show the information in the space.
Through the principal component analysis (PCA)
is proposed to reduce the dimensionality of elements
to represent the clusters in the plane (2-dimensions)
or space (3-dimensions) without excessive loss of
accuracy.
Principal component analysis (PCA) is a data
mining technique that allows transform the original
data into a new set of variables which are uncorrelated
(Cepeda, 2013), and can be obtained through
calculation of singular value decomposition (SVD) of
the covariance matrix (S).
Considering a data matrix X:
X
⋯
⋮⋱⋮
⋯
(14)
The covariance matrix is calculated from data matrix
(X):
S
1
X
X
(15)
where:
I: identity matrix
1: all ones vector
Applying spectral decomposition (SVD) to S matrix:
SUΛU´
(16)
ICINCO 2017 - 14th International Conference on Informatics in Control, Automation and Robotics
258
Where Λ is a diagonal matrix containing eigenvalues
(
) of S, U is an orthonormal matrix containing the
eigenvector of S.
The number of selected eigenvectors of U is
defined by eigenvalues of Λ, which allow a measure
of the corresponding explained variability Ec (8).
Thus, the new data matrix Y is the projection of
original data X on the hiper-plane defined by U.
YXU
(17)
3 RESULTS
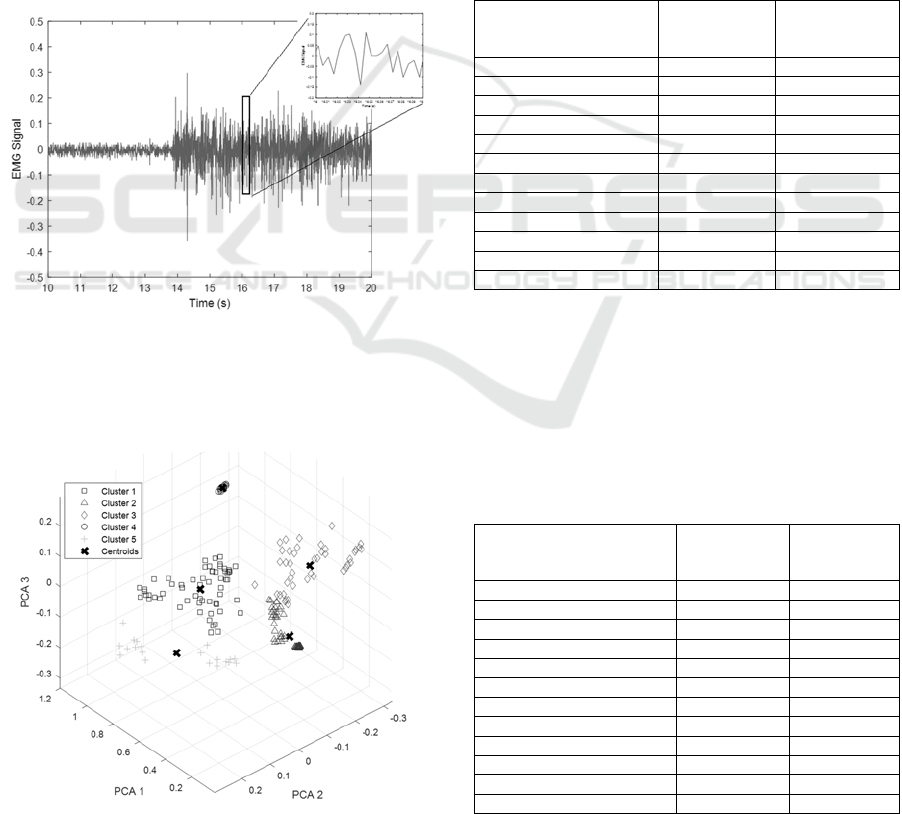
Feature extraction has been for time window of 100
milliseconds as shown Figure 9. Once the data for
these segments are obtained, it is calculated: MAV,
NZC, RMS, VAR, STD, and EOF, and PSD.
Figure 9: Time window used for feature extraction
(example).
Figure 10, shows clusters obtained with 3 PC´s
which have an Explained Variability
=93.3%.
Figure 10: Clusters identified for 5 hand movement.
In Table 2, the results obtained to measure the
robustness of the implemented classifiers are
presented, taking the signals of 7 subjects/users (4
men, 3 women) for off-line training of Feedforward
Neural Networks (10 hidden layers and
backpropagation method for training phase) and
Support Vector Machines with 350 time windows of
signals corresponding to the 5 movements of the
hand, that is: 70 open hand, 70 closed hand, 70 hand
flexed inwards, 70 hand flexed out and 70 hand
relaxed, the accuracy of the classifiers is done using
K-fold cross validation algorithm for K = 10.
Tests were performed with independent features
and with the best combinations of them to find the
best accuracy.
Table 2: Classification accuracies throw K-fold cross
validation method.
Pattern
Feedforward
Neural
Network
Support Vector
Machines
MAV 79.2 % 63.2 %
NZC 34.5 % 29.5 %
RMS 87.5 % 66.0 %
VAR 77.0 % 55.5 %
STD 86.0 % 69.0 %
PSD 45.0 % 35.5 %
EOF 22.5 % 39.0 %
MAV-STD 86.0 % 67.0 %
RMS-STD 86.5 % 67.5 %
MAV-RMS-STD 78.8 % 62.4 %
MAV-RMS-VAR 82.4 % 62.4 %
MAV-RMS-VAR-STD 78.0 % 63.2 %
It is recommendable to identify the best
parameters C and γ of SVM classifier to obtain better
results (Chih-Wei Hsu, Chih-Chung Chang, 2008).
Differential evolution algorithm has been used to
identify the constants, obtaining the accuracy results
shown in Table 3.
Table 3: Classification accuracies throw K-fold cross
validation method with identified parameters of SVM.
Pattern
Feedforward
Neural
Network
Support
Vector
Machines
MAV 79.2 % 100 %
NZC 34.5 % 61.0 %
RMS 87.5 % 99.5 %
VAR 77.0 % 98.5%
STD 86.0 % 100 %
PSD 45.0 % 65.5 %
EOF 22.5 % 56.0 %
MAV-STD 86.0 % 99.5 %
RMS-STD 86.5 % 100 %
MAV-RMS-STD 78.8 % 99.6 %
MAV-RMS-VAR 82.4 % 99.2%
MAV-RMS-VAR-STD 78.0 % 99.6 %
Feature Extraction from sEMG of Forearm Muscles, Performance Analysis of Neural Networks and Support Vector Machines for
Movement Classification
259
In Table 3, it can be evidenced when using a
method of optimization for calculation the SVM
constants, the performance of the classifier can be
greatly improved.
Table 4: Classification accuracies in the test group.
Classification accuracy with different features
(%)
Test CLA MAV STD
RMS
STD
MAVR
MS
STD
MAV
RMS
VAR
STD
User 1
F
N
N
79.0 84.0 74.0 40.0 50.0
SVN 94.0 92.0 92.0 82.0 94.0
User 2
FNN 80.0 38.0 50.0 74.0 74.0
SVN 90.0 84.0 84.0 90.0 92.0
User 3
FNN 70.0 58.0 68.0 72.0 42.0
SVN 88.0 84.0 84.0 76.0 76.0
User 4
FNN 50.0 34.0 28.0 36.0 22.0
SVN 64.0 62.0 62.0 78.0 90.0
User 5
FNN 74.0 84.0 44.0 84.0 96.0
SVN 92.0 92.0 100 100 100
User 6
FNN 80.0 74.0 56.0 52.0 46.0
SVN 99.0 98.0 100 100 100
User 7
FNN 46.0 20.0 18.0 82.0 52.0
SVN 88.0 86.0 84.0 84.0 88.0
User 8
FNN 58.0 30.0 36.0 52.0 50.0
SVN 82.0 96.0 78.5 92.0 96.0
After the training of the FNN and SVM
algorithms, accuracy measurements, were performed
taking the signals of 8 subjects/users (6 men, 2
women) of the test group, with 400 time windows of
signals corresponding to the 5 movements of the
hand, that is: 80 open hand, 80 closed hand, 80 hand
flexed inwards, 80 hand flexed out and 80 hand
relaxed. It has been done with the better features such
as: MAV, STD, RMS-STD (R-S),
MAV-RMS-STD
(M-R-S) and MAV-RMS-VAR-STD
(M-R-V-S) which
exceed 99.5% accuracy in the training phase of SVM.
This results are shown in Table 4.
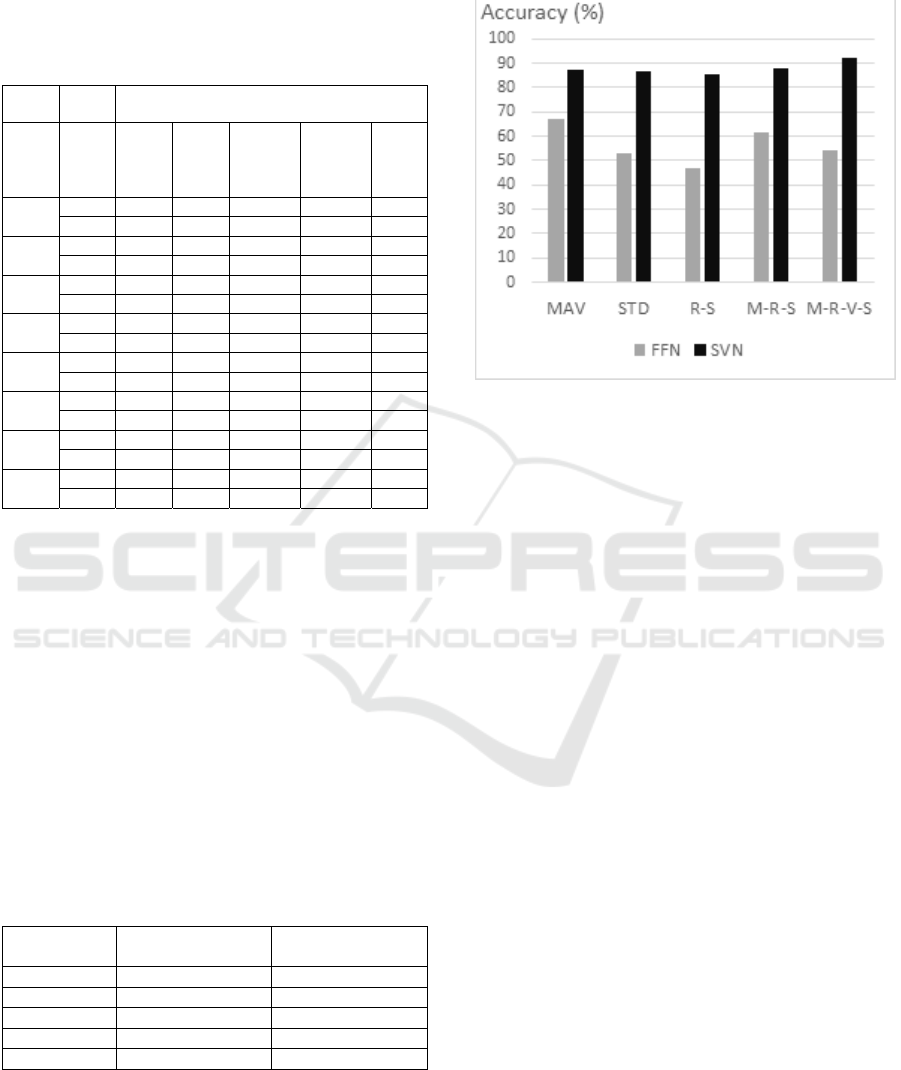
Table 5, shows the average accuracies for each
classifier, and Figure 11 a comparative graph of these
values.
Table 5: Average accuracies in the test group.
Feedforward
Neural Networ
k
Support Vector
Machines
MAV 67.1 % 87.1 %
STD 52.8 % 86.8 %
R-S 46.8 % 85.6 %
M-R-S 61.5 % 87.8 %
M-R-V-S 54.0 % 92.0 %
Results presented in Figure 11, show the best
feature for the classification of movements in users
who did not participate in the training phase, this is
the combination of the features M-R-V-S, with the
SVM classifier, which have an average accuracy of
92.0%.
Figure 11: Average accuracies of classifiers test.
4 CONCLUSIONS
The present work has allowed to determine the
identification of different movements of the hand
through the acquisition of sEMG signals of the
forearm. In this work, it has been shown that SVM
presents better accuracy regarding the FNN for
classification, and the feature that is considered the
best for this aim is the combination MAV-RMS-
VAR-STD with 92% of accuracy.
In future works, it is proposed to detect other
movements, especially including the fingers of the
hand and to verify other classification techniques
such as Linear Discriminant Analysis (LDA) among
others to transfer these movements ton robotic
orthotic prostheses.
REFERENCES
Abel, E., Zacharia, P., Forster, A., and Farrow, T. (1996).
Neural network analysis of the EMG interference
pattern. Medical Engineering and Physics, (1), 12–17.
Retrieved from http://www.sciencedirect.com/science/
article/pii/1350453395000321
Boostani, R., and Moradi, M. H. (2003). Evaluation of the
forearm EMG signal features for the control of a
prosthetic hand. Physiological Measurement, 24(2),
309. https://doi.org/10.1088/0967-3334/24/2/307
Cepeda, J. C. (2013). Real Time Vulnerability Assessment
of Electric Power Systems Using Synchronized Phasor
ICINCO 2017 - 14th International Conference on Informatics in Control, Automation and Robotics
260

Measurement Technology. Facultad de Ingeniería de la
Universidad Nacional de San Juan.
Cepeda, J. C., and Colome, D. G. (2014). Benefits of
empirical orthogonal functions in pattern recognition
applied to vulnerability assessment. 2014 IEEE PES
Transmission and Distribution Conference and
Exposition, PES T and D-LA 2014 - Conference
Proceedings, 2014–Octob. https://doi.org/10.1109/
TDC-LA.2014.6955254
Chih-Wei Hsu, Chih-Chung Chang, and C.-J. L. (2008). A
Practical Guide to Support Vector Classification. BJU
International, 101(1), 1396–400. https://doi.org/
10.1177/02632760022050997
Fang, Y., Ju, Z., Zhu, X., and Liu, H. (2014). Finger pinch
force estimation through muscle activations using a
surface EMG sleeve on the forearm. IEEE International
Conference on Fuzzy Systems, 1449–1455.
https://doi.org/10.1109/FUZZ-IEEE.2014.6891790
Ju, Z., and Liu, H. (2014). Human hand motion analysis
with multisensory information. IEEE/ASME
Transactions on Mechatronics, 19(2), 456–466.
https://doi.org/10.1109/TMECH.2013.2240312
Ju, Z., Ouyang, G., Wilamowska-Korsak, M., and Liu, H.
(2013). Surface EMG based hand manipulation
identification via nonlinear feature extraction and
classification. IEEE Sensors Journal, 13(9), 3302–
3311. https://doi.org/10.1109/JSEN.2013.2259051
Kavya, S., Dhatri, M. P., Sushma, R., and Krupa, B. N.
(2015). Controlling the hand and forearm movements
of an orthotic arm using surface EMG signals, 1–6.
https://doi.org/10.1109/INDICON.2015.7443749
Kawano, T., and Koganezawa, K. (2016). A Method of
Discriminating Fingers and Wrist Action from Surface
EMG Signals for Controlling Robotic or Prosthetic
Forearm Hand. https://doi.org/10.1109/AIM.2016.
7576736
Khushaba, R. N., Al-Timemy, A., Kodagoda, S., and
Nazarpour, K. (2016). Combined influence of forearm
orientation and muscular contraction on EMG pattern
recognition. Expert Systems with Applications, 61, 154–
161. https://doi.org/10.1016/j.eswa.2016.05.031
Nakajima, Y., Keeratihattayakorn, S., Yoshinari, S., and
Tadano, S. (2014). An EMG-CT method using multiple
surface electrodes in the forearm. Journal of
Electromyography and Kinesiology, 24(6), 875–880.
https://doi.org/10.1016/j.jelekin.2014.07.010
Russell, S., and Norvig, P. (2009). Artifical Intelligence: A
Modern Approach (Third Edition). Prentice Hall.
https://doi.org/10.1017/S0269888900007724
Wang, G., Zhiguo, Y., Xiao, H., Hongbo, X., and Zhizhong,
W. (2006). Classification of surface EMG signals using
harmonic wavelet packet transform. Medical and
Biological Engineering and Computing, 44(10), 865–
872. https://doi.org/10.1007/s11517-006-0100-y
Zhang, A. Z. A., Yang, B. Y. Bin, and Huang, L. H. L.
(2008). Feature Extraction of EEG Signals Using
Power Spectral Entropy.
2008 International
Conference on BioMedical Engineering and
Informatics, 2, 1359–1363. https://doi.org/10.1109/
BMEI.2008.254
Feature Extraction from sEMG of Forearm Muscles, Performance Analysis of Neural Networks and Support Vector Machines for
Movement Classification
261
