
Mobile Silent and Continuous Authentication using Apps Sequence
Gerardo Canfora
1
, Giovanni Cappabianca
1
, Pasquale Carangelo
1
, Fabio Martinelli
2
,
Francesco Mercaldo
2
, Ernesto Rosario Russo
1
and Corrado Aaron Visaggio
1
1
Department of Engineering, University of Sannio, Benevento, Italy
2
Institute for Informatics and Telematics, National Research Council of Italy (CNR), Pisa, Italy
Keywords:
Continuous Authentication, Silent Authentication, Security, Behavioral Models, Android.
Abstract:
The last years have seen a growing explosion of the use of mobile devices. As matter of fact “smart” devices
are used for a plethora of activities: from spending leisure time on social networks to e-banking. For these
reasons smart devices hold huge volumes of private and sensitive user data and allow the access to critical
applications in terms of privacy and security. Currently mobile devices provide an authentication mechanism
based on the login: they do not continuously verify the identity of the user while sensitive activities are
performed. This mechanism may allow an adversary to access sensitive information about users and to replace
them during sensitive tasks, once they have obtained the user’s credentials. To mitigate this risk, in this paper
we propose a method for the silent and continuous authentication. Considering that each user typically runs
recurrently a certain set of applications in every-day life, our method extracts this characterizing sequences
of apps for profiling the user and recognizing the user of the device that is not the owner. Using machine
learning techniques several classifiers have been trained and the effectiveness of the proposed method has
been evaluated by modeling the user behavior of 15 volunteer participants. Encouraging results have been
obtained, i.e. a precision in distinguishing an impostor from the owner equal to 99%. The main benefit of this
method is that is does not use sensitive data, nor biometrics, which, if compromised, cannot be replaced.
1 INTRODUCTION
The most widespread method for authenticating users
on mobile devices consists of inserting a password or
a secret pattern. This mechanism is weak for many
reasons: users often choose very simple and easily
guessable passwords (Clarke and Furnell, 2005); pat-
terns can be deduced with special lighting and high-
resolution photography (Aviv et al., 2010). Finally
recent studies (Harbach et al., 2014) revealed that
about 34% users did not use any form of authen-
tication on their devices, while 24% consider lock-
ing screens unnecessary. Consequently, unauthorized
individuals may obtain access to the device, install
malware or have access to a user’s personal infor-
mation. To overcome this problem continuous au-
thentication, also known as active authentication was
proposed (Guidorizzi, 2013), which essentially makes
use of physiological and behavioral biometrics us-
ing built-in sensors and accessories such as the gy-
roscope, touch screen, accelerometer, orientation sen-
sor, and pressure sensor, to continuously monitor user
identity. Examples of physiological biometrics are the
picture of the face or the fingerprint, while behavioral
biometrics are gait, touch gestures and hand move-
ment. Authors in literature have used interchange-
ably also the terms implicit authentication (Jakobs-
son et al., 2009), (Shi et al., 2010), and transparent
authentication (Clarke, 2011). The methods for con-
tinuous authentication developed till now have dif-
ferent limitations: biometric data at enrollment time
may have different characteristics than those pre-
sented during authentication. This problem is known
as domain adaptation (Patel et al., 2015), and affect
mainly face recognition. Many biometrics for contin-
uous authentication raise issues of privacy disclosure
(
ˇ
Sed
ˇ
enka et al., 2015). Some of the physiological
and behavioral biometrics based continuous authen-
tication are vulnerable to spoofing, mimic, statistic,
or digital replay attacks (Smith et al., 2015). Most
continuous and authentication methods ignore usabil-
ity and acceptability issues (Patel et al., 2016); finally,
while a compromised password or a smart card can be
revoked, a biometric is permanently associated with a
user, so that when compromised cannot be replaced.
In order to overcome all these limitations, we propose
Canfora, G., Cappabianca, G., Carangelo, P., Martinelli, F., Mercaldo, F., Russo, E. and Visaggio, C.
Mobile Silent and Continuous Authentication using Apps Sequence.
DOI: 10.5220/0006424200790091
In Proceedings of the 14th International Joint Conference on e-Business and Telecommunications (ICETE 2017) - Volume 4: SECRYPT, pages 79-91
ISBN: 978-989-758-259-2
Copyright © 2017 by SCITEPRESS – Science and Technology Publications, Lda. All rights reserved
79

a method for continuous authentication that identi-
fies those sequences of apps that characterize the way
each user uses the smartphones. The idea arises from
the observation that the smartphone is becoming a
tool that accompanies the everyday life, since we use
smartphones for a lot of activities, and each person
stabilizes certain recurrent habits in the use of the
apps. Some apps are used in precise moments of the
day or are not used in other moments. For example,
Alex goes to run at 6 o’clock of Monday, Wednesday
and Friday, and in that time, for one hour he launches
”runtastic” and ”spotify” apps. During office time
Lisa doesn’t use to see the email on the smartphone,
but on the pc, thus she does never access Gmail app
during work time. Standing these considerations, the
authentication can be done on the basis of some char-
acterizing sequences of apps that the user launches
on the smartphone and that occur with a significant
recursion. When an expected sequence of apps is not
observed or when an unexpected sequence occurs, the
system can rise an alarm or mark as ”suspicious” the
event on a log. The method is able to overcome the
limitations of the traditional mechanisms of contin-
uous authentication, as it does not affect the user’s
privacy nor requires biometrics and the experimenta-
tion demonstrated that it is able to produce an EER
that is very competitive if compared with that of the
other methods. The research question that we wish
to answer is: ”Can the sequence of apps launched by
a smartphone’s user distinguish the legitimate owner
from an impostor?”. The proposed mechanism should
work as an anomaly detector, rather than in a positive
recognition of the user, i.e. when the behavior of the
user does not complain with the user profile, the sys-
tem should signal an anomaly, with the purpose of
logging ”suspicious” activities or verifying the iden-
tity of the user with a stronger authentication mecha-
nism.
The rest of the paper is organized as follows:
Section 2 discusses related work, Section 3 presents
the proposed approach, Section 4 evaluates the effec-
tiveness of the approach and, finally, conclusion are
drawn in Section 5.
2 RELATED WORK
Continuous authentication has been largely investi-
gated and literature is plenty of a great variety of fea-
tures that are collected for recognizing the user.
Gait’s recognition consists of identifying a person
by the walking way. Benabdelkader et al. (BenAb-
delkader et al., 2002) demonstrated that a person’s
height and stride allow to recognize correctly a per-
son with 49% probability. Mantyjarvi et al. (Man-
tyjarvi et al., 2005) used three approaches of gait’s
recognition, namely correlation, frequency domain
and data distribution statistics, producing respectively
an EER of 7%, 10%, and 19%. Gafurov et al. (Ga-
furov et al., 2006) applied histogram similarity and
cycle length, by achieving an EER of 5% and 9% re-
spectively. Derawi et al. (Derawi et al., 2010) applied
preprocessing, cycle detection and recognition anal-
ysis to the acceleration signal, obtaining an EER of
20%.
Touch gestures track the user’s unique touch fea-
tures, such as finger pressure and trajectory, the speed
and acceleration of movement, and how the person in-
teracts with the mobile device. Saevanee et al (Saeva-
nee and Bhatarakosol, 2008) explored the use of three
behavioral biometrics: the hold-time, the inter-key
behavior, and the finger pressure. They found that the
only usage of finger pressure produced an accuracy of
99%, similar to the results obtained with the combi-
nation of hold-time and finger pressure. Frank et al.
(Frank et al., 2013) investigated 30 behavioral touch
features, obtaining an EER of 0% for intra-session au-
thentication, 2%-3% for inter-session authentication
and below 4% when the authentication test was run
one week after the enrollment phase. Li et al. (Li
et al., 2013) proposed a system that learn the finger
movements’ patterns: the sliding up gesture produced
an accuracy of 95.78%, the sliding down 95.30%, the
sliding left 93.06%, the sliding right 92.56%, the up
and tap 93.02%, the down and tap 89.25%, the left
and tap 88.28% and the right and tap 89.66%. Sitov
et al. (Zhao et al., 2013), proposed Hand Movement,
Orientation, and Grasp (HMOG), a set of behavioral
features which capture micro-movement and orienta-
tion dynamics for continuous authentication. They
obtained an EER of 7.16% when the user’s walking,
and 10.05% when sitting. Buriro et al. (Buriro et al.,
2016), introduced a system for profiling a user based
on how he holds the phone by taking into account
the micro-movements of a phone and the movements
of the user’s finger when interacting with the touch-
screen. With Multilayer Perceptron 1-class verifier,
they obtained 95% True Acceptance Rate (TAR) with
3.1% False Acceptance Rate (FAR) on a dataset of 30
volunteers.
Authors in (Canfora et al., 2016) propose a con-
tinuous and authentication method for Android smart-
phones that consider as discriminating features the de-
vice orientation, the touch and the cell tower. They
obtain a precision in distinguishing an impostor from
the owner between 99% and 100%.
Multimodal is the combination of different bio-
metric features. Kim et al (Kim et al., 2010) proposed
SECRYPT 2017 - 14th International Conference on Security and Cryptography
80
a fusion of face, teeth and voice modalities. The val-
idation produced an EER of 1.64%. Bo et al. (Bo
et al., 2013) proposed a system for continuous au-
thentication that exploits dynamics mined from the
user walking patterns in combination with the touch
behavior bio-metrics and the micro-movement of the
mobile device caused by users screen-touch actions.
They showed that the user identification accuracy was
over 99%. Zheng et al. (Zheng et al., 2014), proposed
a mechanism using the fusion of four features (accel-
eration, pressure, size, and time) extracted from smart
phone sensors (accelerometer, gyroscope, and touch
screen sensors). Experimentation showed an EER of
3.65%
Some authors investigated the way user performs
the input, like Seo et al. (Seo et al., 2012) and Shen
et al. (De Luca et al., 2012), obtaining an accuracy
of respectively 100%, 77%, and the third one a false
rejection rate of 6.85%, and a false-acceptance rate of
5.01%
Power consumption was also investigated as iden-
tifier of a user as in Murmuria et al. (Murmuria
et al., 2012), which used power consumption along
with touch gestures and physical movements, obtain-
ing an EER varying between 6.1% and 6.9%. Li et
al. (Shye et al., 2009) explored the usage of applica-
tion (application time, name and time of application
usage), obtaining an EER of 13.5%. A behavior pro-
filing method based on application usage, Bluetooth
sightings and Wi-Fi access point sightings was pre-
sented in (Neal et al., 2015): authors reported average
identification rates of 80%, 77%, 93%, and 85%.
Different solutions where also proposed for face
recognition (Hadid et al., 2007) (producing and av-
erage authentication rate between 82% and 96%),
(Fathy et al., 2015) (showing a recognition rate of
95%), (Crouse et al., 2015) (with an EER between
13% and 30%), and (Abeni et al., 2006) (EER be-
tween 3.95% and 7.92%).
Differently from these methods, the method pro-
posed in this paper collects only recurring sequence
of apps that can identify the owner behavior, thus does
not collect sensitive data nor user biometrics, and pro-
duce a very low EER, competitive with the best results
recorded in literature.
3 THE METHOD
The proposed approach consists of extracting a set of
features, captured directly on the device during its us-
age, which are intended to characterize the user be-
haviour.
The features’ set considered is a sequence of ap-
plications that show some recurrent usage patterns,
i.e. are launched (or never launched) in precise mo-
ments of the day or in a certain order. In order to
gather these information, an application has been de-
veloped that must be installed on the smartphone or
the tablet where the user must be authenticated.
The proposed method takes into account the ap-
plication sequences related to: (i) Activities: an ac-
tivity is one of the fundamental building blocks of an
Android app. It is the entry point for a user’s interac-
tion with an app, and it plays also a central role in the
user navigation of an app (with the Back button) or
between apps (with the Recents button); (ii) Services:
a service allows an application component to perform
long-running operations in background, without pro-
viding a user interface. Another application compo-
nent can start a service, while it continues to run in
background even if the user switches to another appli-
cation. Since there are many versions of the Android
operating system released by Google, causing con-
sequent changes of the API, different methods have
been used to retrieve the sequence of applications
(i.e., Activities and Services) launched by the user.
With regards to the Activities gathering, for
the operating system versions before Android M,
the getRunningAppProcesses() method belonging
to the ActivityManager class
1
was used: this
method is able to return a list of application pro-
cesses that are running on the device. In order to
solve the compatibility problems with the operating
system versions after Android M, the “Android tool-
box”
2
utility was leveraged, that is a multi-function
program: it encapsulates the functionality of many
common Linux commands (and some special An-
droid ones) into a single binary. This makes it more
compact than having all those other commands in-
stalled individually. However, the toolbox versions
of these commands (e.g. ’ps’, or ’ls’) have less func-
tionality than their full-sized Linux counterparts. The
actual toolbox binary is often located in /system/bin
directory on an Android system, and the commands
that it supports are listed as symlinks within /sys-
tem/bin/toolbox. The ps command provided by the
tool was used for displaying information about the ac-
tive processes.
For the several Android operating system ver-
sions, the recognition of the duration of a foreground
activities was possible by detecting, for each de-
vice, a list of launchers so as to precisely determine
the instant when the user changes the context. In
order to gather invoked Services, for Android ver-
1
https://developer.android.com/reference/android/app/
ActivityManager.html
2
http://elinux.org/Android toolbox
Mobile Silent and Continuous Authentication using Apps Sequence
81
sions with operating system versions equal to 4.4 or
less, the getServices() method belonging to the
ActivityManager class was used to extrapolate the
services in execution.
By using the ad-hoc developed app, it is possible
to retrieve the raw user traces, containing the list of
the first 1000 invoked Activities and Services. Start-
ing from the raw traces, the relevant transitions be-
tween activities and services for each user are built,
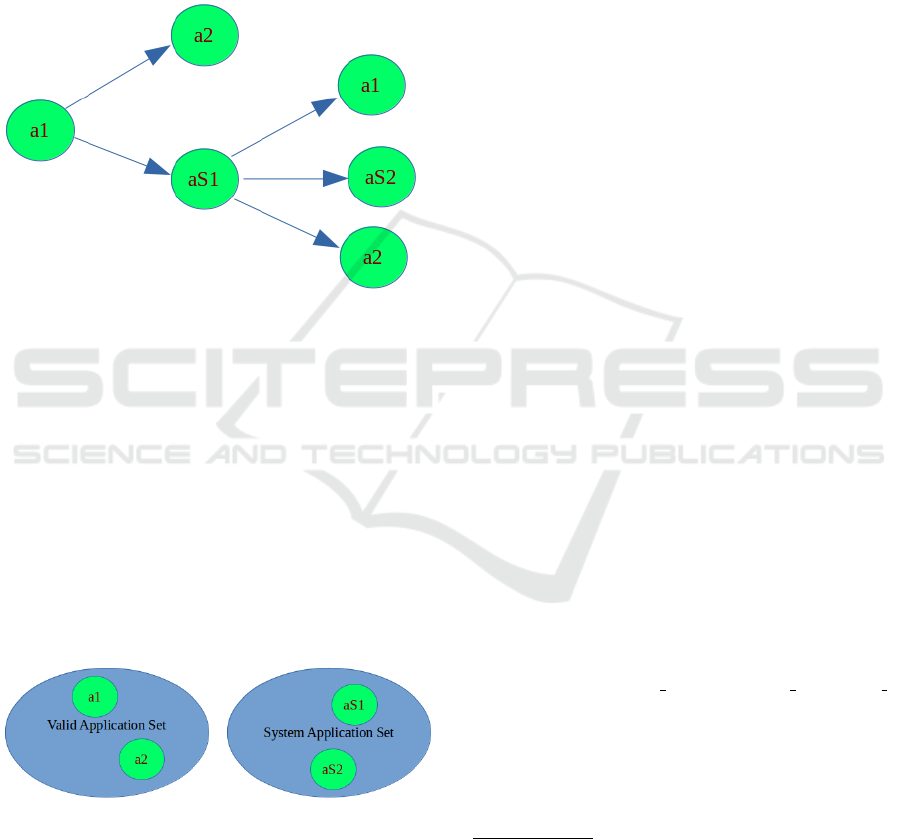
as the tree in Figure 1 outlines.
Figure 1: The valid applications set and the system one.
Fig.1 shows that the observed user invokes first
the a1 application, then the a2, thus the user comes
back to the a1 application. The user invokes the aS1
application and start, respectively, the a1, the aS2 and
the a2 applications.
The tree is built from the Activities and the Ser-
vices invoked by the user in a time-window of 1 day.
From the traces, we obtained two sets of applica-
tions: the first set is represented by the valid applica-
tions (i.e., the applications effectively invoked by the
user), while the second one includes the system appli-
cations set which are discarded because does not pro-
vide helpful information for our aims, as Fig.2 shows.
Figure 2: The valid applications set and the system applica-
tions set.
In the tree shown in Figure 1, a1 and a2 represent
the valid applications, while aS1 and aS2 the system
applications: the last ones are excluded by the analy-
sis. System applications are not included in the fea-
tures set because they add only noise in the data, as
these applications are launched by many different ap-
plications and are scarcely explicative of the user’s
behavior.
The system applications which are discarded are:
(i) com.google.android.gms.persistent: it is part of
Google Play Services, and it enables the user to
benefit of Google-powered features, such as Maps,
Google+, with automatic platform updates distributed
through the Google Play store
3
; (ii) system:ui: it rep-
resents the process responsible for the system bars,
i.e. screen areas dedicated to the display of notifica-
tions, communications of the device status, and the
device navigation. Typically the system bars are dis-
played concurrently with the running application; (iii)
android:ui: it is the process responsible to manage
the user interface and a variety of pre-built UI com-
ponents such as structured layout objects and UI con-
trols as dialogs, notifications, and menus provided by
Android. When the user receives a notification from
an application that is not running in foreground, the
related Service is gathered also if the user does not
run the application. Considering that the messaging
applications like WhatsApp
4
and Telegram
5
typically
send a great number of notifications and such notifica-
tions create noise, notifications received by this kind
of applications have been excluded.
In order to correctly identify the application of the
Communication category
6
(in order to exclude from
the analysis the notification Service, but not the Ac-
tivity invoked by the user for running the application),
an open-source API for the Google Play market
7
has
been used. This API allows to mine the official mar-
ket servers for retrieving apps and the related meta-
data: specifically, the API was used for identifying the
category of the application that sends the notification,
excluding the application belonging the the Commu-
nication category.
In order to gather the application Service respon-
sible for sending the notification, the developed ap-
plication needs to change the correspondent setting.
At the first start the application, by using the an-
droid.settings. ACTION NOTIFICATION LISTENER
SETTINGS implicit intent the user is redirected to the
operating system settings, which allows to activate
the correspondent flag (this procedure is necessary
only with operating system version equal to 5.0 and
higher).
3
https://play.google.com/store?hl=it
4
https://play.google.com/store/apps/details?id=com.
whatsapp&hl=it
5
https://play.google.com/store/apps/details?id=org.telegram.
messenger&hl=it
6
https://play.google.com/store/apps/category/COMMUNI
CATION
7
https://github.com/jberkel/android-market-api
SECRYPT 2017 - 14th International Conference on Security and Cryptography
82
The developed application does not re-
quire root privileges, but it requires the fol-
lowing permissions: (i) android.permission.
WRITE EXTERNAL STORAGE: this permission
enables the application to write to external stor-
age; this permission needs to store on the external
device memory the raw traces of the user; (ii) an-
droid.permission. READ CONTACTS: this permission
allows the application to read the user’s contacts
data: this permission lets to identify the user; (iii)
android.permission.RECEIVE BOOT COMPLETED:
this permission enables the application to know
when the device is booted: this permission lets the
developed application to be run at device boot time.
The developed application sends the raw traces to a
NoSQL database. The database is managed with the
Google App Engine
8
, a platform for building scalable
web applications and mobile backends.
4 THE EVALUATION
An experiment has been designed and carried out
for evaluating the effectiveness of the proposed tech-
nique.
More specifically, the experiment is aimed at ver-
ifying whether the features representing the sequence
of the applications invoked by the user are able to dis-
criminate the device owner by an impostor.
The classification of owner and impostor is done
with several state of the art machine learning classi-
fiers built with the features.
The evaluation consists of three stages: (i) a com-
parison of descriptive statistics of the populations of
application sequences; (ii) hypotheses testing, to ver-
ify whether the features have different distributions
for the populations of impostors and owner; and (iii)
a classification analysis aimed at assessing whether
the features are able to correctly classify the device
user as impostor or owner.
We provide the descriptive statistics with the box
plots of the distributions of impostors and owners, in
order to demonstrate that they belong to different pop-
ulations.
With regards to the hypotheses testing, the null hy-
pothesis to be tested is:
H
0
: ‘impostor and owner have similar values of
the considered features’.
The null hypothesis was tested with Mann-
Whitney (with the p-level fixed to 0.05) and with
Kolmogorov-Smirnov Test (with the p-level fixed to
0.05). Two different tests are run with the aim of
8
https://cloud.google.com/appengine/
enforcing the conclusion validity.
The purpose of these tests is to determine the level
of significance, i.e., the risk (the probability) that er-
roneous conclusions be drawn: in our case, the sig-
nificance level is set to .05, which means that it is ac-
cepted to make mistakes 5 times out of 100.
The classification analysis was aimed at assessing
whether the features where able to correctly classify
impostors and owner. Six algorithms of classifica-
tion were used: J48, LADTree, RandomForest, Ran-
domTree, RepTree and SimpleCart. These algorithms
were applied to the feature vector.
The classification analysis was accomplished with
Weka
9
, a suite of machine learning software, largely
employed in data mining for scientific research.
More specifically, the experiment is aimed at veri-
fying whether the features are able to classify a behav-
ior trace as performed by the owner or by an impostor.
For the sake of clarity, the results of the evalua-
tion will be discussed reflecting the data analysis’ or-
ganization in the three phases: descriptive statistics,
hypotheses testing and classification.
We observed 15 users for 21 days: the evaluation
time window began on March 13, 2016 and finished
on April 4, 2016. We collected the first 1000 applica-
tions for device each usage session ran by each user
under analysis during a 1-day temporal window, and
we consider the sequence of these 1000 applications
as the feature vector. Each application invoked rep-
resents a feature: we indicate with FX the X feature,
where 1 ≤ X ≤ 1000 (i.e., X represents the X-th ap-
plication invoked by the user under analysis).
Table 1 provides the details of the observed de-
vices used to evaluate the proposed method: in the
experiment both smartphones and tablets are used as
experimental environments.
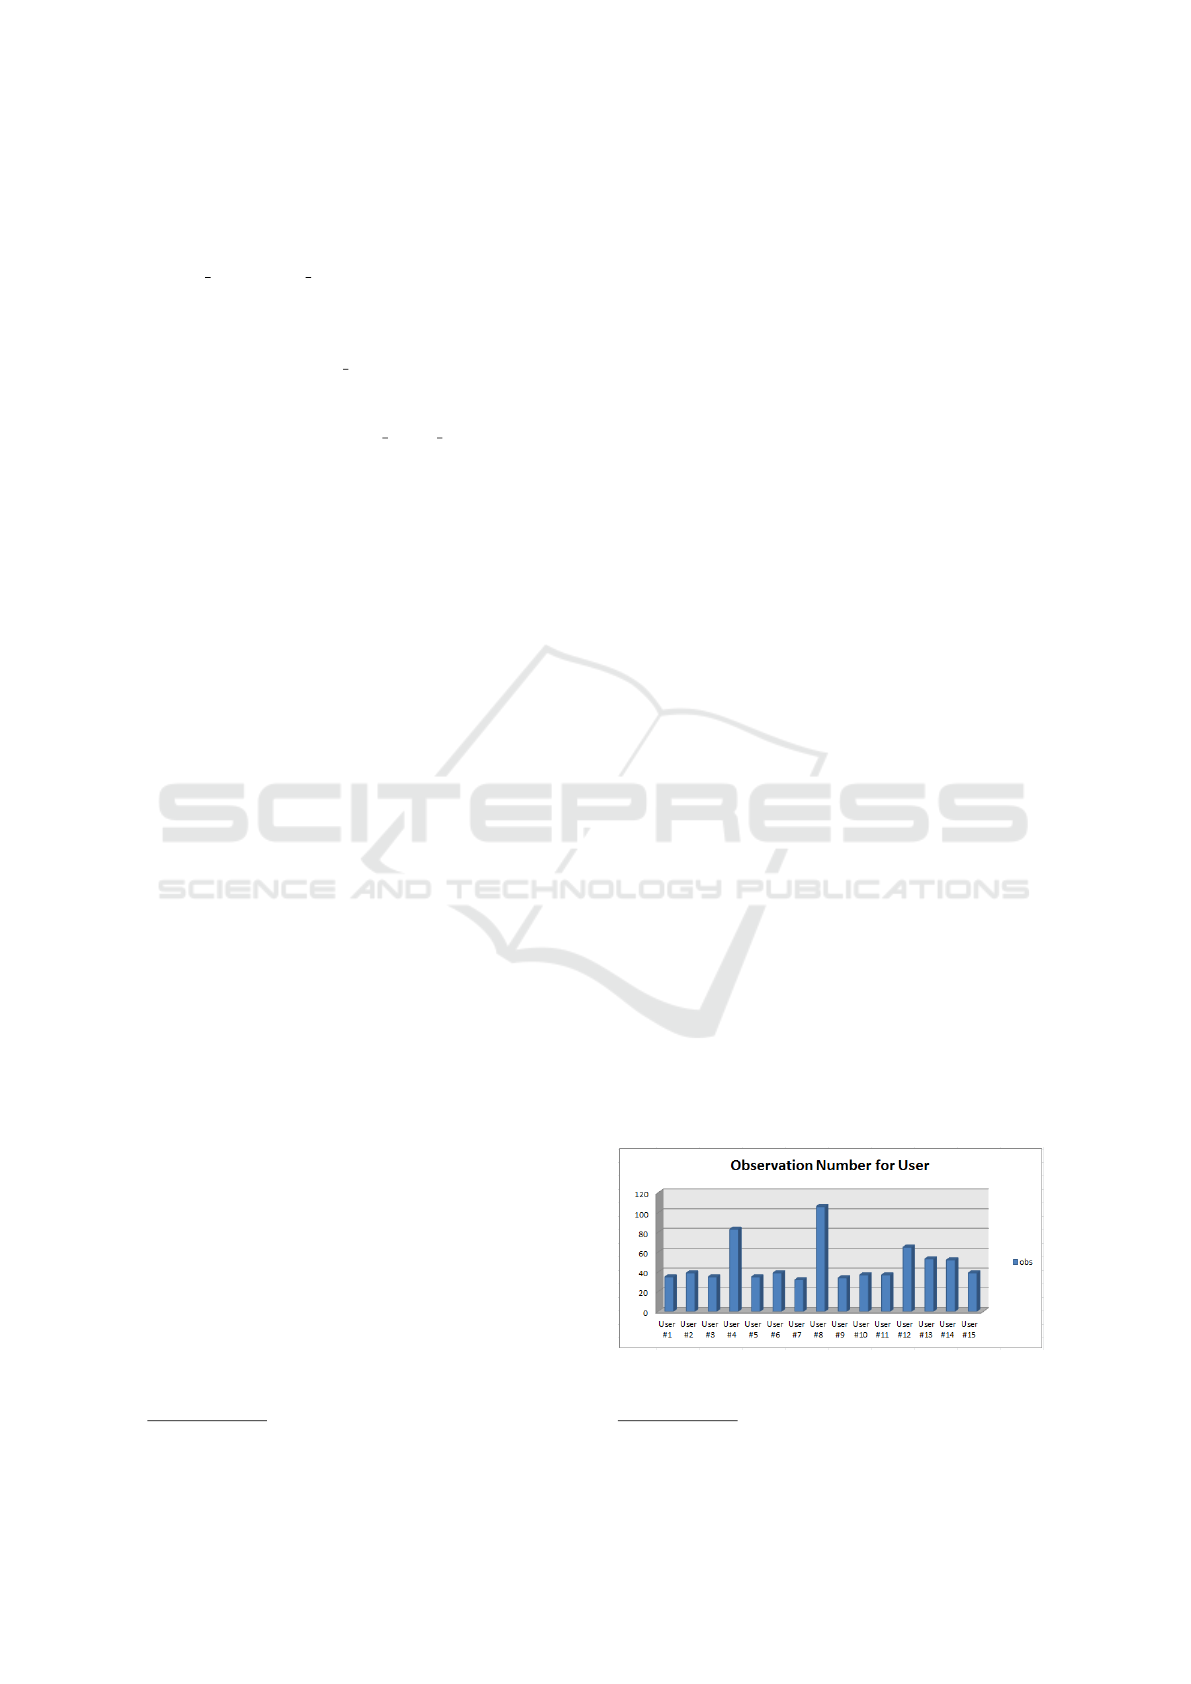
Figure 3 shows the number of observations col-
lected for each user involved in the experiment, i.e.
the number of traces (i.e., the user usage sessions)
gathered from each single device.
Figure 3: Number of observations for each users involved
in the study.
9
http://www.cs.waikato.ac.nz/ml/weka/
Mobile Silent and Continuous Authentication using Apps Sequence
83
Table 1: Devices involved in the evaluation with owner characterization.
User Sex Age Vendor Model O.S. version Smartphone Tablet
#1 F 20 Samsung S4 mini 4.4.2 X
#2 M 24 LG Nexus 5 6.0.1 X
#3 M 54 Samsung Galaxy J1 4.4.2 X
#4 F 24 LG Nexus 5 6.0.1 X
#5 M 16 Asus Zenfone 2 5.0 X
#6 F 30 Samsung Galaxy grand prime 5.1.0 X
#7 M 26 Asus Zenfone 2 5.1.0 X
#8 M 28 Samsung S6 6.0.1 X
#9 M 24 LG Nexus 5 6.0.1 X
#10 F 24 Asus Zenfone 2 5.1.0 X
#11 F 50 Asus Zenpad 7 4.4.2 X
#12 F 50 Asus Zenfone 5 4.4.2 X
#13 F 14 Samsung Tab 2 4.4.2 X
#14 M 55 Samsung Galaxy note 3 4.4.2 X
#15 M 27 Samsung S3 4.3 X
The user with the longest trace number in the
dataset is the user #8, but all the users involved in the
experiment presents a number of observations rang-
ing between 20 and 40: this is symptomatic of the fact
that the users effectively use the device in the every-
day life during the time-window of the experiment.
4.1 Descriptive Statistics
The analysis of box plots related to the feature vector
helps to identify whether the features are helpful to
discriminate the behavior of users or not. For reasons
of space the boxplots related to the F1 (in Figure 4),
F2 (in Figure 5), F3 (in Figure 6)and F4 (in Figure
7)features are reported.
The boxplots related to F1 feature are shown in
Fig 4. It arises that Users #2, #4 and #8 exhibit a
similar distribution, while Users #1,#3,#5,#6, #7, #9,
#10, #11, #12, #13, #14 and #15 present a different
distribution. This suggests that most of users involved
in the experiment usually run different applications
(i.e., 12 Users on 15).
The boxplots related to the F2 feature, are shown
in Fig 5, and indicate that Users #2, #3, #7, #11, #12,
#14 and #15 present a similar distribution of the fea-
tures, while the distribution of Users #1, #4, #5, #6,
#8, #9, #10 behaviors is less varying if compared with
the previous users. As a matter of fact, users exhibit
an evident diversity among each others, which is rep-
resented by the different level of medians for each
user and by the variability of the box plots’ width.
The boxplots related to the F3 feature, are shown
in Fig 6. Users #2, #4, #7, #11, #12, #14 and #15
exhibit a similar distribution that is different from the
one exhibited by the remaining users. As matter of
fact, Users #1, #3, #5, #6 have a tiny distribution,
Users #9 and #10 the thinnest, while User #8 the
widest one.
The boxplots related to the F4 feature, is shown
in Fig 7. Users #2, #4, #7, #11, #12, #14 and #15
exhibit a similar distributions that is different from the
one exhibit by the remaining users. As matter of fact,
Users #1, #3, #5, #6 exhibit a tiny distribution, Users
#9 and #10 the thinnest, while User #8 the widest one.
Very thin distributions are exhibited by users #1,
#3, #6, #9, # 10 and #13, while the widest one corre-
sponds to the Users #8 (as in the previous boxplot in
Fig. 6 representing the distribution of the F3 feature).
The remaining Users i.e. #2, #4, #5, #7, #11, #12, #14
and #15 are pretty similar.
From the boxplot analysis it is possible to con-
clude that from a statical point of view the extracted
features can be a good candidate to discriminate be-
tween users; as a matter of fact, in each box plot dif-
ferent groups of users exhibit different distributions.
This result is indicative that a single application is
not able to distinguish the individual user, but a se-
quence of applications may be able to uniquely iden-
tify the owner, and then to discriminate the impostors
from the owner. The classification analysis will com-
plete the picture, by indicating that the combination
of all the measures can successfully help to identify
correctly the impostors.
4.2 Hypothesis Testing
The hypothesis testing aims at evaluating if the fea-
tures produce different distributions for the popula-
tions of users with statistical evidence.
The results are assumed valid when the null hy-
pothesis is rejected by both the tests performed.
SECRYPT 2017 - 14th International Conference on Security and Cryptography
84
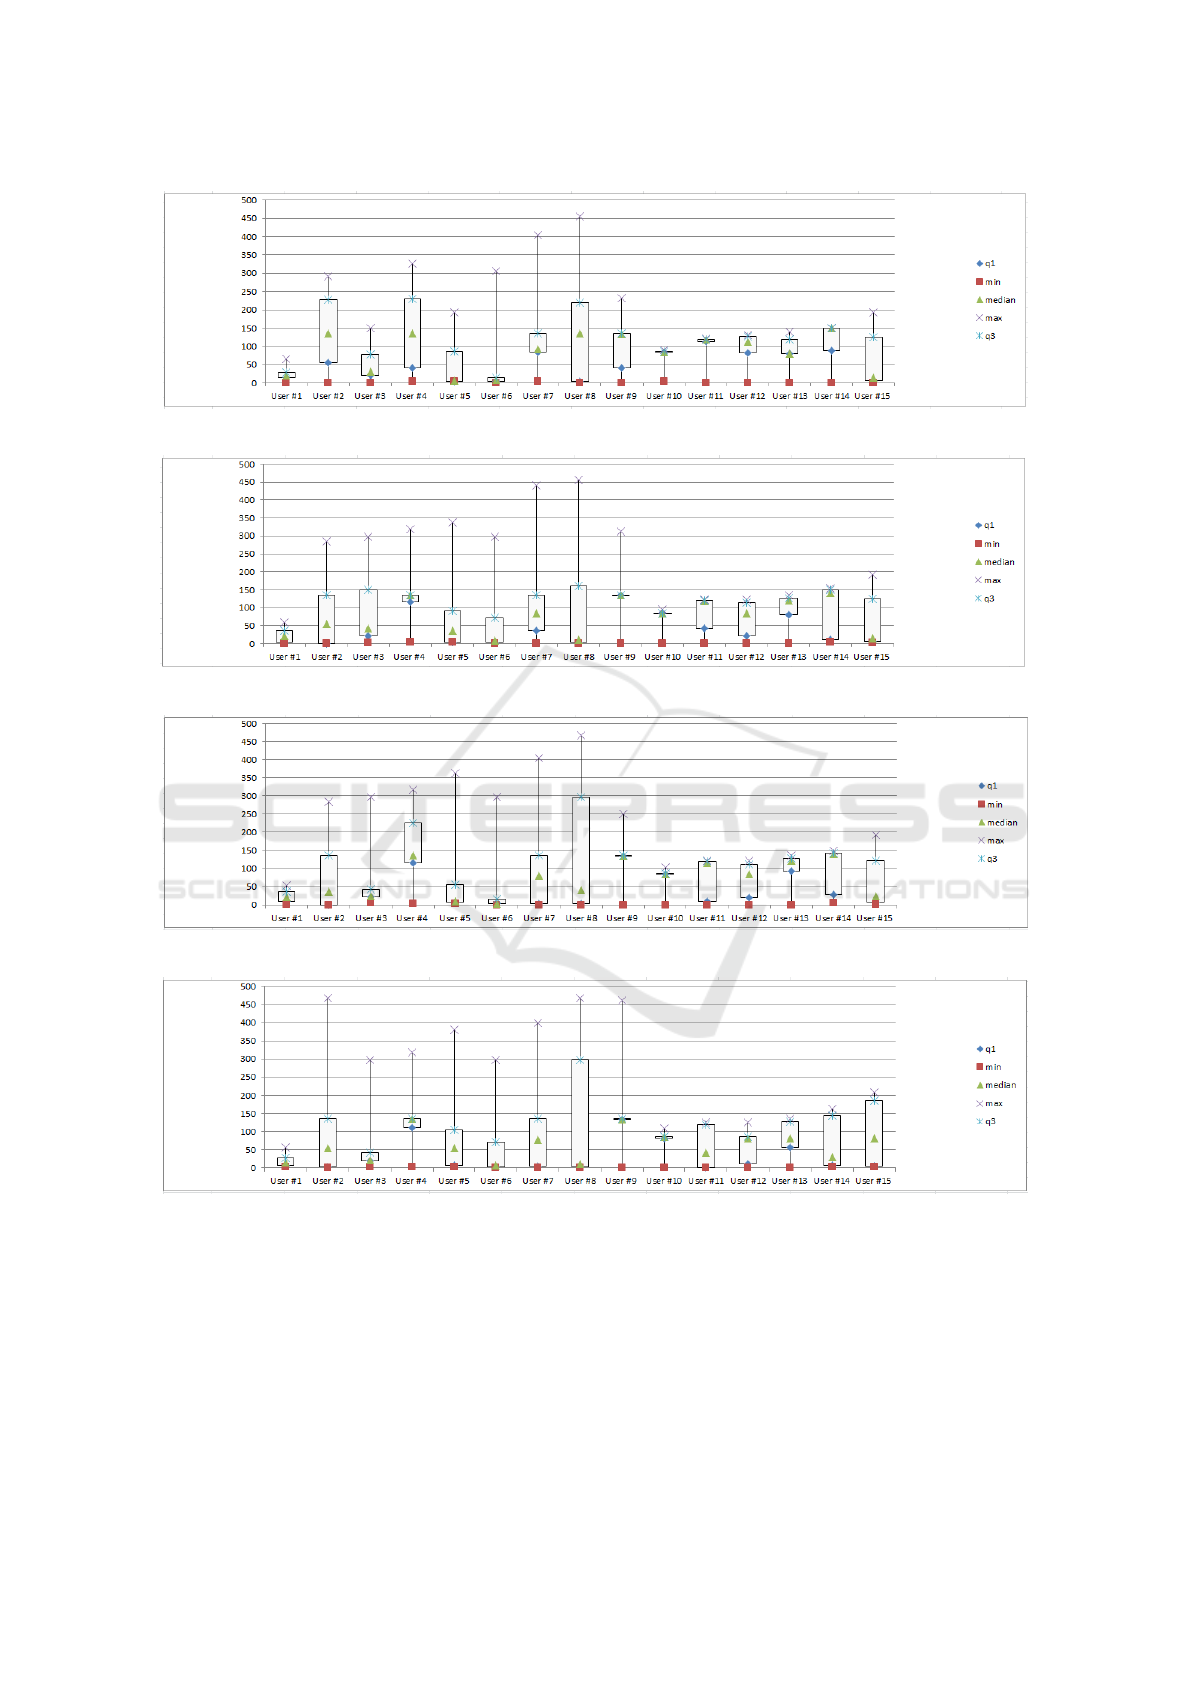
Figure 4: Boxplots related to the distribution of F1 feature.
Figure 5: Boxplots related to the distribution of F2 feature.
Figure 6: Boxplots related to the distribution of F3 feature.
Figure 7: Boxplots related to the distribution of F4 feature.
Mobile Silent and Continuous Authentication using Apps Sequence
85
Table 2 shows the results of hypothesis testing: the
null hypothesis H
0
can be rejected for all the features
i.e., there is statistical evidence that the feature vec-
tor is a potential candidate for correctly classifying a
device’s owner.
Table 2: Results of the test of the null hypothesis H
0
Variable Mann-Whitney Kolmogorov-Smirnov
F1 0,000000 p < .001
F2 0,000000 p < .001
F3 0,000000 p < .001
F4 0,000000 p < .001
For reasons of spaces, Table 2 shows the result of
the Hypothesis testing for the first four features evalu-
ated, but also the remaining features passed the Mann-
Whitney and Kolmogorov-Smirnov tests successfully.
This result will provide an evaluation of the risk
to generalize the fact that the selected features pro-
duce values which belong to two different distribu-
tions (i.e., the one related to the impostors and the
owner).
4.3 Classification Analysis
Seven metrics were used to evaluate the classifica-
tion results: Precision, Recall, F-Measure, ROC Area,
FRR, FAR and ERR.
The precision has been computed as the propor-
tion of the examples that truly belong to class X
among all those which were assigned to the class. It
is the ratio of the number of relevant records retrieved
to the total number of irrelevant and relevant records
retrieved:
Precision =
t p
t p+ f p
where tp indicates the number of true positives
and fp indicates the number of false positives.
The recall has been computed as the proportion
of examples that were assigned to class X, among all
the examples that truly belong to the class, i.e., how
much part of the class was captured. It is the ratio of
the number of relevant records retrieved to the total
number of relevant records:
Recall =
t p
t p+ f n
where tp indicates the number of true positives
and fn indicates the number of false negatives.
The F-Measure is a measure of a test’s accuracy.
This score can be interpreted as a weighted average of
the precision and recall:
F-Measure = 2 ∗
Precision∗Recall
Precision+Recall
The Roc Area is defined as the probability that a
positive instance randomly chosen is classified above
a negative randomly chosen.
The last three metrics considered are used in bio-
metrics in order to verify the instance of a security
system that incorrectly identifies an unauthorized per-
son: FAR, FRR and EER.
The FAR (i.e., false acceptance rate) is the
measure of the likelihood that the biometric security
system will incorrectly accept an access attempt by
an unauthorized user. A system’s FAR typically is
stated as the ratio of the number of false acceptances
(fa) divided by the number of impostor attempts (ia):
False Acceptance Rate =
f a
ia
The FAR spans in the interval [0,1]: closer to 0
the FAR is the better is the capability to recognize
correctly the impostor.
The FRR (i.e., false recognition rate) is the mea-
sure of the likelihood that the biometric security sys-
tem will incorrectly reject an access attempt by an au-
thorized user. A system’s FRR typically is stated as
the ratio of the number of false rejections (fr) divided
by the number of owner attempts (oa).
The FRR is defined as:
False Rejection Rate =
f r
oa
The best FRR has the value of 0, while the worst
FRR has the values of 1.
The EER (i.e. equal error rate) of a system can
be used to give a threshold independent performance
measure: it represents a biometric security system
algorithm used to predetermines the threshold values
for its false acceptance rate and its false rejection
rate. When the rates are equal, the common value is
referred to as the equal error rate. The value indicates
that the proportion of false acceptances is equal to
the proportion of false rejections. The lower the EER
is, the better is the system’s performance, as the total
error rate which is the sum of the FAR and the FRR at
the point of the EER decreases. The EER is defined
as:
Equal Error Rate =
FAR+FRR
2
The classification analysis consisted of building
classifiers in order to evaluate the features vector ac-
curacy to distinguish between impostors and owner.
For training the classifier, T is a set of labelled
behavior traces (BT, l), where each BT is associated to
SECRYPT 2017 - 14th International Conference on Security and Cryptography
86

a label l ∈ {impostor, owner}. For each BT a feature
vector F ∈ R
y
is built, where y is the number of the
features used in training phase (y=1000).
For the learning phase, a k-fold cross-validation
was used: the dataset is randomly partitioned into k
subsets. A single subset is retained as the validation
dataset for testing the model, while the remaining k-
1 subsets of the original dataset are used as training
data. The process is repeated for k=10 times; each one
of the k subsets has been used once as the validation
dataset. To obtain a single estimate, the average of the
k results is computed from the folds.
The effectiveness of the classification method is
evaluated with the following procedure:
1. build a training set T⊂D;
2. build a testing set T’ = D÷T;
3. run the training phase on T;
4. apply the learned classifier to each element of T’.
A 10-fold cross validation was performed: the
four steps are repeated 10 times, varying the compo-
sition of T (and hence of T’), classifying the full set
of features.
Each classification was performed using 20% of
the dataset as training dataset and 80% as testing
dataset.
C
u,s
is the set of the classifications performed,
where u identifies the user (1≤u≤15).
For sake of clarity an example will explain the
method adopted: C
2
classification means that the
traces related to the user #2 are labeled as owner
traces, while the traces of the other user as impostor.
The results obtained with this procedure are
shown in Table 3 and Table 4.
The classification results suggest that frequently
recurrent sequences of apps can be good features to
recognize the legitimate device owner from an impos-
tor, as for most experimental subjects, the precision
and the recall range between 92% and 99%. The gap
between the two interval’s edges is about 7 percent-
age points, which is pretty wide. This could indicate
that some users have certain sequences of apps that
are more recurrent than other users.
What is worth attention is the obtained EER,
which ranges from 0.045 to 0.476: this result is the
main relevant finding of the experimentation, since it
is very low, especially if compared with the EER pro-
duced by other methods of continuous authentication,
discussed in the section of Related Work.
In order to measure the performance of the pro-
posed method, the average times employed for the
classification task was measured, for each classifica-
tion algorithm run obtaining: 0.82 s with J48, 6.74 s
with LADTree, 0.3 s with RandomForest, 0.5 s with
RandomTree, 0.25 s with REPTree and 1.49 s with
SimpleCart algorithm. The machine used was an In-
tel Core i5 desktop with 4 gigabyte RAM, equipped
with Linux Mint 15.
In the light of the obtained results, it is possible
to conclude that recurrent sequences of apps could be
a good candidate indicator for recognizing the legiti-
mate owner of the device. This method does not im-
pact the privacy of the owner, as it does not elaborate
users’ data, nor biometrics (which if compromised
cannot be replaced). Moreover the method demon-
strated to be not particularly costly in terms of com-
putational resources. The only limitation of the exper-
iment stands in the number of experimental subjects,
which is not very high, even if the time window for
collecting the observations is quite wide. For this rea-
son, the validation should be considered as a prelim-
inary exploration of the effectiveness of the method
and deserves further replications in huger contexts.
5 CONCLUSION AND FUTURE
WORKS
The current authentication mechanisms provided by
the mobile operating systems are not able to ensure
that an adversary may have access to another user’s
smartphone. As matter of fact, once the user has un-
locked the device by entering the PIN code, the oper-
ating system does not perform any checks on the user
of the device. In order to overcome this limitation this
paper proposes a method able to silently and continu-
ously authenticate the user. A features vector consist-
ing in the sequence of the recurring apps is used for
profiling the user; with machine learning techniques
such a vector is applied for distinguishing the impos-
tors from the legitimate user. Results are significantly
better than those reported in current literature: a preci-
sion and a recall equal to 0.99 collecting data from 15
volunteer participants in a 21-day time window have
been obtained. As future work, we plan to correlate
the apps sequence with the activation of resources as
Wi-fi, bluetooth and gps in order to enforce the con-
tinuous and silent authentication mechanism.
ACKNOWLEDGEMENTS
This work has been partially supported by H2020
EU-funded projects NeCS and C3ISP and EIT-Digital
Project HII.
Mobile Silent and Continuous Authentication using Apps Sequence
87
Table 3: Classification results for Users #1, #2, #3, #4, #5, #6 and #7: Precision, Recall, F-Measure, RocArea, FRR, FAR and
ERR for classifying the feature set, computed with six different classification algorithms. The Time column represents the
time in seconds taken to build the model.
Category Algorithm Precision Recall F-Measure Roc Area FRR FAR ERR
J48 0.968 0.964 0.966 0.778 0.036 0.246 0.141
LADTree 0.976 0.975 0.975 0.858 0.028 0.218 0.123
User #1 RandomForest 0.994 0.994 0.994 0.995 0.004 0.082 0.045
RandomTree 0.982 0.979 0.98 0.935 0.021 0.110 0.065
REPTree 0.967 0.967 0.967 0.881 0.033 0.327 0.18
SimpleCart 0.976 0.976 0.976 0.84 0.024 0.272 0.148
J48 0.902 0.906 0.903 0.809 0.094 0.329 0.211
LADTree 0.901 0.907 0.902 0.853 0.094 0.36 0.231
User #2 RandomForest 0.923 0.926 0.921 0.926 0.071 0.348 0.209
RandomTree 0.896 0.899 0.897 0.796 0.101 0.330 0.215
REPTree 0.886 0.896 0.885 0.809 0.104 0.471 0.28
SimpleCart 0.9 0.907 0.901 0.786 0.093 0.391 0.242
J48 0.964 0.963 0.963 0.83 0.068 0.643 0.355
LADTree 0.937 0.942 0.939 0.837 0.058 0.674 0.366
User #3 RandomForest 0.967 0.965 0.956 0.94 0.051 0.898 0.474
RandomTree 0.951 0.95 0.951 0.736 0.074 0.699 0.385
REPTree 0.933 0.945 0.938 0.758 0.055 0.898 0.476
SimpleCart 0.908 0.953 0.93 0.463 0.047 0.953 0.5
J48 0.931 0.932 0.932 0.652 0.068 0.643 0.355
LADTree 0.924 0.938 0.93 0.902 0.062 0.77 0.416
User #4 RandomForest 0.934 0.95 0.934 0.889 0.051 0.898 0.474
RandomTree 0.927 0.926 0.927 0.629 0.074 0.669 0.371
REPTree 0.917 0.945 0.926 0.613 0.055 0.898 0.476
SimpleCart 0.927 0.949 0.926 0.545 0.051 0.923 0.487
J48 0.928 0.933 0.931 0.567 0.067 0.694 0.380
LADTree 0.921 0.936 0.928 0.636 0.062 0.796 0.429
User #5 RandomForest 0.9 0.947 0.923 0.89 0.051 0.949 0.5
RandomTree 0.93 0.928 0.929 0.642 0.072 0.643 0.357
REPTree 0.953 0.95 0.927 0.632 0.5 0.923 0.486
SimpleCart 0.9 0.949 0.924 0.47 0.051 0.949 0.5
J48 0.928 0.933 0.93 0.76 0.067 0.436 0.251
LADTree 0.938 0.943 0.938 0.946 0.057 0.449 0.253
User #6 RandomForest 0.928 0.935 0.924 0.941 0.061 0.547 0.304
RandomTree 0.929 0.924 0.926 0.797 0.076 0.326 0.201
REPTree 0.925 0.929 0.927 0.832 0.071 0.423 0.247
SimpleCart 0.929 0.933 0.93 0.829 0.067 0.422 0.244
J48 0.897 0.92 0.905 0.565 0.69 0.771 0.425
LADTree 0.882 0.904 0.892 0.605 0.096 0.807 0.451
User #7 RandomForest 0.934 0.939 0.921 0.856 0.062 0.735 0.398
RandomTree 0.897 0.9 0.898 0.61 0.1 0.668 0.384
REPTree 0.879 0.921 0.893 0.586 0.079 0.892 0.485
SimpleCart 0.858 0.926 0.891 0.479 0.074 0.926 0.5
SECRYPT 2017 - 14th International Conference on Security and Cryptography
88

Table 4: Classification results for Users #8, #9, #10, #11, #12, #13, #14 and #15: Precision, Recall, F-Measure, RocArea,
FRR, FAR and ERR for classifying the feature set, computed with six different classification algorithms. The Time column
represents the time in seconds taken to build the model.
Category Algorithm Precision Recall F-Measure Roc Area FRR FAR ERR
J48 0.924 0.933 0.927 0.622 0.067 0.59 0.328
LADTree 0.948 0.953 0.948 0.867 0.01 0.411 0.21
User #8 RandomForest 0.972 0.971 0.967 0.941 0.032 0.41 0.221
RandomTree 0.949 0.95 0.95 0.802 0.05 0.341 0.195
REPTree 0.932 0.942 0.933 0.679 0.058 0.608 0.333
SimpleCart 0.935 0.943 0.932 0.643 0.057 0.643 0.35
J48 0.943 0.945 0.944 0.681 0.055 0.511 0.283
LADTree 0.947 0.95 0.948 0.801 0.05 0.511 0.280
User #9 RandomForest 0.95 0.956 0.944 0.845 0.049 0.849 0.449
RandomTree 0.911 0.908 0.91 0.561 0.092 0.779 0.435
REPTree 0.946 0.954 0.943 0.727 0.046 0.728 0.387
SimpleCart 0.958 0.961 0.953 0.737 0.039 0.631 0.335
J48 0.968 0.968 0.968 0.876 0.032 0.292 0.162
LADTree 0.955 0.958 0.956 0.879 0.035 0.413 0.224
User #10 RandomForest 0.965 0.967 0.961 0.914 0.029 0.485 0.257
RandomTree 0.948 0.953 0.95 0.704 0.047 0.535 0.291
REPTree 0.965 0.965 0.965 0.874 0.035 0.316 0.175
SimpleCart 0.957 0.961 0.958 0.856 0.039 0.486 0.262
J48 0.976 0.972 0.974 0.939 0.028 0.164 0.096
LADTree 0.968 0.968 0.968 0.911 0.032 0.327 0.179
User #11 RandomForest 0.968 0.971 0.968 0.967 0.026 0.354 0.19
RandomTree 0.964 0.964 0.964 0.805 0.036 0.354 0.195
REPTree 0.975 0.972 0.973 0.923 0.028 0.191 0.109
SimpleCart 0.968 0.968 0.968 0.955 0.032 0.327 0.179
J48 0.934 0.936 0.935 0.878 0.064 0.281 0.172
LADTree 0.937 0.94 0.936 0.941 0.06 0.354 0.207
User #12 RandomForest 0.95 0.951 0.948 0.941 0.05 0.31 0.405
RandomTree 0.921 0.921 0.921 0.807 0.079 0.304 0.191
REPTree 0.925 0.931 0.926 0.917 0.069 0.386 0.227
SimpleCart 0.945 0.947 0.944 0.862 0.053 0.3 0.176
J48 0.95 0.954 0.952 0.848 0.046 0.545 0.295
LADTree 0.945 0.953 0.948 0.86 0.047 0.626 0.336
User #13 RandomForest 0.938 0.953 0.939 0.868 0.046 0.816 0.431
RandomTree 0.946 0.945 0.945 0.713 0.055 0.518 0.286
REPTree 0.95 0.957 0.952 0.843 0.043 0.599 0.321
SimpleCart 0.948 0.957 0.948 0.742 0.043 0.707 0.375
J48 0.977 0.978 0.976 0.796 0.022 0.34 0.181
LADTree 0.966 0.968 0.967 0.893 0.032 0.34 0.186
User #14 RandomForest 0.961 0.96 0.948 0.89 0.047 0.825 0.436
RandomTree 0.927 0.914 0.92 0.664 0.086 0.585 0.335
REPTree 0.965 0.968 0.966 0.815 0.032 0.413 0.222
SimpleCart 0.969 0.971 0.97 0.826 0.029 0.34 0.184
J48 0.931 0.922 0.926 0.68 0.078 0.719 0.398
LADTree 0.933 0.945 0.938 0.681 0.055 0.777 0.416
User #15 RandomForest 0.937 0.956 0.937 0.825 0.044 0.956 0.5
RandomTree 0.931 0.933 0.932 0.593 0.067 0.748 0.407
REPTree 0.959 0.957 0.937 0.632 0.043 0.926 0.484
SimpleCart 0.929 0.954 0.936 0.529 0.046 0.926 0.486
Mobile Silent and Continuous Authentication using Apps Sequence
89

REFERENCES
Abeni, P., Baltatu, M., and D’Alessandro, R. (2006). Nis03-
4: Implementing biometrics-based authentication for
mobile devices. In Global Telecommunications Con-
ference, 2006. GLOBECOM’06. IEEE, pages 1–5.
IEEE.
Aviv, A. J., Gibson, K. L., Mossop, E., Blaze, M., and
Smith, J. M. (2010). Smudge attacks on smartphone
touch screens. Woot, 10:1–7.
BenAbdelkader, C., Cutler, R., and Davis, L. (2002). Person
identification using automatic height and stride esti-
mation. In Pattern Recognition, 2002. Proceedings.
16th International Conference on, volume 4, pages
377–380. IEEE.
Bo, C., Zhang, L., Li, X.-Y., Huang, Q., and Wang, Y.
(2013). Silentsense: silent user identification via
touch and movement behavioral biometrics. In Pro-
ceedings of the 19th annual international conference
on Mobile computing & networking, pages 187–190.
ACM.
Buriro, A., Crispo, B., Delfrari, F., and Wrona, K. (2016).
Hold and sign: A novel behavioral biometrics for
smartphone user authentication. In Security and Pri-
vacy Workshops (SPW), 2016 IEEE, pages 276–285.
IEEE.
Canfora, G., Di Notte, P., Mercaldo, F., and Visaggio, C. A.
(2016). Silent and continuous authentication in mobile
environment. In SECRYPT.
Clarke, N. (2011). Transparent user authentication: bio-
metrics, RFID and behavioural profiling. Springer
Science & Business Media.
Clarke, N. L. and Furnell, S. M. (2005). Authentication of
users on mobile telephones–a survey of attitudes and
practices. Computers & Security, 24(7):519–527.
Crouse, D., Han, H., Chandra, D., Barbello, B., and Jain,
A. K. (2015). Continuous authentication of mobile
user: Fusion of face image and inertial measurement
unit data. In Biometrics (ICB), 2015 International
Conference on, pages 135–142. IEEE.
De Luca, A., Hang, A., Brudy, F., Lindner, C., and Huss-
mann, H. (2012). Touch me once and i know it’s you!:
implicit authentication based on touch screen patterns.
In Proceedings of the SIGCHI Conference on Human
Factors in Computing Systems, pages 987–996. ACM.
Derawi, M. O., Nickel, C., Bours, P., and Busch, C. (2010).
Unobtrusive user-authentication on mobile phones us-
ing biometric gait recognition. In Intelligent Informa-
tion Hiding and Multimedia Signal Processing (IIH-
MSP), 2010 Sixth International Conference on, pages
306–311. IEEE.
Fathy, M. E., Patel, V. M., and Chellappa, R. (2015). Face-
based active authentication on mobile devices. In
Acoustics, Speech and Signal Processing (ICASSP),
2015 IEEE International Conference on, pages 1687–
1691. IEEE.
Frank, M., Biedert, R., Ma, E., Martinovic, I., and Song, D.
(2013). Touchalytics: On the applicability of touch-
screen input as a behavioral biometric for continu-
ous authentication. IEEE transactions on information
forensics and security, 8(1):136–148.
Gafurov, D., Helkala, K., and Søndrol, T. (2006). Biometric
gait authentication using accelerometer sensor. JCP,
1(7):51–59.
Guidorizzi, R. P. (2013). Security: active authentication. IT
Professional, 15(4):4–7.
Hadid, A., Heikkila, J., Silv
´
en, O., and Pietikainen, M.
(2007). Face and eye detection for person authenti-
cation in mobile phones. In Distributed Smart Cam-
eras, 2007. ICDSC’07. First ACM/IEEE International
Conference on, pages 101–108. IEEE.
Harbach, M., Von Zezschwitz, E., Fichtner, A., De Luca,
A., and Smith, M. (2014). Itsa hard lock life: A field
study of smartphone (un) locking behavior and risk
perception. In Symposium on usable privacy and se-
curity (SOUPS), pages 213–230.
Jakobsson, M., Shi, E., Golle, P., and Chow, R. (2009). Im-
plicit authentication for mobile devices. In Proceed-
ings of the 4th USENIX conference on Hot topics in
security, pages 9–9. USENIX Association.
Kim, D.-J., Chung, K.-W., and Hong, K.-S. (2010). Per-
son authentication using face, teeth and voice modali-
ties for mobile device security. IEEE Transactions on
Consumer Electronics, 56(4).
Li, L., Zhao, X., and Xue, G. (2013). Unobservable re-
authentication for smartphones. In NDSS.
Mantyjarvi, J., Lindholm, M., Vildjiounaite, E., Makela,
S.-M., and Ailisto, H. (2005). Identifying users of
portable devices from gait pattern with accelerome-
ters. In Acoustics, Speech, and Signal Processing,
2005. Proceedings.(ICASSP’05). IEEE International
Conference on, volume 2, pages ii–973. IEEE.
Murmuria, R., Medsger, J., Stavrou, A., and Voas, J. M.
(2012). Mobile application and device power usage
measurements. In Software Security and Reliability
(SERE), 2012 IEEE Sixth International Conference
on, pages 147–156. IEEE.
Neal, T. J., Woodard, D. L., and Striegel, A. D. (2015). Mo-
bile device application, bluetooth, and wi-fi usage data
as behavioral biometric traits. In Biometrics Theory,
Applications and Systems (BTAS), 2015 IEEE 7th In-
ternational Conference on, pages 1–6. IEEE.
Patel, V. M., Chellappa, R., Chandra, D., and Barbello,
B. (2016). Continuous user authentication on mobile
devices: Recent progress and remaining challenges.
IEEE Signal Processing Magazine, 33(4):49–61.
Patel, V. M., Gopalan, R., Li, R., and Chellappa, R. (2015).
Visual domain adaptation: A survey of recent ad-
vances. IEEE signal processing magazine, 32(3):53–
69.
Saevanee, H. and Bhatarakosol, P. (2008). User authentica-
tion using combination of behavioral biometrics over
the touchpad acting like touch screen of mobile de-
vice. In Computer and Electrical Engineering, 2008.
ICCEE 2008. International Conference on, pages 82–
86. IEEE.
ˇ
Sed
ˇ
enka, J., Govindarajan, S., Gasti, P., and Balagani, K. S.
(2015). Secure outsourced biometric authentication
with performance evaluation on smartphones. IEEE
SECRYPT 2017 - 14th International Conference on Security and Cryptography
90

Transactions on Information Forensics and Security,
10(2):384–396.
Seo, H., Kim, E., and Kim, H. K. (2012). A novel biometric
identification based on a user’s input pattern analysis
for intelligent mobile devices. International Journal
of Advanced Robotic Systems, 9(2):46.
Shi, E., Niu, Y., Jakobsson, M., and Chow, R. (2010). Im-
plicit authentication through learning user behavior.
In International Conference on Information Security,
pages 99–113. Springer.
Shye, A., Scholbrock, B., and Memik, G. (2009). Into
the wild: studying real user activity patterns to guide
power optimizations for mobile architectures. In
Microarchitecture, 2009. MICRO-42. 42nd Annual
IEEE/ACM International Symposium on, pages 168–
178. IEEE.
Smith, D. F., Wiliem, A., and Lovell, B. C. (2015). Binary
watermarks: a practical method to address face recog-
nition replay attacks on consumer mobile devices. In
Identity, Security and Behavior Analysis (ISBA), 2015
IEEE International Conference on, pages 1–6. IEEE.
Zhao, X., Feng, T., and Shi, W. (2013). Continuous mo-
bile authentication using a novel graphic touch ges-
ture feature. In Biometrics: Theory, Applications and
Systems (BTAS), 2013 IEEE Sixth International Con-
ference on, pages 1–6. IEEE.
Zheng, N., Bai, K., Huang, H., and Wang, H. (2014). You
are how you touch: User verification on smartphones
via tapping behaviors. In Network Protocols (ICNP),
2014 IEEE 22nd International Conference on, pages
221–232. IEEE.
Mobile Silent and Continuous Authentication using Apps Sequence
91
