
A Fuzzy Logic-based Approach for Assessing the Quality of Business
Process Models
Fadwa Yahya
1
, Khouloud Boukadi
1
, Han
ˆ
ene Ben Abdallah
1,2
and Zakaria Maamar
3
1
University of Sfax, Mir@cl Laboratory, Sfax, Tunisia
2
King Abdulaziz University, Jeddah, K.S.A.
3
Zayed University, Dubai, U.A.E.
Keywords:
Business Process, BPMN, Model Quality, Quality Metrics and Fuzzy Logic.
Abstract:
Similar to software products, the quality of a Business Process model is vital to the success of all the phases of
its lifecycle. Indeed, a high quality BP model paves the way to the successful implementation, execution and
performance of the business process. In the literature, the quality of a BP model has been assessed through
either the application of formal verification, or most often the evaluation of quality metrics calculated in the
static and/or simulated model. Each of these assessment means addresses different quality characteristics and
meets particular analysis needs. In this paper, we adopt metrics-based assessment to evaluate the quality of
business process models, modeled with Business Process Modeling and Notation (BPMN), in terms of their
comprehensibility and modifiability. We propose a fuzzy logic-based approach that uses existing quality met-
rics for assessing the attainment level of these two quality characteristics. By analyzing the static model, the
proposed approach is easy and fast to apply. In addition, it overcomes the threshold determination problem
by mining a repository of BPMN models. Furthermore, by relying on fuzzy logic, it resembles human rea-
soning during the evaluation of the quality of business process models. We illustrate the approach through a
case study and its tool support system developed under the eclipse framework. The preliminary experimental
evaluation of the proposed system shows encouraging results.
1 INTRODUCTION
A Business Process (BP) model covers different di-
mensions of an enterprise, mainly functional, organi-
zational, behavioral, and informational (Curtis et al.,
1992). Integrating all these dimensions into one high-
quality model is vital to the persistence of the enter-
prise (S
´
anchez-Gonz
´
alez et al., 2010) and (de Oca
et al., 2015). Indeed, such a model will surely fa-
cilitate various tasks related to its implementation,
deployment, execution, and continuous improvement
in short, the BP lifecycle (Weske, 2010). A high-
quality BP model will also guarantee its acceptance
by end users and thus prevent common BP problems
like model reality divide where the modeled and exe-
cuted processes are not aligned (Schmidt and Nurcan,
2009).
In the literature, BP model quality assessment has
been dealt with two main approaches: the application
of formal verification methods (Watahiki et al., 2011)
and (Morimoto, 2008), or the evaluation of a set of
quality metrics calculated on the BP model (S
´
anchez-
Gonz
´
alez et al., 2010), (Mendling et al., 2012), and
(de Oca et al., 2015). Formal methods (e.g., model
checking and theorem proving) provide for the verifi-
cation of behavioral quality properties like progress
and deadlock freedom. While they offer objective
analysis results that inspire high confidence, their ap-
plication remains hindered by their complexity. In
addition, they do not provide for a qualitative analy-
sis of the model like its complexity, comprehensibility
and modifiability; these quality characteristics impact
both various tasks of the BP lifecycle and the perfor-
mance of the enacted BP.
Adopting a qualitative assessment of BP models,
researchers proposed to calculate a set of metrics ei-
ther on the static BP model (e.g. (S
´
anchez-Gonz
´
alez
et al., 2010), (Mendling et al., 2012), and (de Oca
et al., 2015)), or the simulated BP model (e.g. (Hein-
rich, 2013)). In these works, several quality metrics
were used either to assess certain quality character-
istics of the BP model itself (case of static model
assessment of, for instance, the model complexity,
maintainability, Integrity, etc. (Mendling et al., 2012),
Yahya, F., Boukadi, K., Ben-Abdallah, H. and Maamar, Z.
A Fuzzy Logic-based Approach for Assessing the Quality of Business Process Models.
DOI: 10.5220/0006419500610072
In Proceedings of the 12th International Conference on Software Technologies (ICSOFT 2017), pages 61-72
ISBN: 978-989-758-262-2
Copyright © 2017 by SCITEPRESS – Science and Technology Publications, Lda. All rights reserved
61

(Makni et al., 2010), and (Sadowska, 2015)) or to pre-
dict the BP performance (case of simulated model as-
sessment of, for instance, the mutual impact between
the BP and its underlying information system (Hein-
rich, 2013)). The main challenges in metric-based as-
sessment are: what are the quality characteristics of a
BP model, how to relate the metrics to quality char-
acteristics, and how to interpret the values of the met-
rics.
There is no consensus on the quality character-
istics of BP models. Several researchers explored
the similarities between processes and software prod-
ucts to adopt the quality characteristics of the latter
for business processes. In particular, they adopted
the eight model quality characteristics defined in the
ISO/IEC 25010 (ISO, 2011) standard quality model,
e.g. (S
´
anchez-Gonz
´
aLez et al., 2013) and (Sadowska,
2015). Because the ISO/IEC 25010 quality model
does not define any technique for the evaluation of the
characteristics, different studies recommended vari-
ous metrics for assessing the quality of BP models
in terms of the proposed characteristics, e.g. (Van-
derfeesten et al., 2007a), (Vanderfeesten et al., 2008),
(Cardoso et al., 2010), (S
´
anchez-Gonz
´
aLez et al.,
2013), and (Sadowska, 2015). In addition, based
on the recommended metrics, some researchers pro-
posed the development of an automated framework to
evaluate BP model quality, e.g. (S
´
anchez-Gonz
´
alez
et al., 2010), (S
´
anchez-Gonz
´
alez et al., 2011) and
(Mendling et al., 2012). The common barrier hinder-
ing the development of such a framework is the lack
of a consensus about threshold values of the quality
metrics, which are required to interpret/evaluate a BP
model’s quality (S
´
anchez-Gonz
´
alez et al., 2010) and
(de Oca et al., 2015). This paper addresses this prob-
lem through a fuzzy logic-based approach for evalu-
ating the quality of BP models with an emphasis on
the comprehensibility and modifiability characteris-
tics. The choice of these two quality characteristics
is justified by their importance to guarantee that a BP
model can be easily implemented, deployed, and exe-
cuted. These characteristics are also important when
dealing with the continuous improvement of a BP.
The herein proposed approach consists of two es-
sential phases: threshold determination and fuzzy
logic application. The first phase applies data min-
ing, specifically decision trees, to determine approxi-
mate thresholds for each quality metric. These thresh-
olds will be used for interpreting the comprehen-
sibility or modifiability levels of BP models, mod-
eled in BPMN (ISO, 2013). To this end, we used a
BP repository, called “SOA-based Business Process
Database”
1
, built within our laboratory. This repos-
1
https://sites.google.com/site/bposcteam2015/ressources
itory contains 1000 business processes of organiza-
tions operating in different sectors. The second phase
uses the approximate thresholds identified in the first
phase along with fuzzy logic (Zadeh, 1965) to assess
the quality of a BPMN model. The use of fuzzy logic
aims at dealing with the approximate and imprecise
nature of the obtained thresholds. Indeed, according
to Zadeh, fuzzy logic operates perfectly in an environ-
ment of “imperfect information” (Zadeh, 2008).
The proposed approach is implemented in a sys-
tem that allows the qualitative assessment of BPMN
models in terms of comprehensibility and modifiabil-
ity. To prove the performance of the proposed system,
we conducted two types of experiments. The former
is done through the proposed system while the second
is accomplished in conjunction with students from our
college. These preliminary experimental evaluations
of the proposed system show encouraging results.
To recapitulate, this paper has a three-fold con-
tributions: (i) identification of approximate thresh-
olds for the different quality metrics to be used for
assessing the quality of BP models in terms of com-
prehensibility and modifiability; (ii) management of
the approximate and imprecise nature of the identi-
fied thresholds using fuzzy logic; and (iii) proposition
of a system that supports the proposed approach.
The remainder of this paper is organized as fol-
lows: Section 2 summarizes existing works on the
adoption of quality metrics and the definition of their
thresholds for the assessment of the comprehensibil-
ity and modifiability of BP models. Section 3 presents
the proposed approach mining metrics’ thresholds.
Section 4 shows how we use fuzzy logic to support
the approximate and imprecise nature of the defined
thresholds. Section 5 illustrates the developed sys-
tem of BP model quality assessment. Section 6 evalu-
ates the proposed system through two types of exper-
iments. Finally, section 7 summarizes the paper and
gives some directions for future work.
2 RELATED WORKS
We first overview the quality metrics used in the liter-
ature to assess the comprehensibility and modifiabil-
ity of BP models. Second, we discuss works on BP
model quality assessment.
2.1 Quality Metrics
Different research initiatives adopt quality metrics
from the software engineering to assess the quality
of BP models. They consider that business processes
ICSOFT 2017 - 12th International Conference on Software Technologies
62

are a kind of software systems (Reijers and Vander-
feesten, 2004), (Guceglioglu and Demirors, 2005),
(Cardoso et al., 2006), and (S
´
anchez-Gonz
´
aLez et al.,
2013). The adopted quality metrics are used to as-
sess BP models quality in terms of different charac-
teristics among those defined in the ISO/IEC 25010
quality model (ISO, 2011). In this paper, we use ex-
isting metrics to put in place an approach as well as a
support system for BP models quality assessment.
To this end, we have conducted a literature review
on existing quality metrics for assessing the compre-
hensibility and modifiability levels of BP models. To
shortlist the relevant metrics, we raised the following
questions:
1. Is the metric validated either theoretically or em-
pirically?
2. Is there a method for calculating the metric?
3. Is it possible to calculate the metric for BP mod-
eled in BPMN?
4. Is the metric used to evaluate the comprehensibil-
ity and/or the modifiability of BP models?
At the end of this study, only a few number metrics
were retained. The metrics were eliminated essen-
tially by the first question; indeed, several metrics
are adopted from the software engineering domain but
they are not validated in the BP domain neither theo-
retically nor empirically (Muketha et al., 2010). In ad-
dition, some metrics were excluded through the third
criteria, i.e., they are not adopted for BPMN (Sad-
owska, 2015). The retained metrics are listed below:
• Control Flow Complexity (CFC) was defined by
Cardoso et al. (Cardoso et al., 2006) to mea-
sure the complexity introduced by XOR, OR, and
AND split constructs.
CFC(p) =
∑
a∈P∧a∈XOR−Split
CFC
XOR
(a) +
∑
a∈P∧a∈OR−Split
CFC
OR
(a) +
∑
a∈P∧a∈AND−Split
CFC
AND
(a)
(1)
where: CFC
XOR
(a) = n; CFC
OR
(a) = 2
n
− 1;
CFC
AND
(a) = 1; n=number of outgoing arcs.
• Halstead-based Process Complexity (HPC) was
adapted by Cardoso et al. (Cardoso et al., 2006)
to estimate the length N, the volume V , and the
difficulty D of a process as follows:
N = n
1
∗ log
2
(n
1
) + n
2
∗ log
2
(n
2
) (2)
V = (N
1
+ N
2
) ∗ log
2
(n
1
+ n
2
) (3)
D = (
n
1
2
) ∗ (
N
2
n
2
) (4)
where: n
1
is the number of activities, splits and
joins, and control-flow elements of a BP. n
2
is the
number of data variables manipulated by the BP
and its activities. N
1
and N
2
are respectively the
total number of elements and data occurrences.
• Interface Complexity (IC) was adapted from in-
formation flow metric (Henry and Kafura, 1981)
by Cardoso et al. (Cardoso et al., 2006). IC mea-
sures the complexity of a process as follows:
IC = length ∗ (NbO f Inputs ∗ NbO f Out puts)
2
(5)
• Number of Activities (NOA) was defined by Car-
doso et al. (Cardoso et al., 2006) to measure the
number of activities (task and sub-process) of a
business process.
• Number of Activities, Joins and Splits (NOAJS)
was defined by Cardoso et al. (Cardoso et al.,
2006) to measure number of activities, joins and
splits of a business process.
• Coefficient of Network Complexity (CNC) was
defined by Cardoso et al. (Cardoso et al., 2006).
The CNC metric is the ratio of the total number
of arcs in a process model to its total number of
nodes.
• Cross Connectivity (CC) was defined by Van-
derfeesten et al. (Vanderfeesten et al., 2008) to
measure the strength of the arcs between process
model nodes. The cross connectivity metric ex-
presses the sum of the connectivity between all
pairs of nodes in a process model, relative to the
theoretical maximum number of paths between all
nodes.
• Coupling metric (CP) was defined by Vander-
feesten et al. (Vanderfeesten et al., 2007b) to cal-
culate the coupling degree of a process. This cou-
pling degree depends on the complexity of con-
nections between the tasks and the type of these
connections (i.e., AND, OR, XOR).
• Density (D) was defined by Mendling (Mendling,
2006). The density metric is the ratio of the total
number of arcs to the maximum number of arcs.
Following software engineering, these metrics are
used to measure either comprehensibility or modifia-
bility or both of them. Table 1 shows the usability of
these metrics to measure either comprehensibility or
modifiability as defined in the literature.
2.2 Work on Thresholds for Business
Process Evaluation
Despite the importance of BP model to enterprises,
there is a serious lack of an effective approach and
A Fuzzy Logic-based Approach for Assessing the Quality of Business Process Models
63

Table 1: Identified quality metrics for assessing comprehen-
sibility and modifiability.
Quality met-
rics
Comprehensibility Modifiability
CFC ? ?
HPC ?
IC ?
NOA ? ?
NOAJS ? ?
CNC ? ?
CC ?
CP ? ?
D ? ?
?: The metric is used to assess the comprehensibility or the
modifiability.
support systems for BP models quality assessment
(S
´
anchez-Gonz
´
aLez et al., 2013) and (Sadowska,
2015). Our literature review revealed that ISO stan-
dards for quality assessment and quality metrics are
the basis of the different propositions. However, the
common problem addressed by the existing works is
the lack of thresholds for the defined quality metrics
to be used during BP models quality assessment.
Makni et al. in (Makni et al., 2010) proposed a
tool for evaluating the quality of BP models using
existing complexity, coupling, and cohesion quality
metrics. However, the authors did not focus on the
identification of thresholds as the proposed tools en-
sure the evaluation based on thresholds introduced by
the user for the different metrics.
In (S
´
anchez-Gonz
´
alez et al., 2010), the authors
use the Bender method (Bender, 1999) to identify
thresholds for some quality metrics. The method al-
lows quantitative risk assessment in epidemiological
studies based on the logistic regression model. This
method has two major limitations: (i) logistic regres-
sion model requires a binary variable, and (ii) ne-
cessity to arbitrarily define P0 probability, which is
used to calculate the Value of an Acceptable Risk
Level (VARL). The Bender method was also used
in (S
´
anchez-Gonz
´
alez et al., 2011), to define thresh-
old for the CFC metric. In (S
´
anchez-Gonz
´
alez et al.,
2012) the authors conducted an experiment to deter-
mine threshold values for gateway complexity metrics
to be used for the evaluation of the understandabil-
ity and modifiability of BP models. The authors also
propose a Gateway Complexity Indicator (GCI) de-
fined based on the identified threshold values for the
selected gateway complexity measures.
Mendling et al. proposed an approach for predict-
ing errors in BP model (Mendling et al., 2012). The
approach is based on a set of quality metrics used in
the literature for evaluating the quality of BP models.
The author use logistic regression (Bender, 1999) and
ROC curves (Hanley and McNeil, 1982) to determine
thresholds for the used metrics.
In (Sadowska, 2015) Sadowska proposed a meta-
model for assessing the quality of BPMN 2.0 process
models. This meta-model is built upon the ISO/IEC
25010 standard (ISO, 2011). To evaluate the different
quality characteristics, the author used a set of quality
metrics defined in the literature. In addition, they used
a BP repository of 57 BPs modeled with BPMN along
with K-means to classify the possible values of qual-
ity metrics into 4 clusters. Based on the used quality
metrics and the defined clusters the author proposed
a system that supports the evaluation of BP models
quality.
Our literature review revealed the lack of a con-
sensus concerning thresholds values for BP models
quality assessment. This is one of the important ob-
stacles hindering the development of an effective sys-
tem supporting qualitative assessment of BP models.
3 THRESHOLD
DETERMINATION
We detail our approach for determining approximate
thresholds for BP quality metrics in order to evaluate
BP model quality in terms of modifiability and com-
prehensibility.
Our approach is based on data mining techniques;
namely decision tree. Thus, four steps are required:
data collection to build a repository of business pro-
cesses, data preparation to create the learning and test
datasets, data mining to build a decision tree, and val-
idation to assess the performance of the resulted deci-
sion tree.
3.1 Data Collection
We created the “SOA-Based Business Process
Database” by collecting a set of business processes
that belong to different organizations to guarantee
that our approach is generic (e.g., academic institu-
tions, commercial enterprises, healthcare centers, and
banks). Furthermore, from each type of organiza-
tion, we examined different business processes; for
example, from academic institutions, we considered,
among others, student registration, exam preparation,
timetable creation, jury thesis defenses allocation, etc.
All of these business processes are modeled using
BPMN 2.0. The total number of the collected busi-
ness processes is 1000.
After the model collection, we examined the pro-
cesses in conjunction with design instructors from the
ICSOFT 2017 - 12th International Conference on Software Technologies
64

IT department of our university (considered as ex-
perts). The goal is to classify these processes accord-
ing to the level of their comprehensibility and modifi-
ability easiness. To this end, we organized ourselves
into four groups. Each group examined 250 pro-
cesses. Afterward, we conducted a cross-validation
process among the different groups. Finally, we orga-
nized the business processes of the “SOA-Based Busi-
ness Process Database” into three levels of compre-
hensibility (easy to understand, moderately difficult to
understand, and difficult to understand) and three lev-
els of modifiability (easy to modify, moderately diffi-
cult to modify, and difficult to modify).
3.2 Data Preparation
To prepare the data for the next phases, we built two
matrices based on the database “SOA-Based Business
Process Database”. The first is devoted to the com-
prehensibility data, while the second is dedicated to
the modifiability data. Each row in a matrix repre-
sents a BP from the “SOA-Based Business Process
Database” and each column represents a quality met-
ric among the identified quality metrics to measure
comprehensibility and modifiability (cf. section 2.1).
The last column of each matrix represents the level
of comprehensibility (i.e., easy to understand, moder-
ately difficult to understand, or difficult to understand)
or modifiability (easy to modify, moderately difficult
to modify, or difficult to modify).
In our case, we used these matrices to create
two sub-databases from each matrix: one for learn-
ing “training database” and one for testing “test
database”. The “training database” includes 70% of
the “SOA-Based Business Process Database”, and the
“test database” comprises the rest.
3.3 Data Mining: Decision Trees
At this stage, we used decision trees to extract thresh-
olds for quality metrics from the “SOA-Based Busi-
ness Process Database”. A decision tree consists of
a root node and several intermediate and leave nodes.
The transitions from the root node to a leaf node are
based on the values of the criteria, quality metrics in
our case. At each node, the criterion that maximizes
the homogeneity of child nodes is chosen. Homo-
geneity of a node is reached when all the BPs of this
node belong to the same class (e.g., all the BP of a
node are easy to understand, in the case of compre-
hensibility). A homogeneous node is usually a leaf
node as it cannot be divided. A leaf node corresponds
to the class, which is in our case the level of compre-
hensibility or the level of modifiability.
To create the required two decision trees (one for
the comprehensibility and one for the modifiability),
we used WEKA system, which is recognized as a
landmark system in data mining and machine learn-
ing (Hall et al., 2009). WEKA supports several algo-
rithms for the construction of decision trees like for
example J48, ADTree, and REPTree. In this work,
we first used all of the provided algorithms, and then
we have chosen the best one (i.e., the one that have a
lower error rate) based on the validation stage (cf. sub-
section 3.4).
3.4 Validation
The literature proposes several possible ratios for as-
sessing the quality of a prediction model. In our work,
we use: precision (6), recall (7), f-measure (8), and
global error rate (9). In the following, we discuss only
the three best algorithms (based on the values of the
used ratios), namely are J48, ADTree, and REPTree.
Precision =
CorrectEntitiesFound
TotalEntitiesFound
(6)
Recall =
CorrectEntitiesFound
TotalCorrectEntities
(7)
F − measure = 2 ∗
Precision ∗ Recall
Precision + Recall
(8)
GlobalErrorRate = 1 −
CorrectEntitiesFound
TotalEntities
(9)
3.4.1 Training Database based Validation
First, we calculate these ratios after testing the result-
ing decision trees (i.e., comprehensibility and modi-
fiability trees) on the training database. Table 2 and
3 show, respectively, the values of the different ratios
for the three algorithms per decision tree. These ta-
bles depict that J48 algorithm gives the best values of
precision, recall, F-mesure, and global error rates for
both comprehensibility and modifiability.
Table 2 shows that we achieved very acceptable
results with J48, for assessing the BP model compre-
henisibility: the values of precision, recall, and F-
measure are of 97.3% and the global error rate is of
2.7%. Similarly, Table 3 shows that J48 can also be
used for assessing the modifiability of BP model as
the values of precision, recall, and F-measure are of
96.1% while the global error rate is of 3.8%. How-
ever, to prove the effectiveness of the proposed de-
cision trees, we need to use another database, “test
database”.
A Fuzzy Logic-based Approach for Assessing the Quality of Business Process Models
65

Table 2: J48 vs ADTree vs REPTree for decision tree of
comprehensibility.
J48 ADTree REPTree
Precision 0.973 0.961 0.942
Recall 0.973 0.96 0.94
F-Measure 0.973 0.96 0.941
Global error rate 0.027 0.04 0.06
Table 3: J48 vs ADTree vs REPTree for decision tree of
modifiability.
J48 ADTree REPTree
Precision 0.961 0.92 0.925
Recall 0.961 0.92 0.924
F-Measure 0.961 0.92 0.924
Global error rate 0.038 0.08 0.075
3.4.2 Test Database based Validation
To assess the performance of the proposed decision
trees and choose the most suitable algorithm among
those provided by WEKA, we evaluated the obtained
trees using the “test database”, which is extracted
from the “SOA-Based Business Process Database”.
At this stage, we apply each decision tree to all BPs
of the “test database” to assess the comprehensibil-
ity and modifiability levels of each process. This as-
sessment is performed independently of the assess-
ments already done by experts. The goal is to com-
pare the experts’ judgement with the obtained trees
assessments and hence, to identify the error rate of
our decision trees.
Table 4: J48 vs ADTree vs REPTree for decision tree of
comprehensibility.
J48 ADTree REPTree
Precision 0.969 0.971 0.962
Recall 0.967 0.967 0.953
F-Measure 0.967 0.968 0.955
Global error rate 0.033 0.033 0.046
Table 5: J48 vs ADTree vs REPTree for decision tree of
modifiability.
J48 ADTree REPTree
Precision 0.943 0.875 0.92
Recall 0.94 0.87 0.897
F-Measure 0.94 0.869 0.899
Global error rate 0.06 0.13 0.103
Tables 4 and 5 list the values of the four used ratios
for evaluating the performance of the proposed com-
prehensibility and modifiability decision trees. These
tables show that we achieved very acceptable results
using the “test database” using J48. Indeed, the values
of precision are: 96.9% for the comprehensibility tree
and 94.3% for the modifiability tree. The values of
recall and f-measure are 96.7% for the comprehensi-
bility tree, and 94% for the modifiability tree. Finally,
the global error rate is of 3.3% for the comprehensi-
bility tree and 6% for the modifiability tree.
3.5 Discussion
Decision tree is used to classify the BP of the “SOA-
Based Business Process Database” according to their
level of comprehensibility (first decision tree) and
modifiability (second decision tree) based on the val-
ues of the used quality metrics. Based on these de-
cision trees, we defined a set of decision rules along
with the thresholds of the different quality metrics for
evaluating both comprehensibility and modifiability
of a BP model. Tables 6 and 7, respectively, depict
an extract of the defined decision rules for compre-
hensibility and modifiability.
Table 6: Excerpt of decision rules to assess the level of com-
prehensibility.
Decision rules
R1 If IC <= 12 Then Easy to understand
R2 If IC <= 17 and IC > 12 and CNC <=
1.26 Then Easy to understand
R3 If IC <= 17 and IC > 12 and CNC >
1.26 and CFC <= 3 Then Moderately
difficult to understand
Table 7: Excerpt of decision rules to assess the level of mod-
ifiability.
Decision rules
R1 If CFC <= 9 and HPC V <= 53 and
NOA <= 6 Then Easy to modify
R2 If HPC V <= 53 and NOA > 6 and
CFC <= 3 and NOA <= 12 and
CP <= 0.077 Then Easy to modify
R3 If NOA <= 26 and CFC > 3 and
NOA > 12 and HPC V <= 14 Then
Moderately difficult to modify
Table 8 shows the identified thresholds for each
quality metric. However, the identified thresholds re-
main usually approximate and imprecise due to the
fact that they depend on the expert judgments during
the first phase, “data collection” (cf. subsection 3.1).
In the next section, we detail the use of fuzzy logic to
manage these approximate and imprecise thresholds.
ICSOFT 2017 - 12th International Conference on Software Technologies
66

Table 8: Obtained thresholds values of quality metrics.
Quality
met-
rics
Comprehensibility Modifiability
IC IC < 12
12 <= IC < 17
17 < IC <= 59
IC > 59
-
CNC CNC <= 1.26
1.26 < CNC <=
1.65
CNC > 1.65
CNC <= 1.30
1.30 < CNC <=
1.54
1.54 < CNC <=
1.61
1.61 < CNC <=
1.85
CNC > 1.85
CFC CFC <= 3
3 < CFC <= 9
9 < CFC <= 18
CFC > 18
CFC <= 3
3 < CFC <= 9
CFC > 9
NOAJS NOAJS <= 39
39 < NOAJS <=
55
NOAJS > 55
NOAJS <= 7
7 < NOAJS <= 17
17 < NOAJS <=
33
33 < NOAJS <=
55
NOAJS > 55
D D <= 0.043
D > 0.043
D <= 0.043
D > 0.043
NOA NOA <= 14
14 < NOA <= 26
NOA > 26
NOA <= 6
6 < NOA <= 12
12 < NOA <= 26
26 < NOA <= 44
NOA > 44
CP CP <= 0.031
CP > 0.031
CP <= 0.032
0.032 < CP <=
0.077
0.077 < CP <=
0.09
CP > 0.09
HPC V - HPC V <= 14
14 < HPC V <=
53
HPC V > 53
HPC D - HPC D <= 5.25
HPC D > 5.25
4 FUZZY LOGIC FOR BUSINESS
PROCESS QUALITY
ASSESSMENT
According to his founder, fuzzy logic is a precise
logic that supports imprecision and approximate rea-
soning (Zadeh, 2008). In this paper, we use fuzzy
logic to manage the approximate and imprecise na-
ture of the identified thresholds for the different qual-
ity metrics. Indeed, the use of fuzzy logic adjusts a
bit the identified thresholds to be more general. This
happens through the first step called fuzzification. At
this step, the thresholds, which are crisp values, are
transformed into linguistic values (e.g., low, medium,
high) known as fuzzy sets. The second step is the in-
ference, which is based on a set of fuzzy rules. In
our case, we deduce these fuzzy rules from the rules
obtained in Section 3.5. Finally, the last step is the
defuzzification, which produces a quantifiable (crisp
value) result. In the remainder of this section, we de-
tail the use of fuzzy logic to assess the quality of BP
models
4.1 Fuzzification
Fuzzification converts crisp values of input variables
(i.e., quality metrics) into fuzzy sets (i.e., linguistic
values). This conversion is ensured thanks to a set
of membership functions that we defined based on
the identified approximate thresholds (cf. section 3.5).
We defined one membership function for each possi-
ble fuzzy set per quality metric (cf. section 3.5).
In the first part of Fig.1 (i.e., without fuzzifica-
tion), a and b values represent the approximate thresh-
olds determined through the use of decision trees and
fuzzy sets associated with the different intervals fixed
by experts (i.e., low, moderate, and high). In this fig-
ure, each value of a quality metric can belong only to
a single fuzzy set with a membership degree equals to
1. This case is true when the fixed thresholds are ex-
act and precise. However, because it is not the case of
the thresholds defined in this paper, we use the mem-
bership function depicted in the second part of Fig.1
(i.e., with fuzzification). The values of a’, a”, b’,
and b” are defined by experts for each quality met-
ric. Each value within the intervals [ a’, a” ] and
[ b’, b” ] belong to two fuzzy sets with different
membership degrees. For example, the value “x” be-
longs to the two fuzzy sets “low” and “moderate” with
membership degree of “x1” and “x2” respectively.
4.2 Inference
Inference is the second step in the decision making
process using fuzzy logic. It is based on a set of fuzzy
rules defined in a natural language. Fuzzy logic im-
poses that fuzzy rules are written according to a spe-
cific syntax “if X is A and/or Y is B then Z is C”,
where X and Y are input variables, Z is output vari-
able, and A, B, C are their corresponding linguistic
A Fuzzy Logic-based Approach for Assessing the Quality of Business Process Models
67
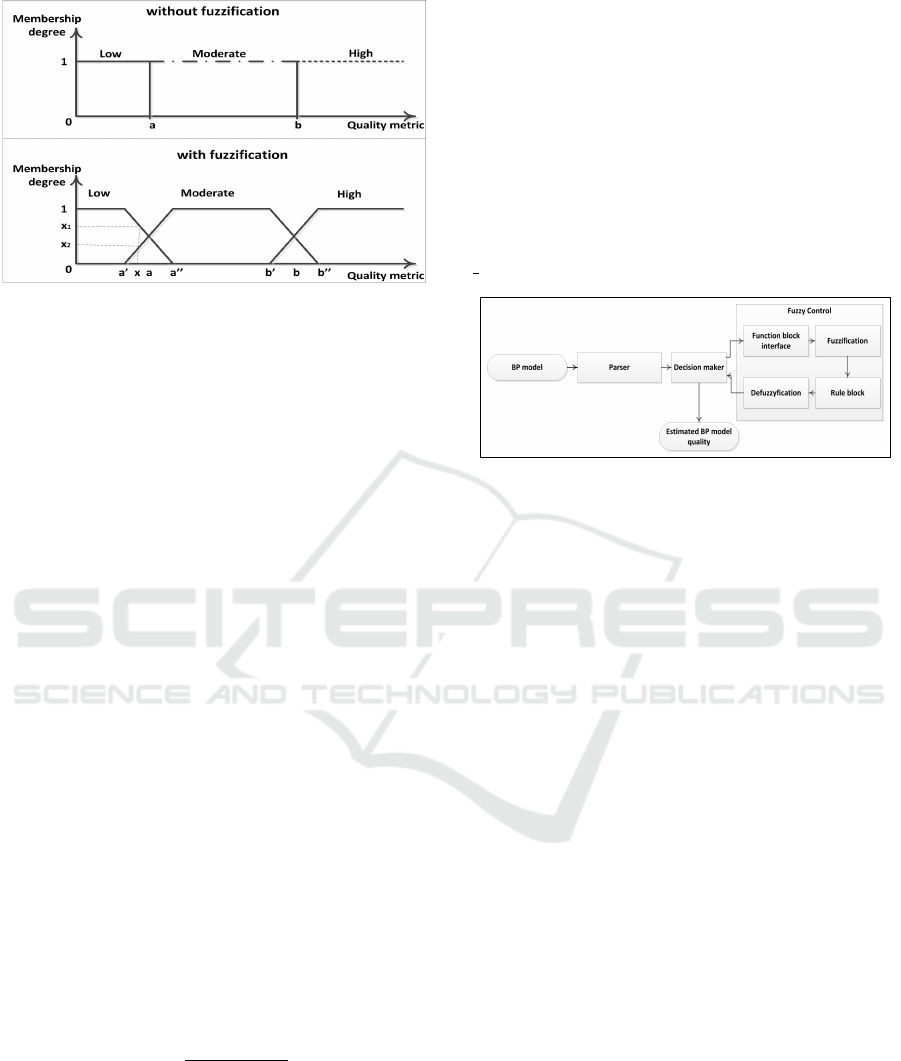
Figure 1: Membership function definition.
values. These rules are essential to any system built
upon fuzzy logic as they are used to determine the val-
ues of the output variables based on the input values.
In our work, we defined rules to determine the
level of comprehensibility and modifiability of a BP
model based on the set of quality metrics. We used the
set of rules obtained from the decision tree (cf. sec-
tion 3.5): We replaced the crisp values with their cor-
responding linguistic values and rewrote the rules ac-
cording to the syntax required by fuzzy logic. The
total number of defined fuzzy rules is of 210 rules
for the comprehensibility and 260 for the modifiabil-
ity. Tables 9 and 10, respectively, depict an extract of
the defined fuzzy decision rules for comprehensibility
and modifiability.
4.3 Defuzzification
Defuzzification is the process which converts the
fuzzy value of the output variable, obtained by the in-
ference engine, into a crisp value. To do so, it aggre-
gates the fuzzy outputs for all the activated rules to a
one fuzzy set, which will be transformed into a crisp
value.
In the literature, there are several defuzzification
techniques like: center of gravity, center average, and
maximum. We used the well-used defuzzification
method: the center of gravity. The crisp value of the
output variable is calculated using the following for-
mula:
y* =
R
U
y ∗ µ(y) dy
R
U
µ(y)dy
(10)
where µ is the universe of discourse that considers all
the output values according to the activated rules.
Defuzzification determines the level of compre-
hensibility or modifiability of a BP model as well as
the degree of certainty of this level. For example, a BP
model can be estimated as easy to understand with a
certainty degree of 70%.
5 SYSTEM DEVELOPMENT:
BP-FUZZQUAL
We developed a system; BP-FuzzQual, which sup-
ports our fuzzy-based approach for assessing the qual-
ity of BP models. It is developed in Java with
Jdom and JFuzzyLogic libraries and under the Eclipse
framework. The functional architecture of this system
is shown in Fig.2. A complete video demonstrating
the different steps of the BP quality assessment using
our system is available at: https://youtu.be/qaCDjd–
54.
Figure 2: Functional architecture of BP-FuzzQual.
The following are the list of modules within BP-
FuzzQual:
• Parser module: takes as input a BP model mod-
eled in BPMN 2.0 and determines the crisp values
of each used quality metric.
• Fuzzy Control module is implemented in Fuzzy
Control Language (FCL) which follows the
IEC1131 standard, the first international standard
for process control software. FCL includes four
components: function block interface, fuzzifica-
tion, rule block, and defuzzification. FCL also
allows defining a fifth optional component called
optional parameters. The use of the four required
components is detailed in the following:
– Function block interface defines the set of in-
put and output parameters as well as local vari-
ables, if required.
– Fuzzification component defines a set of mem-
bership functions for each quality metric.
Based on these membership functions, it con-
verts the crisp values of the quality metric into
linguistic values that will be used by the infer-
ence engine.
– Rule block includes the set of linguistic rules
that are used to estimate the quality of the BP
model. These rules are defined following the
syntax imposed by fuzzy logic.
– Defuzzification component converts the lin-
guistic value of the output variable “compre-
hensibility and modifiability levels” into crisp
values. This conversation is based on a defined
ICSOFT 2017 - 12th International Conference on Software Technologies
68

Table 9: Excerpt of decision rules to assess the level of comprehensibility.
Fuzzy decision rules
FR1 IF IC IS Low THEN ComprehensibilityLevel IS ComprehensibilityLevel IS EasyToUnderstand
FR2 IF IC IS Moderate AND CNC IS Low THEN ComprehensibilityLevel IS EasyToUnderstand
FR3 IF IC IS Moderate AND CNC IS Moderate AND CFC IS Low THEN ComprehensibilityLevel IS Moder-
atelyDifficultToUnderstand
Table 10: Excerpt of decision rules to assess the level of modifiability.
Fuzzy decision rules
FR1 IF CFC IS Moderate AND HPC V IS Moderate AND NOA IS VeryLow THEN ModifiabilityLevel IS
EasyToModify
FR2 IF HPC V IS Moderate AND NOA IS VeryLow AND CFC IS Low AND CP IS Moderate THEN Modifia-
bilityLevel IS EasyToModify
FR3 IF HPC V IS High AND CFC IS Low AND NOA IS Low AND CP IS Moderate THEN ModifiabilityLevel
IS ModeratelyDifficultToModify
technique (e.g., center of gravity, center aver-
age, and maximum). As per section 4.3 the
proposed system uses the center of gravity tech-
nique.
• Decision maker module runs the FCL code in or-
der to estimate the quality of the BP model. This
module takes as input the crisp values produced
by the parser module and communicates these val-
ues to the fuzzy control module. The decision
maker module is developed using java language.
6 EXPERIMENTS
For validating the approach and the system, we
carried out two types of experiments. The first was
done using our system, BP-FuzzQual, and the second
involved anonymous students from our college. In
both experiments the business process model of
Fig. 3 was used. In this model, we use abstract labels
in tasks and pools in order to bypass the complexity
that could be caused by the business domain.
Experiment 1: consists of modeling a BP using
BPMN2 modeler, for example. Then if the BP engi-
neer selects “Quality assessment” menu and then “As-
sess BP model comprehensibility”, the system dis-
plays the crisp and fuzzy values of the different qual-
ity metrics used for assessing comprehensibility. It
also displays the estimated level of comprehensibility.
For instance, the estimated comprehensibility level of
the BP model of Fig. 3 is “Moderately difficult to
understand with a certainty degree of 63%”. Fig. 4
shows the interface for comprehensibility assessment.
In addition, if the BP engineer selects “Quality
assessment” menu and then “Assess BP model
modifiability”, the system displays the crisp and
fuzzy values of the different quality metrics used for
Figure 3: Example of BP model modeled with BPMN.
assessing modifiability. It also displays the estimated
level of modifiability. For instance, the estimated
modifiability level of the BP model of Fig. 3 is “Mod-
erately difficult to modify with a certainty degree
of 100%”. Fig. 5 shows the interface dedicated for
modifiability assessment.
Experiment 2: uses the BP model of Fig. 3 and
two sets of exercises (available at: https://sites.
google.com/site/bposcteam2015/ressources). In the
first exercise, 60 undergraduate students from our
College were asked some multi-choice questions to
assess their understanding of the BP model. In the
second exercise, the same students were invited to
make some changes in the BP model. Fig. 6 rep-
resents the number of correct and incorrect answers
for the first exercise. In this figure, 78% of the re-
sponses are correct showing that the majority of stu-
dents understood the BP model. This is also con-
firmed through their responses to the last question of
the first exercise, which is about their ability to un-
derstand the BP model. Indeed, as depicted in Fig. 7
76% of students considered the BP model as moder-
ately difficult to understand, 14% as easy to under-
A Fuzzy Logic-based Approach for Assessing the Quality of Business Process Models
69
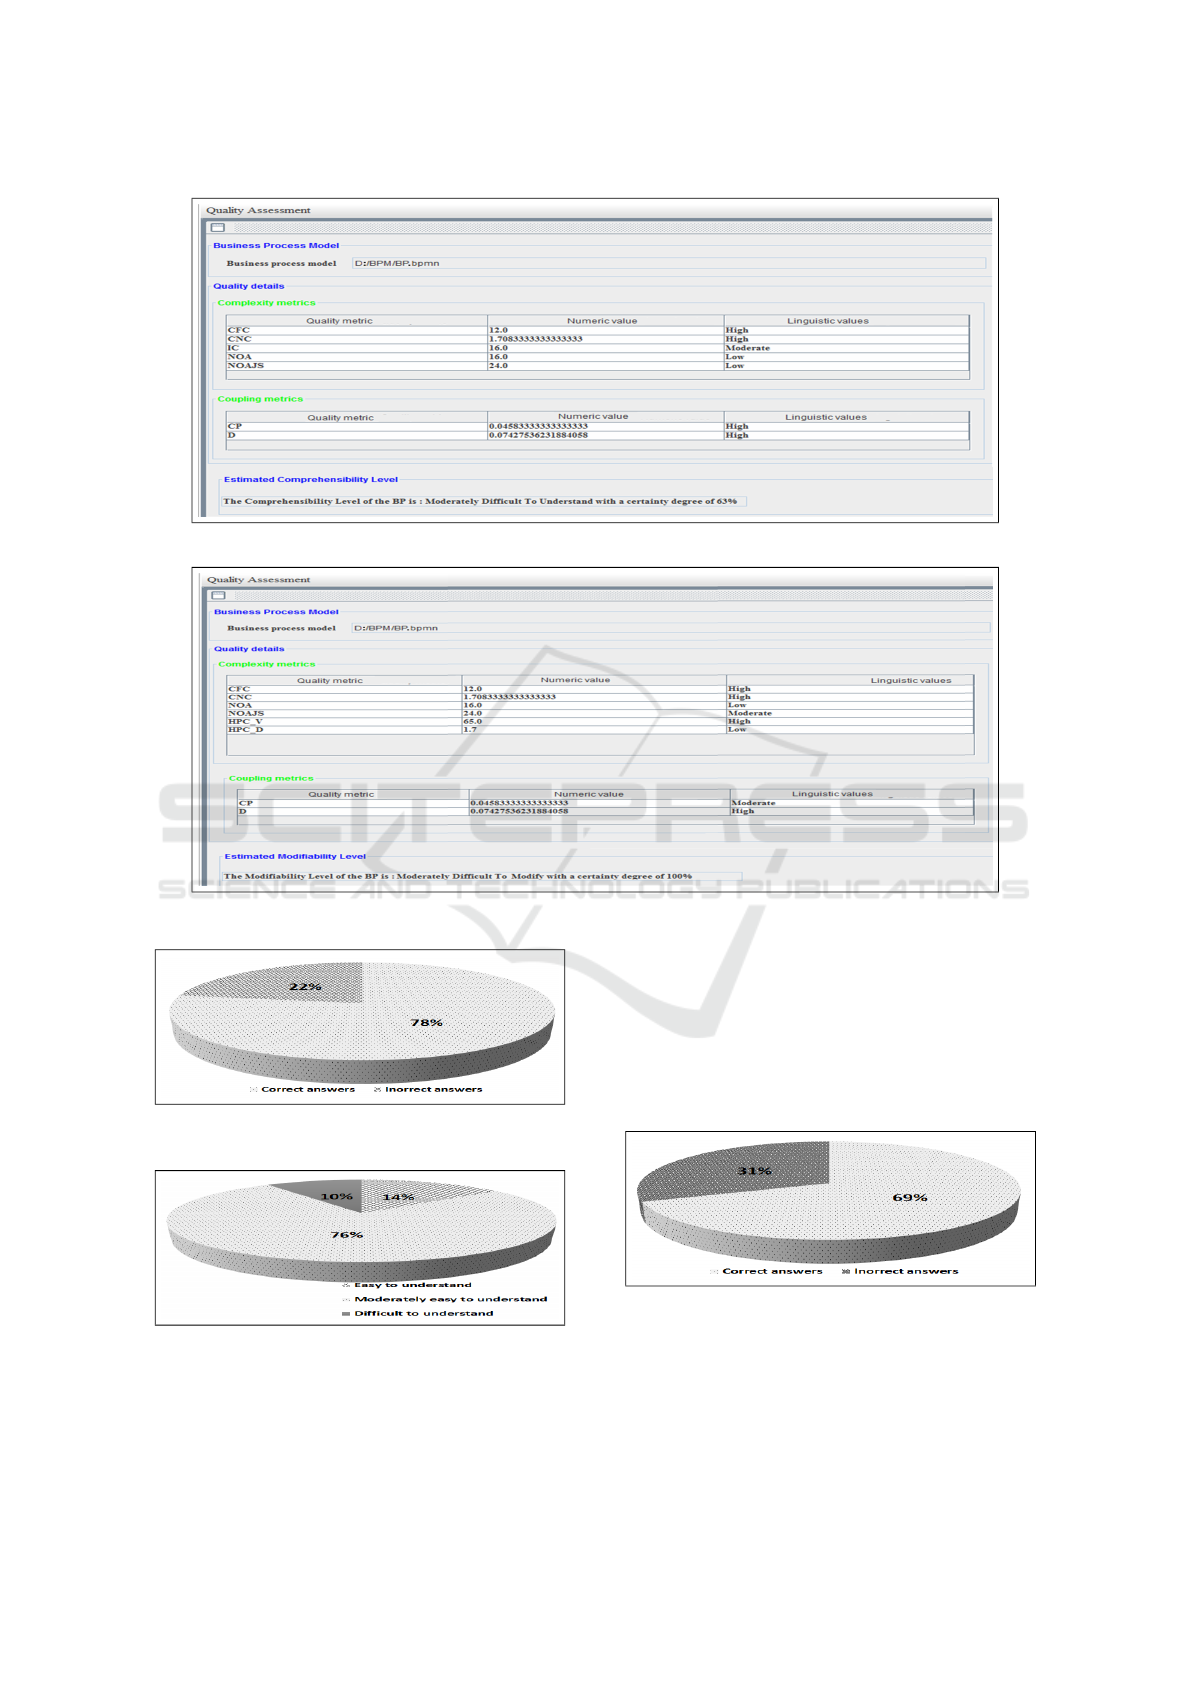
Figure 4: Comprehensibility assessment interface.
Figure 5: Modifiability assessment interface.
Figure 6: Correct and incorrect answers for comprehensi-
bility assessment.
Figure 7: Students’ judgments about the BP model compre-
hensibility level.
stand, and 10% as difficult to understand.
Fig. 8 represents the number of correct and incor-
rect answers for the second exercise. In this figure,
69% of the responses are correct showing that a good
number of students have correctly modified the BP
model. In addition, as depicted in Fig. 9 53% of stu-
dents considered the BP model as moderately difficult
to modify, 33% as difficult to modify, and 14% as easy
to modify.
Figure 8: Correct and incorrect answers for modifiability
assessment.
To sum up, the experiment shows that the students
considered the BP model as moderately difficult to
understand; this is proved by their responses to the
comprehensibility questions. This is in line with the
ICSOFT 2017 - 12th International Conference on Software Technologies
70

Figure 9: Students judgment about the BP model modifia-
bility level.
evaluation done by FuzzQual, which considers the BP
model as moderately difficult to understand. Simi-
larly, when dealing with modifiability, the students
consider the BP model as around moderately diffi-
cult to modify and difficult to modify while FuzzQual
considers that the BP model is moderately difficult
to modify. Overall, these comforming results show
that our approach produces encouraging results that
should be proved through additional experiments.
7 CONCLUSION
BP modeling is important for enterprises that wish
to remain competitive. However, this task, which is
usual manual, can result into a BP model of a poor
quality. Such a model could affect the remainder BP
lifecycle phases (Weske, 2010). To overcome this
challenge, Mendling et al. proposed seven guide-
lines that can assist BP engineers develop a BP model
of a high quality (Mendling et al., 2010). Other re-
search initiatives focus on the use of quality metrics
used in the field of software engineering to assess the
quality of BP models (Vanderfeesten et al., 2007b),
(Mendling et al., 2012), and (de Oca et al., 2015).
However, to date, there is no consistent framework
for assessing BP models quality. The lack of such
a framework is due to different challenges like the
lack consensus about the used metrics, their thresh-
olds, etc.
To tackle these challenges, we proposed, in this
paper, a fuzzy-based approach for assessing the qual-
ity of BP models modeled in BPMN 2.0 in terms of
comprehensibility and modifiability. The proposed
approach is based on the ISO/IEC 25010 standard as
along with a set of quality metrics used in the liter-
ature to assess BP models quality. It consists of two
essential phases: threshold determination and fuzzy
logic application. The first phase applies data mining
techniques, specifically decision tree, to determine
approximate thresholds for each used quality metric
to assess the quality of BP models, modeled using
BPMN language, in terms of comprehensibility or
modifiability. This phase used the “SOA-based Busi-
ness Process Database”, which is built within our lab-
oratory. The second phase of the proposed approach
uses the approximate thresholds identified in the first
phase along with fuzzy logic (Zadeh, 1965) to assess
the quality of BP models. The use of fuzzy logic
aims at dealing with the approximate and imprecise
nature of the obtained thresholds. To automate BP
models quality assessment we developed FuzzQual,
which is a system supporting the proposed approach.
This system is developed in Java language and un-
der eclipse framework. To prove the performance of
the proposed system, we conduct two types of exper-
iments. The former is done through the proposed sys-
tem while the second is accomplished in conjunction
with students from our college. These preliminary ex-
perimental evaluations of the proposed system show
encouraging results.
As a future endeavor, we plan to validate the
proposed fuzzy approach for BP quality assessment
through some real case studies and in conjunction
with enterprises’ experts. In addition, we plan to as-
sess the quality of BP models in terms of other quality
characteristics among those presented in the ISO/IEC
25010 quality model. We, also, intent to put in place
an approach and its support system that could help
enterprises improve the quality of their BPs.
REFERENCES
Bender, R. (1999). Quantitative risk assessment in epidemi-
ological studies investigating threshold effects. Bio-
metrical Journal, 41(3):305–319.
Cardoso, J., Mendling, J., Neumann, G., and Reijers, H. A.
(2006). A discourse on complexity of process mod-
els. In International Conference on Business Process
Management, pages 117–128. Springer.
Cardoso, J., Vanderfeesten, I., and Reijers, H. A. (2010).
Computing coupling for business process mod-
els. available from Internet¡ http://eden. dei.
uc. pt/˜ jcardoso/Research/Papers/Old% 20pa-
per% 20format/Caise-19th-Coupling-Cardoso-
Vanderfeesten. pdf¿(20 September 2012).
Curtis, B., Kellner, M. I., and Over, J. (1992). Process mod-
eling. Communications of the ACM, 35(9):75–90.
de Oca, I. M.-M., Snoeck, M., Reijers, H. A., and
Rodr
´
ıguez-Morffi, A. (2015). A systematic literature
review of studies on business process modeling qual-
ity. Information and Software Technology, 58:187–
205.
Guceglioglu, A. S. and Demirors, O. (2005). Using soft-
ware quality characteristics to measure business pro-
cess quality. In International Conference on Business
Process Management, pages 374–379. Springer.
Hall, M., Frank, E., Holmes, G., Pfahringer, B., Reutemann,
P., and Witten, I. H. (2009). The weka data min-
A Fuzzy Logic-based Approach for Assessing the Quality of Business Process Models
71

ing software: an update. ACM SIGKDD explorations
newsletter, 11(1):10–18.
Hanley, J. A. and McNeil, B. J. (1982). The meaning and
use of the area under a receiver operating characteris-
tic (roc) curve. Radiology, 143(1):29–36.
Heinrich, R. (2013). Aligning Business Process Quality and
Information System Quality. PhD thesis.
Henry, S. and Kafura, D. (1981). Software structure met-
rics based on information flow. IEEE transactions on
Software Engineering, (5):510–518.
ISO (2011). Iso/iec 25010:2011 - systems and software en-
gineering – systems and software quality requirements
and evaluation (square) – system and software qual-
ity models. https://www.iso.org/standard/35733.html.
(Accessed on 12/08/2016).
ISO (2013). Iso/iec 19510:2013 - information technology
– object management group business process model
and notation. http://www.iso.org/iso/catalogue detail.
htm?csnumber=62652. (Accessed on 10/17/2016).
Makni, L., Khlif, W., Haddar, N. Z., and Ben-Abdallah, H.
(2010). A tool for evaluationg the quality of business
process models. In ISSS/BPSC, pages 230–242. Cite-
seer.
Mendling, J. (2006). Testing density as a complexity met-
ric for epcs. In German EPC workshop on density of
process models.
Mendling, J., Reijers, H. A., and van der Aalst, W. M.
(2010). Seven process modeling guidelines (7pmg).
Information and Software Technology, 52(2):127–
136.
Mendling, J., S
´
anchez-Gonz
´
alez, L., Garcia, F., and
La Rosa, M. (2012). Thresholds for error probabil-
ity measures of business process models. Journal of
Systems and Software, 85(5):1188–1197.
Morimoto, S. (2008). A survey of formal verification for
business process modeling. In International Con-
ference on Computational Science, pages 514–522.
Springer.
Muketha, G., Ghani, A., Selamat, M., and Atan, R. (2010).
A survey of business process complexity metrics. In-
formation Technology Journal, 9(7):1336–1344.
Reijers, H. A. and Vanderfeesten, I. T. (2004). Cohesion
and coupling metrics for workflow process design. In
International Conference on Business Process Man-
agement, pages 290–305. Springer.
Sadowska, M. (2015). An approach to assessing the qual-
ity of business process models expressed in bpmn. e-
Informatica Software Engineering Journal, 9(1).
S
´
anchez-Gonz
´
alez, L., Garc
´
ıa, F., Mendling, J., and Ruiz, F.
(2010). Quality assessment of business process mod-
els based on thresholds. In OTM Confederated Inter-
national Conferences” On the Move to Meaningful In-
ternet Systems”, pages 78–95. Springer.
S
´
anchez-Gonz
´
alez, L., Garc
´
ıa, F., Ruiz, F., and Mendling, J.
(2012). Quality indicators for business process models
from a gateway complexity perspective. Information
and Software Technology, 54(11):1159–1174.
S
´
anchez-Gonz
´
aLez, L., Garc
´
ıA, F., Ruiz, F., and Piattini,
M. (2013). Toward a quality framework for business
process models. International Journal of Cooperative
Information Systems, 22(01):1350003.
S
´
anchez-Gonz
´
alez, L., Ruiz, F., Garc
´
ıa, F., and Cardoso, J.
(2011). Towards thresholds of control flow complex-
ity measures for bpmn models. In Proceedings of the
2011 ACM symposium on Applied computing, pages
1445–1450. ACM.
Schmidt, R. and Nurcan, S. (2009). Augmenting bpm with
social software. In International Conference on Busi-
ness Process Management, pages 201–206. Springer.
Van Der Aalst, W. M., Ter Hofstede, A. H., and Weske, M.
(2003). Business process management: A survey. In
International conference on business process manage-
ment, pages 1–12. Springer.
Vanderfeesten, I., Cardoso, J., Mendling, J., Reijers, H. A.,
and van der Aalst, W. M. (2007a). Quality metrics for
business process models. BPM and Workflow hand-
book, 144:179–190.
Vanderfeesten, I., Reijers, H. A., Mendling, J., van der
Aalst, W. M., and Cardoso, J. (2008). On a quest for
good process models: the cross-connectivity metric.
In International Conference on Advanced Information
Systems Engineering, pages 480–494. Springer.
Vanderfeesten, I. T., Cardoso, J., and Reijers, H. A. (2007b).
A weighted coupling metric for business process mod-
els. In CAiSE Forum, volume 247.
Watahiki, K., Ishikawa, F., and Hiraishi, K. (2011). Formal
verification of business processes with temporal and
resource constraints. In Systems, Man, and Cybernet-
ics (SMC), 2011 IEEE International Conference on,
pages 1173–1180. IEEE.
Weske, M. (2010). Business process management: con-
cepts, languages, architectures. Springer Publishing
Company, Incorporated.
Zadeh, L. A. (1965). Fuzzy sets. Information and control,
8(3):338–353.
Zadeh, L. A. (2008). Is there a need for fuzzy logic? Infor-
mation sciences, 178(13):2751–2779.
ICSOFT 2017 - 12th International Conference on Software Technologies
72
