
Modeling and Qualitative Evaluation of a Management Canvas
for Big Data Applications
Michael Kaufmann
1
, Tobias Eljasik-Swoboda
2
, Christian Nawroth
2
, Kevin Berwind
2
,
Marco Bornschlegl
2
and Matthias Hemmje
2
1
Lucerne School of Information Technology, Rotkreuz, Switzerland
2
Faculty of Mathematics and Computer Science, University of Hagen, Germany
Keywords: Data Management, Big Data, Reference Model, Project Management, Case Study, Pilot Application.
Abstract: A reference model for big data management is proposed, together with a methodology for business
enterprises to bootstrap big data projects. Similar to the business model canvas for marketing management,
the big data management (BDM) canvas is a template for developing new (or mapping existing) big data
applications, strategies and projects. It subdivides this task into meaningful fields of action. The BDM
canvas provides a visual chart that can be used in workshops iteratively to develop strategies for generating
value from data. It can also be used for project planning and project progress reporting. The canvas
instantiates a big data reference meta-model, the BDM cube, which provides its meta-structure. In addition
to developing and theorizing the proposed data management model, two case studies on pilot applications in
companies in Switzerland and Austria provide a qualitative evaluation of our approach. Using the insights
from expert feedback, we provide an outlook for further research.
1 INTRODUCTION
The digital age has fostered the data explosion in
which the global information capacity doubles every
3 years (Hilbert and López, 2011). With this speed
of growth, a data intelligence gap is created: The big
data available to an organization is growing
exponentially, while the percentage of the data that
an organization can process and actually use
declines as rapidly (Zikopoulos and Eaton, 2011).
Ultimately, this percentage could become
infinitesimally small.
It is said that big data is the oil of the 21
st
century
and, thus, those individuals, companies, and even
nations who possess the skills to turn raw data into
something valuable will have major competitive
advantages. Therefore, there is pressure for
enterprises to adapt and implement a big data
management (BDM) strategy, even for companies
that are not experienced in this field. However, often
the question is not how to implement scalable
architectures, but how to get started with big data
management in the first place – especially in non-
technical companies. Therefore, our research
question guiding the investigation presented in this
paper is the following: How can the development of
new big data applications (BDA) be facilitated for
non-technical decision makers? (RQ1)
Bootstrapping new big data projects from scratch
is a formidable task. Reference models can help to
analyze and subdivide this process to reduce its
complexity and to provide a frame of reference and
guidance. To provide a possible answer to the
research question, the authors propose a new
framework for the management of big data projects
entitled “Big Data Management Canvas”. The
proposed framework extends the existing NIST Big
Data Interoperability Framework to make it more
actionable by providing a frame of reference for
extracting value from big data, called “data
effectuation”. This is accomplished by a knowledge-
based embedding of big data management in a frame
called “data intelligence” and by aligning technical
aspects of big data with business aspects.
The working hypothesis is that this model
accurately modularizes BDM and that it is useful
and valuable for companies for developing new big
data strategies. Our research methodology follows
design-oriented information systems research
Kaufmann, M., Eljasik-Swoboda, T., Nawroth, C., Berwind, K., Bornschlegl, M. and Hemmje, M.
Modeling and Qualitative Evaluation of a Management Canvas for Big Data Applications.
DOI: 10.5220/0006397101490156
In Proceedings of the 6th International Conference on Data Science, Technology and Applications (DATA 2017), pages 149-156
ISBN: 978-989-758-255-4
Copyright © 2017 by SCITEPRESS – Science and Technology Publications, Lda. All rights reserved
149

(Österle et al., 2010). In this paper, we present a
completed research cycle of problem analysis,
artifact design, evaluation, and diffusion. We present
our findings of evaluating our hypothesis
empirically and qualitatively in the context of two
pilot applications with large companies in
Switzerland and Austria.
2 STATE OF THE ART
2.1 Big Data Reference Models
Three new dimensions of data management became
apparent in the beginning of the 21
st
century:
“Volume, Velocity and Variety” (Laney, 2001). For
this, Gartner later coined the term “big data”
(Gartner, 2012). Since then, there have been
countless alternative definitions of the concept. In
2015, the definition of big data was standardized by
the NIST Big Data Public Working Group: “Big
Data consists of extensive datasets primarily in the
characteristics of volume, variety, velocity, and/or
variability that require a scalable architecture for
efficient storage, manipulation, and analysis”
(Chang, 2015a, p. 5). The NIST has analyzed the
existing state of the art in big data architectures and
models (Chang, 2015b). This analysis refers to big
data reference models from several organizations,
including ET Strategies, Microsoft, University of
Amsterdam, IBM, Oracle, EMC/Pivotal, SAP,
9Sight Consulting, and Lexis Nexis. Based on this
analysis, the NIST defined the NIST Big Data
Interoperability Framework (Chang, 2015c), a
standardized reference model for big data
applications (BDA). This reference model provides
five layers of activities for big data management. By
following these activities, value is generated from
data. These activities are listed in ascending value in
the information value chain: (1) data collection, (2)
data preparation, (3) data analytics, (4) data
visualization, and (5) access for data consumers.
2.2 Project Management
The reference model discussed in the previous
section is very descriptive, but not actionable
enough to be directly applied. To provide actionable
reference models, these can be linked to business
and project management methods. For example, the
business model canvas (BMC) (Osterwalder and
Pigneur, 2010) is a method to generate, and optimize
business models by dividing them into nine central
areas of interest. These areas are customer segments,
customer relationships, channels, value proposition,
revenue streams, key activities, key resources, key
partners, and cost structure. These fields interact
with each other, having the strongest influence on
directly adjacent areas. Osterwalder and Pigneur
provide example questions for every area of interest
within the BMC. Examples include “for what type of
market (e.g., mass market, niche market, segmented
market, diversified market, business customers,
private customers…) do we create value?”, “What
service are our customers ready to pay for?” etc.
Scrum (Schwaber, 2004) is an agile project
management method intended for software
development that accommodates shifting
requirements. One of Scrum’s core concepts is the
user story that encapsulates the properties of a
software product in sentences following the
following pattern: “As a <end user role>, I want
<the desire> so that <the rationale>”. The desire
coded into a user story describes a specific business
value.
In our approach, we have linked our reference
model with these two management methods to
enhance its actionability.
2.3 Big Data Management
In the past, data management (Mosley, 2008), has
been understood as an administrative information
technology (IT) task. However, in the age of
digitalization, big data management—as we
understand it—concerns a completely different level
of organization. To create value from big data, both
IT and business aspects need to be considered.
Therefore, it is important to shift data management
conceptually and culturally from mere
administration and governance within the IT
department to the overall valuation and effectuation
of big data on the executive level in accordance with
business goals.
With a v for value, the 5v model of big data by
Demchenko et al., (2013), in contrast to many other
definitions, poses a value question for big data
theory. Managing big data is not an end for itself; it
is more than an update of what was called “data
management,” with more volume, velocity, and
variety. Successful big data management creates
value in the real world, based on the ubiquitous,
omnipresent and ever-growing ocean of data in the
digital universe. A reference model for big data
management should facilitate the generation of value
from available data. Therefore, data is processed to
generate intelligence that supports data-driven
decision-making (Provost and Fawcett, 2013).
DATA 2017 - 6th International Conference on Data Science, Technology and Applications
150
However, the other direction is at least as important:
The application of intelligence to generate new big
data applications.
The term management is defined in the Oxford
dictionary as “the process of dealing with or
controlling things or people”. Based on that, in
combination with the 5v model of big data, we
define BDM as the process of controlling flows of
large-volume, high-velocity, heterogeneous, and/or
uncertain data to create value.
2.4 Contribution
The aim of the model proposed in this paper is to
provide an actionable frame of reference for creating
value from big data. The existing NIST reference
model discussed in Section 2.1 lacks three important
aspects presented in Sections 2.2 and 2.3. First, a big
data management reference model needs to be linked
to management methods to make it actionable
(Argyris, 1996) and to enable the operationalization
of big data in practice. Second, it should specifically
set the generation of value (Davenport, 2013) as the
primary goal of big data applications. This does not
necessarily mean monetary value; however, any big
data application should provide value to anyone or
else they become ends in themselves. Third, it
should address the bi-directional process of
intelligence (Floridi, 2012) as an important aspect of
data application: the knowledge and skills needed
for big data operationalization, as well as the
knowledge and skills generated by it.
3 A REFERENCE MODEL FOR
BIG DATA MANAGEMENT
The model proposed in this section analyzes BDM,
the process of creating value from big data, into
smaller fields of action to handle its complexity.
Using a constructivist epistemological approach to
business intelligence as a cognitive system,
(Kaufmann, 2016) identified, as a hypothesis, six
general aspects (or layers) of BDM, namely
datafication, data integration, data analytics, data
interaction, and data effectuation, as well as the
successful management and engineering of the
emergent knowledge in this process, which can be
called data intelligence. To create value, iterative
cycles from datafication to effectuation are
performed with a closed feedback loop and
intelligent human control.
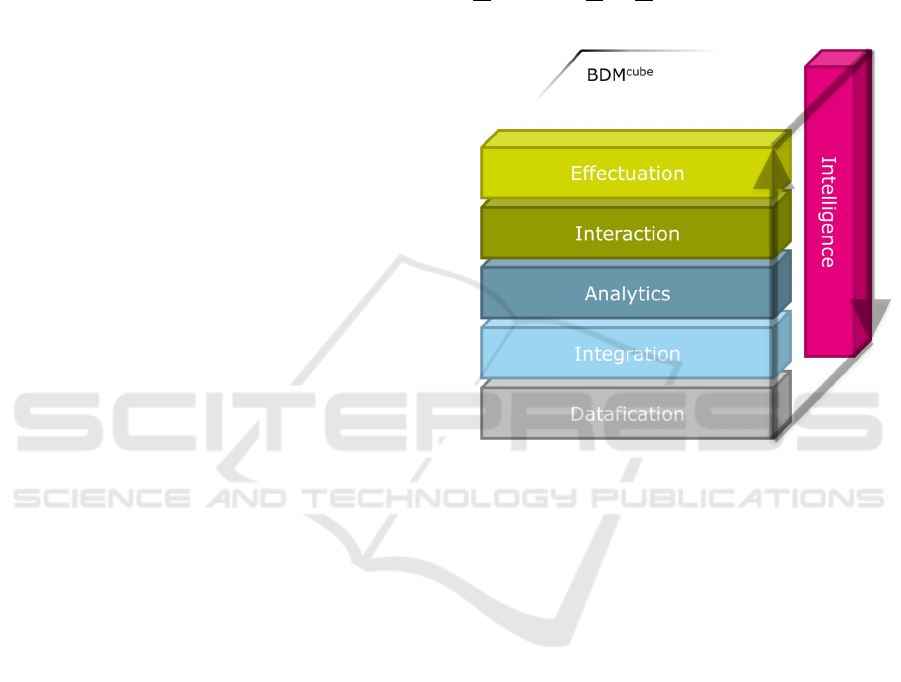
This division of BDM into six layers, as shown
in Figure 1, is a meta-model, where more specific
BDM models represent instances implementing
certain aspects of the six layers. The purpose of this
meta-model is twofold: It can be used for classifying
and extending existing specific BDM and it can be
an orientation to derive new BDM models for big
data projects. Therefore, the model shown in Figure
1 is entitled “BDM cube”, which stands for Big Data
Management Meta Model and, hence, the M cube,
the third power of M, in the name.
Figure 1: The proposed big data management cube
provides layers of abstraction as a meta-model.
3.1 Big Data Management Canvas
Big data processing information systems should be
aligned toward the generation of knowledge and
value. From expert feedback, we know that business
/ IT alignment (Luftman and Brier, 1999) is most
important for successful BDM projects. Therefore,
Figure 2 describes business aspects, as well as
information technology (IT) aspects, for the
implementation and application of each layer in the
management model.
Analogous to the business model canvas
(Osterwalder and Pigneur, 2010), this model can be
plotted onto an actual canvas and used in
management workshops to develop big data
strategies and applications. Therefore, it is entitled
Big Data Management Canvas. The fields on the
canvas are addressed by its BDM cube layer
(numbers 1-5) and by positioning it as a business or
IT question (letters A-B). On top, data intelligence
supports the whole process. Each field contains a
title and a question that didactically guides the
Modeling and Qualitative Evaluation of a Management Canvas for Big Data Applications
151
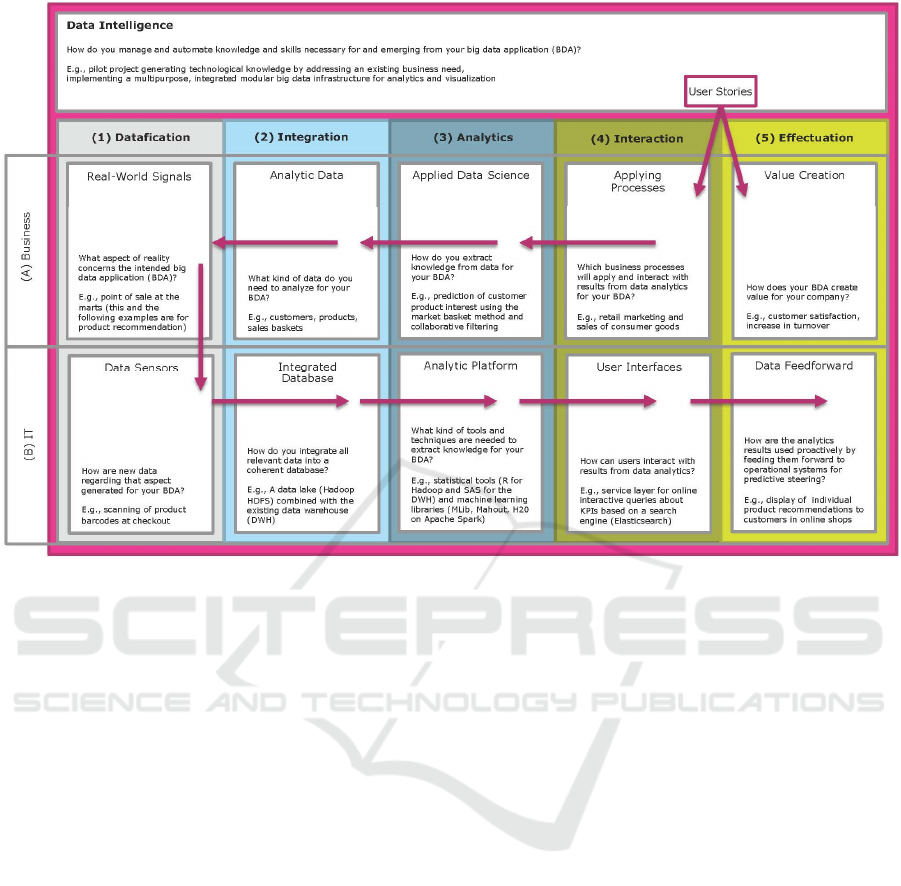
Figure 2: The proposed big data management (BDM) canvas provides fields of action for planning big data applications.
canvas users toward productive thinking within that
field of action. In addition, for bootstrapping ideas,
every field provides an example from the Migros (a
Swiss supermarket) big data application project case
study published by Gügi and Zimmermann (2016).
By applying the canvas in workshops, big data
applications can be planned and documented by
pinning or sticking requirements, visions, plans,
tasks, and other relevant information written on
cards to the corresponding fields on the canvas. This
method can be applied in project management for
requirements engineering and status reporting. The
application direction is shown with arrows in Figure
2. Planning new big data applications should start
with their intended business value and applying
processes before going into technical details,
following the arrows in a counterclockwise direction
and filling it with current versus target state. The
following paragraphs define the canvas fields in
detail.
Data intelligence refers to the competence of an
organization to acquire and apply knowledge and
skills for big data management. This can be
understood as the management and engineering of
intelligence for all steps of the data-to-knowledge
pipeline (Abadi et al., 2016). Data intelligence is a
knowledge-driven, cross-platform function that
ensures that data assets can be optimally deployed,
distributed, and used over all layers of big data
management. This includes the proper establishment
of necessary basic conditions, as well as setting up
and developing technological infrastructures, know-
how, and resources.
1. Datafication is the capture of real-world
signals (1A) in the form of data sensors (1B). In the
case that relevant analytic data is not yet available,
new data can be generated by datafying physical
metrics, as well as user input.
2. Data integration is the combination of existing
analytic data (2A) from different business
applications into a single platform with consistent
access. Interfaces to data sources, big data
processing systems—as well as database
management systems—form an integrated database
(2B) for analytics. Here, special care must be taken
for scalability regarding the big data characteristics
of volume, velocity, and variety.
3. Data analytics is the transformation of raw
data into usable information. (OECD, 2017). In this
step, analytic processes apply data science (3A)
methods to the integrated database. This is defined
by NIST (2015a, p. 7) as “the extraction of
actionable knowledge directly from data through a
process of discovery, or hypothesis formulation and
hypothesis testing”. With respect to big data, a
scalable analytic platform (3B) is implemented to
DATA 2017 - 6th International Conference on Data Science, Technology and Applications
152

deliver statistical and machine learning tools that
operate on a parallel computing infrastructure.
4. Data interaction consists of mutual
interferences of data analytics and applying
processes (4A) that use the information resulting
from data analysis. At this point, user interfaces
(4B) enable the interaction of data analytics results
and the socio-technical organization.
5. Data effectuation means the utilization of the
data analysis results for value creation (5A) in the
products, services, and operations of the
organization. Analytics generate predictive signals
that enable data feedforward (5B) that, in contrast to
feedback, helps prevent disturbances and increases
system stability proactively in advance. This is
achieved by loading data analytics results into the
productive process of the organization.
4 PILOT APPLICATIONS
4.1 Case Study: BDM Canvas for Big
Data Management Strategy
EKZ is the power utility company of Zurich. It is a
public institution that serves one million customers.
EKZ employs 1,400 people and has a balance sheet
of 2 billion euros. Because of the possible
liberalization of the energy market in Switzerland,
EKZ needs to adapt to new retail strategies to gain
new customers. To do so, EKZ is designing a digital
strategy that entails the processing and utilization of
big data. To bootstrap a big data strategy, a
workshop was held to evaluate the current state of
BDM at EKZ and to sketch a vision of BDM goals.
The BDM canvas was utilized as a pilot
application in a big data strategy workshop. Three IT
managers, two product managers, and two marketing
specialists were involved. In the beginning, the
participants were introduced to the BDM cube meta-
model and to the BDM canvas. Each field was
explained in detail. Then, red and yellow Post-it
Notes were distributed. The workshop participants
were asked to write down the actual states of BDM
at their enterprise on yellow Post-its and target states
of BDM on red Post-its. During this creative phase,
a participant asked for specific examples because the
names of the BDM canvas fields are rather abstract.
Here, the Migros case study (Gügi and
Zimmermann, 2016) was used as an example to
explain the fields to the participants while they were
writing down their ideas. After 15 minutes, the
participants were asked to share their ideas and to
stick the Post-its on the canvas to the corresponding
field. One by one, each participant went to the
canvas and explained his or her thoughts. So, the
canvas was filled with insights and plans. Then, the
group gathered around the canvas and each item was
reviewed. Some items had to be moved to a better
corresponding field. In the big data strategy
workshop, the following insights were generated.
Data Intelligence. There were many inputs in the
workshop concerning knowledge gaps about basic
conditions that need to be clarified to enable
successful big data applications. Clear business
goals regarding big data management are needed,
with legal and compliance aspects of data protection
to be clarified first. The data culture must change
from departmental silos to enterprise-wide data
integration. The long-term goal is to enable a closed
loop between the target group definition and the
campaign outcome for continuous optimization.
1. Datafication. As real-world signals (1A), the
behavior of the customers on the company’s website
and the customers’ energy consumption over time
were identified as most relevant. The company has a
diversified business next to the core business that
can also be interesting. For the data sensors (1B),
the smart meter is an energy usage sensor that
delivers the energy consumption data of individual
customers in fixed intervals of 15 minutes to the
power utility company. The goal is to provide real-
time data from sensors in the customers’ homes
based on internet of things (IoT). That allows to
create a timeline of energy consumption for every
customer as a base for analytic applications.
2. Integration. Analytic data (2A) on cost
centers’ credit-worthiness is available from the
enterprise resource planning (ERP) application.
There are several customer relationship management
(CRM) applications with different customer
numbers that need to be harmonized. The goal is to
make geographical data, Google Analytics data, all
ERP data, user data from the website, and IoT
power-usage data available for analytics. It has been
established in the workshop that there is a need for
an integrated database (2B). Analytic data in the
company at the time of the workshop were not
optimally integrated. There is a data warehouse, but
it integrates only a part of the data needed for
analytics; CRM systems and customer information
needs to be consolidated and integrated. All relevant
data from all online transactional processing (OLTP)
and online analytical processing (OLAP) platforms
need to be combined and integrated for analytics.
3. Analytics.
The main goals for data science
(3A) at EKZ are to analyze the smart meter time
series to predict energy consumption and to develop
Modeling and Qualitative Evaluation of a Management Canvas for Big Data Applications
153

new products; to predict credit-worthiness and
customer value; and to predict cross-selling
potential. However, there are no data scientists
inside the company. The internal resources need to
be built up. Concerning the analytics platform (3B),
all IT is outsourced to a service provider company.
There is no know-how regarding analytics tools and
platforms. This know-how needs to be established,
especially regarding customer segmentation and
campaigns.
4. Interaction. Two applying processes (4A) that
interact with analytics results were identified: energy
network coordination and personalized marketing.
Regarding the user interfaces necessary to interact
with the analytics results, no inputs were given at the
workshop.
5. Effectuation. The intended big data application
at EKZ should provide value creation (5A) by
reducing the cost per order; by improving cross-
selling; by preventing credit default and losses; and
by accurately meeting energy demands. As data
feedforward (5B), analytics results could be loaded
into operational systems to enable dynamic pricing
based on predictions to balance energy loads in the
network.
The application of the BDM canvas at EKZ
helped to capture the current state of BDM in the
organization; it also helped to organize the target
state of BDM to bootstrap big data applications. The
canvas, as a frame of reference, primed the
discussion in the workshop in a productive direction.
Many of EKZ’s requirements were about basic
conditions concerning data intelligence, such as
building up data science know-how, business goals,
and compliance. Therefore, the field for data
intelligence was very important, especially in the
beginning, but the fields were not well understood
by the end users. The model was too abstract to be
applied without coaching by a human expert.
4.2 Case Study: BDM Canvas for
Project Management
“Silberkredit” Bank is a major financial service
provider in Austria. To provide anonymity, the name
of the company has been changed by the authors.
Silberkredit employs approximately 1,500 people,
amounting to a balance sheet total of about 30
billion euro. The bank started a proof-of-concept
project to evaluate possible applications of big data.
Within this proof of concept, Silberkredit applied the
BDM canvas as a big data project planning and
reporting methodology. To do so, it was combined
with the Business Model Canvas (BMC)
(Osterwalder and Pigneur, 2010) and Scrum
(Schwaber, 2004). Initially, Scrum user stories were
positioned on the canvas to generate a product
backlog with ideas to optimize the business value of
dats, for example: “As a product manager, I want to
know more about the segmentation of my market so
that I can propose better offerings” or “As account
manager, I want to know what my customers are
really ready to pay for to optimize my individual
value proposition”. Other user stories centered on
key activities, such as cost savings in generating the
necessary reports for the financial market authority.
These requirements were elaborated upon in a
brainstorming fashion among an interdisciplinary
group of professionals so that no idea was
prematurely eliminated.
Once the requirements were collected, they were
filtered to select the relevant ones. The user stories
were assessed and selectively removed from the
product backlog. A possible reason to remove a user
story was if it did not directly address data
management issues; for example, adding a non-data-
based functionality into the online banking portal.
Another reason to remove a user story was if it
regarded a small benefit / cost ratio. The remaining
user stories were positioned on the BDM canvas:
The user stories’ desires, representing target
business value, were pinned to the field value
creation (5A). The corresponding end user roles
were placed in the field applying processes (4A).
The BDM canvas was then filled with
corresponding tasks in a counterclockwise direction.
First, consumers of the analytics results for the field
applying processes were derived from the value
creation entries. Second, the abstract analytical
methods necessary to generate the required insights
were developed from the existing entries to generate
tasks in the field of data science (3A). This was
followed up by an assessment of the data required to
apply these analytical methods in the field analytic
data (2A). If the required data would not have been
available within existing data sources, this data
could have been captured in the field real-world
signals (1A); however, that was not the case. These
steps were made with a strict business perspective in
a sense of what results were pursued and which data
content was used. This was followed up by a
corresponding decuction of the technical
implementation. First, no need for data sensors (1B)
was identified. In the next step, the field integrated
database (2B) was analyzed in three ways: Existing
data systems containing the data listed in field 2A
were identified; the Hadoop distributed File System
(HDFS) was identified as the central data storage
DATA 2017 - 6th International Conference on Data Science, Technology and Applications
154

technology and for data integration; and interfaces to
link analytic data from field 2A with this central
integrated database (2B) were selected. In the next
step, software, tools, and algorithms for the field
analytics platform (3B) were selected by assessing
the needs identified in field 3A and compatibility
with the data storage technology chosen in field 2B.
This information was used in the field user
interfaces (4B) to identify the interfaces for the
interaction of consumers with the data analytics
results. The last step was the identification of the
interfaces to feed forward the data analytics results
into the productive process of the organization.
These results were listed in the field data
feedforward (5B) of the BDM canvas.
This planning was manually performed by using
a large paper canvas and Post-its. While collecting
the canvas entries, the number identifying the
corresponding user story was written on a Post-it.
The results were collected in an Excel spreadsheet.
In analogy to the Scrum story points, the entries
were named BDM points and numbered for future
identification. This way, every user story consisted
of multiple BDM points. In the next step, the
required effort for the implementation of every
BDM point was assessed by using the scrum
methodology, and the overall estimate for every user
story was identified. Based on that, the Scrum
methodology of release- and sprint-planning was
applied to plot the technical implementation. Status
reports were generated using Scrum “burndown
charts” and “traffic light reports” for every field of
the canvas.
The application of the BDM canvas at
Silberkredit supported the engineering requirements
for big data applications by aligning Scrum user
stories with specific fields of BDM. Also, it
supported a frame for progress reporting for the big
data project. The canvas fields gave Silberkredit
information about how to subdivide the giant task of
building new big data applications into clearly
manageable areas, thus reducing entropy in the
bootstrapping phase. The datafication aspect was not
used at Silberkredit because it turned out that the
required data was already largely available in
existing data sources. In the Silberkredit case study,
the direction of application started with the business
goals of the big data application and deduced the
technical implementation counterclockwise step by
step. It was important for Silberkredit to align big
data management with a clear understanding of how
value will be generated and to go into technicalities
only in a second step. However, the BDM canvas
method was applied manually. There is a lot of
potential for business process automation using the
BDM canvas.
5 DISCUSSION
To support non-technical decision-makers to
implement big data applications, we have proposed a
reference model for big data management that
extends current theorizing in the NIST Big Data
Reference Architecture by adding the aspects of
actionability, effectuation, and intelligence. The
existing NIST model was extended by the following
points with the intention of making it more
actionable: our proposed model aligns the
dimensions of business and IT in BDM; it introduces
the explicit management of data intelligence, (i.e.,
the ability to apply as well as acquire knowledge
and skills by and about BDM); it introduces the
explicit management of effectuation of data
analytics results to create value; it links BDM to the
business model canvas method to provide a
procedure model; and it links BDM to project
planning and reporting using the Scrum method.
We have evaluated our model in two pilot
applications. Thus, we qualitatively establish the
following discussion: The value of our method
consists of providing information to structure big
data application design from scratch to decision
makers. The model seems effective, especially for
recognizing and analyzing phases by reducing
entropy about possible starting points for BDM. The
correspondence between business and IT aspects is
very interesting. The two case studies are also
interesting and show many valuable findings.
However, the proposed method is only a high-level
business informatics framework for big data
management with very little technical details. To
make the BDM canvas effective for practitioners,
support and guidance for the users are needed (e.g.,
moderation support for managers to assign their
inputs to the right fields and guidance support to
choose technical options within the fields of action).
6 OUTLOOK
As a next step, software support will be developed
for using the BDM canvas to document current
states, to plan new applications, and to track
progress in big data projects. We intend to develop a
collaborative BDM documenting, planning, and
configuration and reporting software platform based
on a virtual BDM canvas. This software should
Modeling and Qualitative Evaluation of a Management Canvas for Big Data Applications
155

support the method and process of filling the canvas
by the users without the need for expert coaching by
providing step-by-step user guidance. This software
should provide, for each field of action, a menu of
specific technical options and provide technical
depth to the point that the choices can later be
applied for a semi-automated cloud platform
configuration for new big data projects. To
empirically support the choice of technical options
for each canvas field, a meta-analysis of several
existing big data application case studies (e.g., in
Davenport and Dyché, 2013) should be performed.
The BDM canvas in its electronic form can, in turn,
support process automation in BDM by partially
automating the configuration of new cloud big data
applications. Therefore, a second step is to develop a
configuration tool structured by the BDM canvas to
automate building infrastructures for data storage,
analytics, and visualization. This automated big data
cloud computing environment will ask specific
parameters in each of the fields of action of the
BDM canvas, and use this input for the automated
configuration of (1) the analytics platform using the
CRISP4BigData method (Berwind et al., 2016) and
(2) the interactive visualization using the
IVIS4BigData method of Bornschlegel et al., (2016).
The aim is to provide a platform that automates the
task of requirements engineering and configuration
for cloud big data applications as far as possible.
REFERENCES
Abadi, D., Agrawal, R., Ailamaki, A., Balazinska, M.,
Bernstein, P. A., Carey, M. J., et al. (2016). The
Beckman Report on Database Research. Commun.
ACM, 59(2), 92–99.
Argyris, C. (1996). Actionable Knowledge: Design
Causality in the Service of Consequential Theory. The
Journal of Applied Behavioral Science, 32(4), 390–
406.
Berwind, K., Bornschlegl, M., Hemmje, M., & Kaufmann,
M. (2016). Towards a Cross Industry Standard Process
to support Big Data Applications in Virtual Research
Environments. Proceedings of Collaborative
European Research Conference CERC2016. Cork
Institute of Technology – Cork, Ireland.
Bornschlegl, M. X., Berwind, K., Kaufmann, M., Engel, F.
C., Walsh, P., Hemmje, M. L., et al. (2016).
IVIS4BigData: A Reference Model for Advanced
Visual Interfaces Supporting Big Data Analysis in
Virtual Research Environments. Advanced Visual
Interfaces. Supporting Big Data Applications (pp. 1–
18). Springer, Cham.
Chang, W. L. (2015a). NIST Big Data Interoperability
Framework: Volume 1, Definitions. NIST Special
Publication, NIST Big Data Public Working Group.
Chang, W. L. (2015b). NIST Big Data Interoperability
Framework: Volume 5, Architectures White Paper
Survey. Text.
Chang, W. L. (2015c). NIST Big Data Interoperability
Framework: Volume 6, Reference Architecture. Text, .
Davenport, T. H. (2013). Analytics 3.0. Harvard Business
Review, 91(12), 65–72.
Davenport, T. H., & Dyché, J. (2013). Big Data in Big
Companies. Portland, Oregon: International Institute
for Analytics.
Demchenko, Y., Grosso, P., Laat, C. de, & Membrey, P.
(2013). Addressing big data issues in Scientific Data
Infrastructure. 2013 International Conference on
Collaboration Technologies and Systems (CTS) (pp.
48–55).
Floridi, L. (2012). Big Data and Their Epistemological
Challenge. Philosophy & Technology, 25(4), 435–437.
Gartner. (2012, May 25). What Is Big Data? - Gartner IT
Glossary - Big Data. Gartner IT Glossary.
Gügi, C., & Zimmermann, W. (2016).
Betriebswirtschaftliche Auswirkungen bei der
Nutzung von Hadoop innerhalb des Migros-
Genossenschafts-Bund. In D. Fasel & A. Meier (Eds.),
Big Data, Edition HMD (pp. 301–317). Springer
Fachmedien Wiesbaden.
Hilbert, M., & López, P. (2011). The World’s
Technological Capacity to Store, Communicate, and
Compute Information. Science
, 332(6025), 60–65.
Kaufmann, M. (2016). Towards a Reference Model for
Big Data Management. Research Report, University
of Hagen, Faculty of Mathematics and Computer
Science.
Laney, D. (2001). 3D Data Management: Controlling
Data Volume, Velocity, and Variety. Application
Delivery Strategies. Report, Stamford: META Group.
Luftman, J., & Brier, T. (1999). Achieving and Sustaining
Business-IT Alignment. California Management
Review, 42(1), 109–122.
Mosley, M. (2008). DAMA-DMBOK Functional
Framework. DAMA International.
OECD. (2017). Data analysis definition. OECD Glossary
of Statistical Terms -, .
Österle, H., Becker, J., Frank, U., Hess, T., Karagiannis,
D., Krcmar, H., et al. (2010). Memorandum on design-
oriented information systems research. European
Journal of Information Systems, 20(1), 7–10.
Osterwalder, A., & Pigneur, Y. (2010). Business Model
Generation: A Handbook for Visionaries, Game
Changers, and Challengers (1st ed.). Hoboken, NJ:
John Wiley & Sons.
Provost, F., & Fawcett, T. (2013). Data Science and its
Relationship to Big Data and Data-Driven Decision
Making. Big Data, 1(1), 51–59.
Schwaber, K. (2004). Agile Project Management with
Scrum. Microsoft Press.
Zikopoulos, P., & Eaton, C. (2011). Understanding Big
Data: Analytics for Enterprise Class Hadoop and
Streaming Data (1st ed.). McGraw-Hill Osborne
Media.
DATA 2017 - 6th International Conference on Data Science, Technology and Applications
156
