
Intrusion Location with Breaking-the-Pulse-Width-Limit Spatial
Resolution and High Robustness based on φ-OTDR and
Spatial Frequency Analysis
Zhou Sha, Hao Feng, Yi Shi
and Zhoumo Zeng
State Key Laboratory of Precision Measurement Technology and Instruments, School of Precision Instrument and
Opto-electronic Engineering, Tianjin University, 92 Weijin Road, Tianjin 300072, China
Keywords: Phase-sensitive OTDR, Vibration Location, Spatial Resolution, Spatial-frequency, Energy Distribution.
Abstract: This paper proposes a vibration location method based on spatial-frequency analysis, which can help
achieve better location performance in the application of φ-OTDR. The method is proven to be able to
separately locate coupled vibration events to some extent, achieve break-the-pulse-width-limit spatial
resolution in the case of single event detection with higher robustness, and provide more comprehensive
information about the vibration situation to better identify vibration events, noise and disturbance. Different
experiments including indoor and outdoor tests are conducted to practically validate the effectiveness of the
method and its advantages over the conventional moving differential method. Experiment results show that
the proposed method exhibits several useful merits.
1 INTRODUCTION
Distributed optical fibre sensing technique based on
phase sensitive Optical Time Domain Reflectometry
(Taylor and Lee, 1993) has become increasingly
popular in recent years (Bao and Chen, 2012). With
the capability of simultaneous multipoint
monitoring, easiness of deployment and
maintenance, intrinsic immunity to chemical
corrosion and electromagnetic interference as well
as the cost effectiveness, φ-OTDR has been
extensively used in many fields such as intrusion
detection, perimeter security surveillance (Owen et
al., 2012), oil and gas pipeline monitoring (Peng et
al., 2014a), railway safety monitoring(Peng et al.,
2014b), structural health monitoring (Bahrampour et
al., 2010) as well as seismic applications. Many
researches have been conducted to improve the
sensing performance from different perspectives,
such as extending the sensing range from typically
tens of kilometres to over 100km (Wang et al.,
2014), raising the frequency response to break the
round-trip-time limit (He Q et al., 2015),
overcoming the nonlinear distortion of intensity
detection by conducting phase demodulation and so
forth (Wang et al., 2016).
Although the performance of φ-OTDR has been
greatly improved from many perspectives (Wu et al.
2015), the research pertaining to enhancing the
capability of vibration location is rather limited.
Since having the vibration events located is
generally fundamental and prior to other subsequent
analysis, it is necessary to spend efforts improving
the location capability. Traditional ways of locating
intrusions include moving differential (Lu et al.,
2010) and distributed parameter computation (Shi et
al., 2016), which both have their noticeable
drawbacks. The working principle of moving
differential is based on the time signal fluctuation. It
picks out those positions with high fluctuation
amplitude as the results of intrusion location. Since
the laser frequency drift and environmental
temperature change can also cause signal
fluctuations, fake differential peaks and false
location results can be generated when moving
differential is used in practical applications. The
distributed parameter computation computes some
parameter of the time signal in each position as an
indicator of the presence of intrusion. The parameter
can be selected from the perspective of statistics and
information theory, such as entropy and correlation
dimension (Shi et al., 2016). Although this method
generally gives a better location performance
Sha, Z., Feng, H., Shi, Y. and Zeng, Z.
Intrusion Location with Breaking-the-Pulse-Width-Limit Spatial Resolution and High Robustness based on ϕ-OTDR and Spatial Frequency Analysis.
DOI: 10.5220/0006383700170023
In Proceedings of the 14th International Joint Conference on e-Business and Telecommunications (ICETE 2017) - Volume 3: OPTICS, pages 17-23
ISBN: 978-989-758-258-5
Copyright © 2017 by SCITEPRESS – Science and Technology Publications, Lda. All rights reserved
17
compared to moving differential, the computation
load is somehow raised in a significant level,
regardless of which specific indicator is chosen. As a
consequence, real time monitoring is unachievable
and the method can hardly be applied in practical
applications. On the other hand, the spatial
resolution is limited by the probe pulse width.
Higher pulse width would lead to lower spatial
resolution, thus deteriorates the location accuracy.
Our work proposed a new vibration location
method using spatial frequency analysis. It reports
the vibration condition in the entire sensing range in
a straightforward and intuitive way. The energy
distribution along the fibre of each frequency
component and the power spectrum at each position
are simultaneously reflected in one colour-encoded
figure. Since vibrations in different frequency bands
are independently presented at different positions
along the frequency axis, fake fluctuations caused by
laser frequency drift and environmental temperature
change, which more often appears with lower
frequency, can be conveniently distinguished and
thus will not lead to confusion. Besides, thanks to
the Fast Fourier Transform algorithm, this method
based on spatial frequency analysis is high-
efficiency and time-saving. In addition, combined
with the results of Shi et al., (2015), this method can
explicitly determine the edge of the vibration
segment, thus realize break-the-pulse-width-limit
spatial resolution for single event detection with
higher robustness. For overlapped multiple vibration
events with unique power spectrum, this method can
also help separate the events to a certain extent, and
thereby achieve higher general spatial resolution.
2 METHODOLOGY
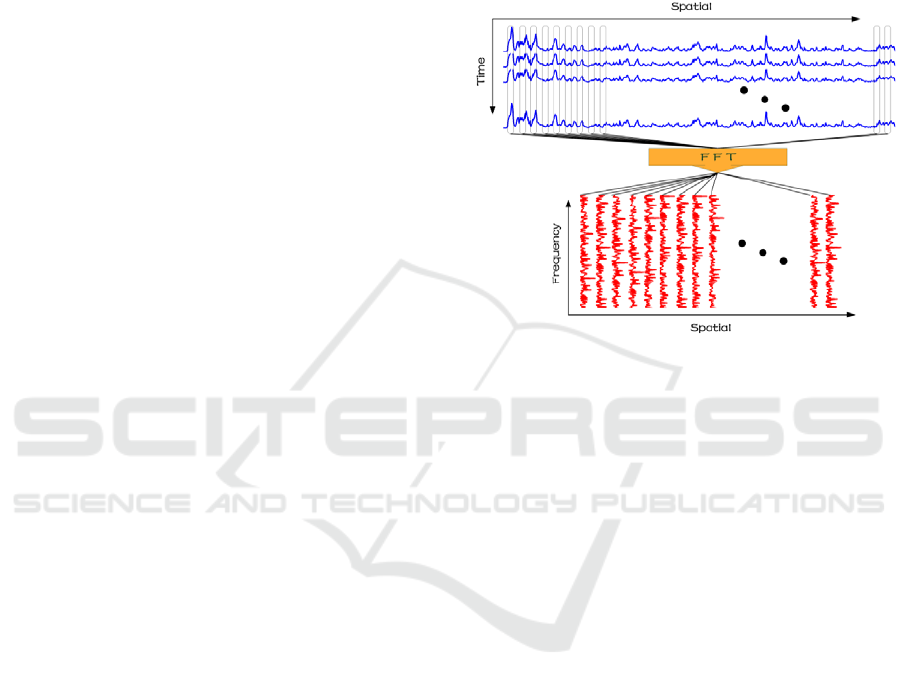
The principle of the proposed spatial-frequency
analysis is illustrated in Fig. 1. The blue matrix is
essentially composed of multiple time-aligned
Rayleigh backscattered (RBS) traces, with the
horizontal axis being spatial location and the vertical
axis being time. Performing FFT transform
vertically to the blue matrix yields the red matrix,
which presents the energy distribution with respect
to space and frequency. Different columns of the red
matrix represent the power spectrum density at
different positions. Different rows of the red matrix
represent the energy distribution of different
frequency components along the fibre. As can be
seen, with the help of this frequency-spatial energy
distribution matrix, one can easily and intuitively
obtain the frequency information at each location.
The position without vibration would exhibit low-
level and uniform energy distribution, yet the
position affected by external vibration would exhibit
unique power distribution pattern, which is
essentially the power spectrum. Thus, vibration
events can be easily located by inspecting the energy
distribution simultaneously in the spatial and
frequency domain.
Figure 1: Principle illustration.
Assume the length of the sensing fibre is L, the
sampling rate of the data acquisition card is f, the
pulse repetition rate is N, the refractive index of
fibre is n, and the raw data matrix (blue matrix) is
made up of data generated within one second, then
the raw data matrix can be expressed as
12
T
iM
ITT TT
(1)
i1 2
[S S S ]
iiiM
T
(2)
2/
M
nfL c
(3)
T
i
, which is made up of M sample points, denotes
the ith RBS trace. By concurrently performing FFT
to each column of I, the spatial-frequency energy
distribution matrix is generated and expressed as
12
j
N
OFF FF
(4)
1j 2j
[A A A ]
T
j
Nj
F
(5)
is the power spectrum of time signal
. The value
of
is calculated by means of FFT algorithm,
1
i2 /
0
,
N
ik i i N
ij kj N N
k
ASwwe
(6)
where i is the imaginary unit, i is the discrete
frequency index. This allows us to obtain the spatial
OPTICS 2017 - 8th International Conference on Optical Communication Systems
18
distribution of each and every discrete frequency
component i ,
12
[ ]
iii iM
DAA A
(7)
denotes the spatial energy distribution of discrete
frequency i.
The method is essentially mapping the signal
energy into a spatial-frequency plane from which
one can independently investigate each discrete
frequency’s distribution along the fibre and the
unique power spectrum of time signal in each
position. One such colour-encoded plane provides
the general view of the entire sensing range in one
second. Positions with vibration can be distinctly
revealed, and its specific power spectrum is at the
same time readable. Low frequency fluctuation
caused by laser drift and temperature change will
only appear in the low frequency band, and the
positions with real vibration will have unique energy
distribution in the high frequency band. Thus the
fake vibration can be distinguished from the real
ones by looking at the spatial-frequency energy
distribution pattern and inspecting the frequency
band they occupy.
3 EXPERIMENTAL
VALIDATION
In order to validate the effectiveness of the method,
different experiments including indoor and outdoor
vibration tests are conducted where the vibration
events are located using the proposed spatial
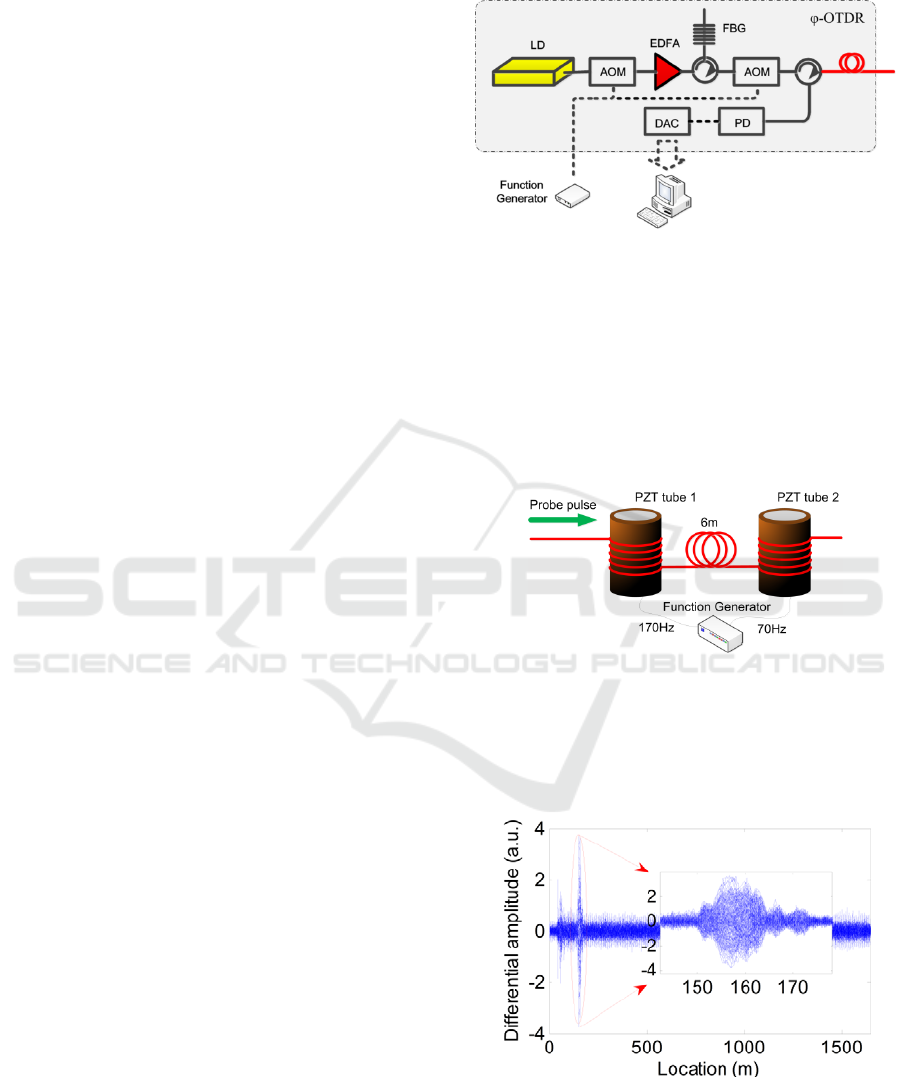
frequency analysis. The system setup is shown in
Fig. 2. An NKT ultra narrow line width laser is used
as the light source. The continuous seed light is
modulated into pulses with an Acoustic Optic
Modulator (AOM). After that, the pulses are boosted
by an Erbium Doped Fibre Amplifier (EDFA) to
obtain higher peak power. A Fibre Bragg Grating
(FBG) is employed together with an optical
circulator to filter out the Amplifier Spontaneous
Emission (ASE) noise from EDFA. A second AOM
is applied right after the FBG to enhance the
Extinction Ratio (ER). The pulsed probe light is
injected into the sensing fibre through an optical
circulator and the Rayleigh Back Scattered light
(RBS) is detected with a PIN detector. The signal is
sampled with a 50MS/s Data Acquisition Card
(DAC) and processed subsequently in a computer.
Three types of vibrations, respectively caused by
Piezoelectric Transducer cylinder (PZT tube),
striking the steel plate and water pipe leakage are
measured with the φ-OTDR system.
Figure 2: Experimental setup φ-OTDR structure.
3.1 PZT Vibration Test
Firstly, two PZT tubes are used to apply sinusoidal
vibration to the fibre. A function generator drives the
two PZT tubes with the corresponding frequency
being 170Hz and 70Hz. The fibre’s length between
the two PZT tubes is 6m. A schematic diagram of
the deployment structure is illustrated in Fig. 3.
Figure 3: PZT vibration setup.
The vibration caused by the two PZT tubes are
firstly located using the conventional moving
differential method. The location result is shown in
Fig. 4.
Figure 4: Moving differential traces.
It can be observed from Fig. 4 and the inset that a
differential peak appears at around 160 m, which
indicates the presence of vibration event at the
Intrusion Location with Breaking-the-Pulse-Width-Limit Spatial Resolution and High Robustness based on ϕ-OTDR and Spatial Frequency
Analysis
19
mentioned location. The 160m location result is
basically correct, however, the starting point of the
vibration segment is not sufficiently clear. The two
individual vibration events respectively caused by
the two PZT tubes with different frequency can not
be distinguished. This partly exhibits the intrinsic
drawbacks of the moving differential locating
algorithm.
As comparison, the proposed spatial frequency
analysis is performed on the same set of experiment
data, and the location result is shown in Fig. 5 and
Fig. 6, which are essentially colour-encoded energy
distribution matrix, describing how the signal energy
is distributed with respect to space and frequency.
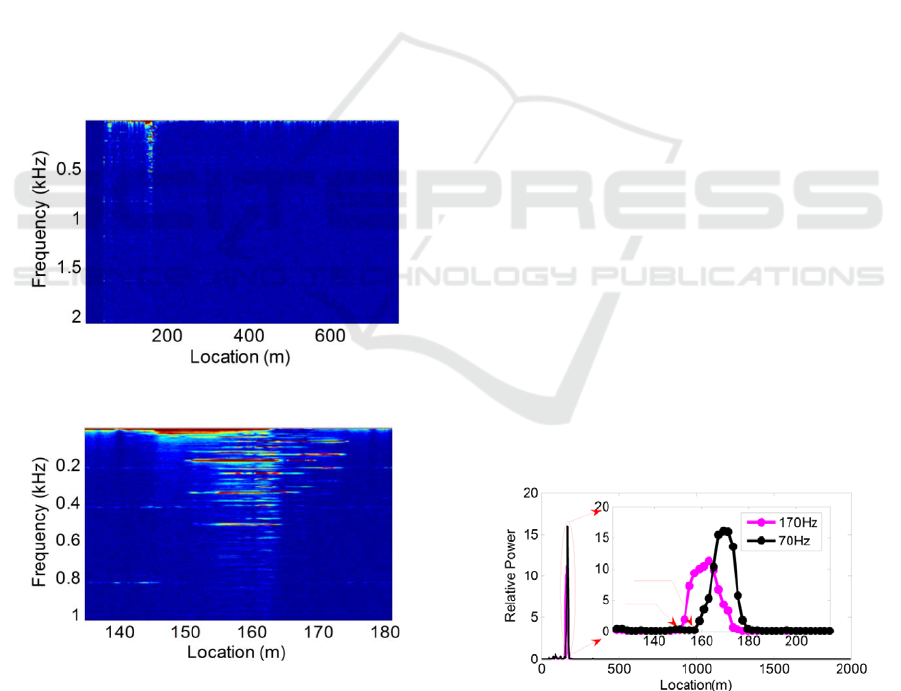
From Fig. 5 it can be observed that there is an
concentrated energy distribution around the position
160m. The corresponding frequency range at that
position approximately starts from 0Hz and ends at
1kHz. Zooming in Fig. 5 gives us Fig. 6, which
clearly exhibits the frequency distribution pattern of
the vibration in detail. Based on Fig. 6 we are
allowed to infer the presence of two individual
vibration events.
Figure 5: Spatial frequency energy distribution.
Figure 6: Spatial frequency energy distribution (detail).
The three thick lines horizontally starting from
150m, vertically appearing at 170Hz, 340Hz and
510Hz are all caused by the 170Hz PZT vibration,
where the 340Hz line and 510Hz line appear as a
result of the interference induced nonlinear
distortion of intensity signal. The four lines
horizontally ending at about 175m, vertically
appearing at 70Hz, 140Hz, 210Hz and 280Hz are
caused by the 70Hz PZT. Similarly, the three lines
apart from the 70Hz line are present due to the
interference induced nonlinear distortion, which can
be mathematically explained by the Jocobi-Angry
expansion. Therefore, the processing result of the
proposed spatial frequency analysis is able to
provide a much larger volume of information than
moving differential can do. It helps distinguish
coupled vibration events based on their unique
frequency distribution patterns. Besides, by
synthetically taking into account the emergence
position of each frequency component, one can
determine the staring point of the vibration segment
with higher robustness. It is revealed from the
research results in [3] that the starting point of the
vibration segment on the intensity trace is the real
indication of the vibration location. In the case of
single event detection, distinctly determining the
starting point of vibration segment means one can
achieve spatial resolution that breaks the pulse width
limit. Therefore, the proposed method can also help
locate single vibration event with higher accuracy
and spatial resolution that is decoupled with the
probe pulse width.
Based on the results given in Fig. 6, we can infer
that 170Hz and 70Hz are the two characteristic
frequency components that can be used to reveal the
respective positions of the two vibration events.
Thus the energy distribution along the fibre of the
two characteristic frequency components are
extracted and plotted in Fig. 7. Two peaks with
rather high signal to noise ratio are clearly present at
around 160m. From the inset, it can be seen the two
peaks respectively start from 151m and 157m. The
6m interval agrees well with the fibre length
between the two PZT tubes.
Figure 7: Spatial distribution of characteristic frequencies.
3.2 Steel Plate Striking Test
For the purpose of testing the location performance
OPTICS 2017 - 8th International Conference on Optical Communication Systems
20
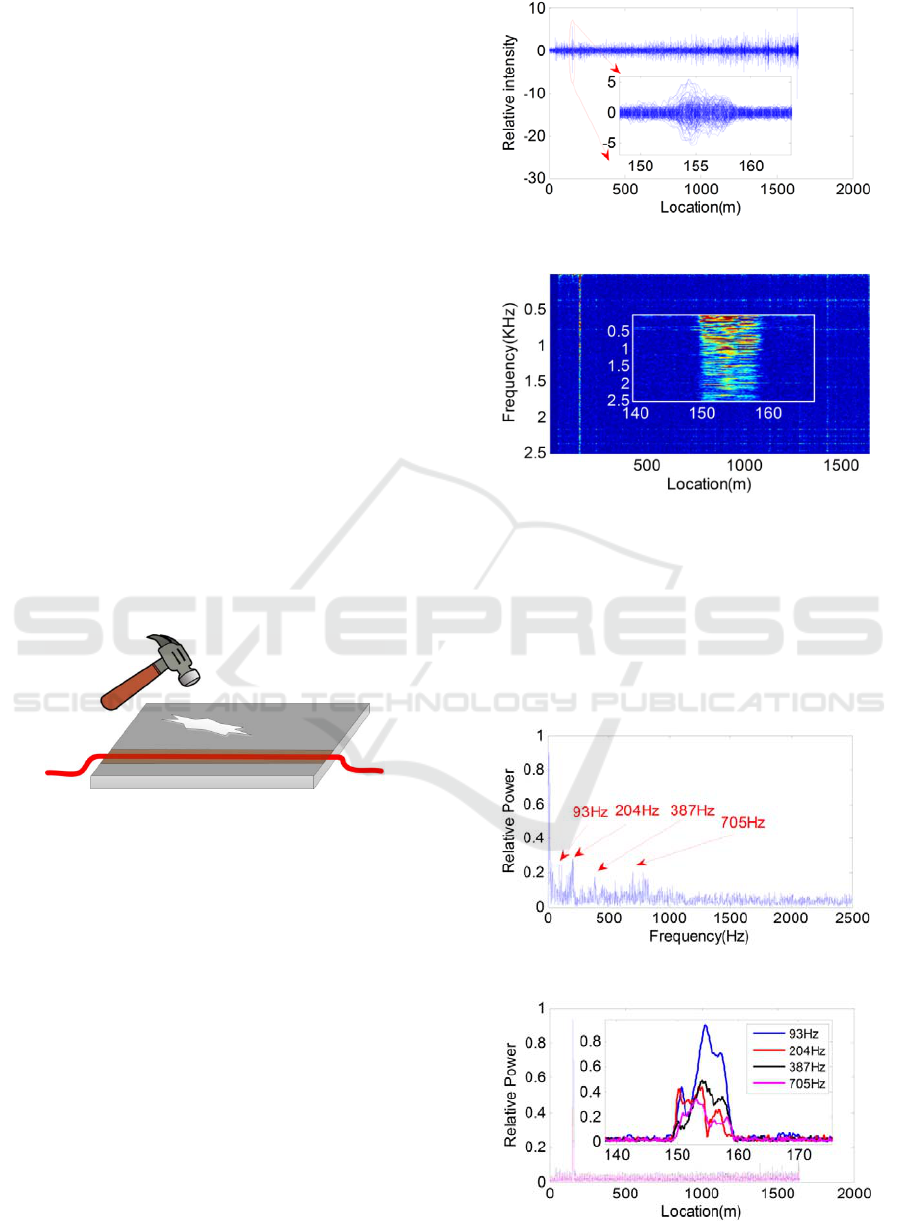
of the proposed method in practical vibration
condition, the second experiment is designed where
a steel plate struck by a hammer is used as the
vibration source. The deployment schematic
diagram is shown in Fig. 8. The fibre is coupled with
the steel plate by vacuum coupling agent which
assures better plate-fibre vibration transmission. The
steel vibration signal is monitored using the home
made φ-OTDR system as shown in Fig. 2 and is
firstly located using the conventional moving
differential method with the result shown in Fig. 9.
A peak can be found at around 155m on the
differential trace, which indicates the presence of
vibration event. As can be seen from the inset, the
peak’s starting point is not clear and the signal to
noise ratio is rather low, thus the vibration location
can not be accurately determined.
The same experiment data is then processed
using the proposed spatial frequency analysis and
the location result is shown in Fig. 10. A vertical
line at around 150m is explicitly shown. Having the
line and its vicinity zoomed in and shown in the
inset, the starting position can be accurately
determined to be 150m. Besides, the frequency
component of the vibration is at the same time
revealed. The energy is shown to cover the entire
frequency response range, i.e., 0-2.5kHz.
Figure 8: Striking steel plate.
Based on the information given in Fig. 10, the
power spectrum of the signal at 150m is plotted to
further investigate the energy distribution, which is
shown in Fig. 11. Four maximum frequency
components, respectively 93Hz, 204Hz, 387Hz and
705Hz are picked out as the characteristic
frequencies of the vibration event. The energy
distribution of the four characteristic frequencies
along the sensing fibre are plotted in Fig. 12. It can
be observed that the energy level of each of the four
frequency components reaches its maximum value
within the range of 150m to 160m. Therefore, the
spatial energy distribution of each of the four
characteristic frequencies can be used to determine
the vibration location.
Figure 9: Moving differential traces.
Figure 10: Spatial frequency energy distribution.
This part of the experiment results show that the
proposed spatial frequency analysis can provide
more abundant information to help locate and
identify the vibration event, such as revealing the
frequency spectrum, indicating the characteristic
frequency, explicitly and robustly give the start
position of the vibration segment.
Figure 11: Characteristic frequencies.
Figure 12: Spatial distribution of characteristic frequencies.
Intrusion Location with Breaking-the-Pulse-Width-Limit Spatial Resolution and High Robustness based on ϕ-OTDR and Spatial Frequency
Analysis
21
3.3 Pipe Leakage Vibration Test
Pipeline integrity monitoring is one of the major
applications of φ-OTDR, where the detection and
location of external intrusion and pipeline accident
such as pipe leakage is necessary. An experiment
pertaining to pipeline leakage location is designed
using the home made φ-OTDR system and
conducted inside a greenhouse. The field setup is
schematically shown in top view in Fig. 13. A PE
water pipe is buried under ground, with about 15m
of it immerged in a dug water tank. An 8mm hole is
drilled on the pipe shell to simulate pipe leakage. A
water pump is used to pump the water from a water
well into the water pipe. The sensing fibre is glued
on the pipe shell surface. When the water pump
comes into operation, water leakage would occur
through the leakage hole, and the leakage induced
vibration is monitored by the sensing fibre.
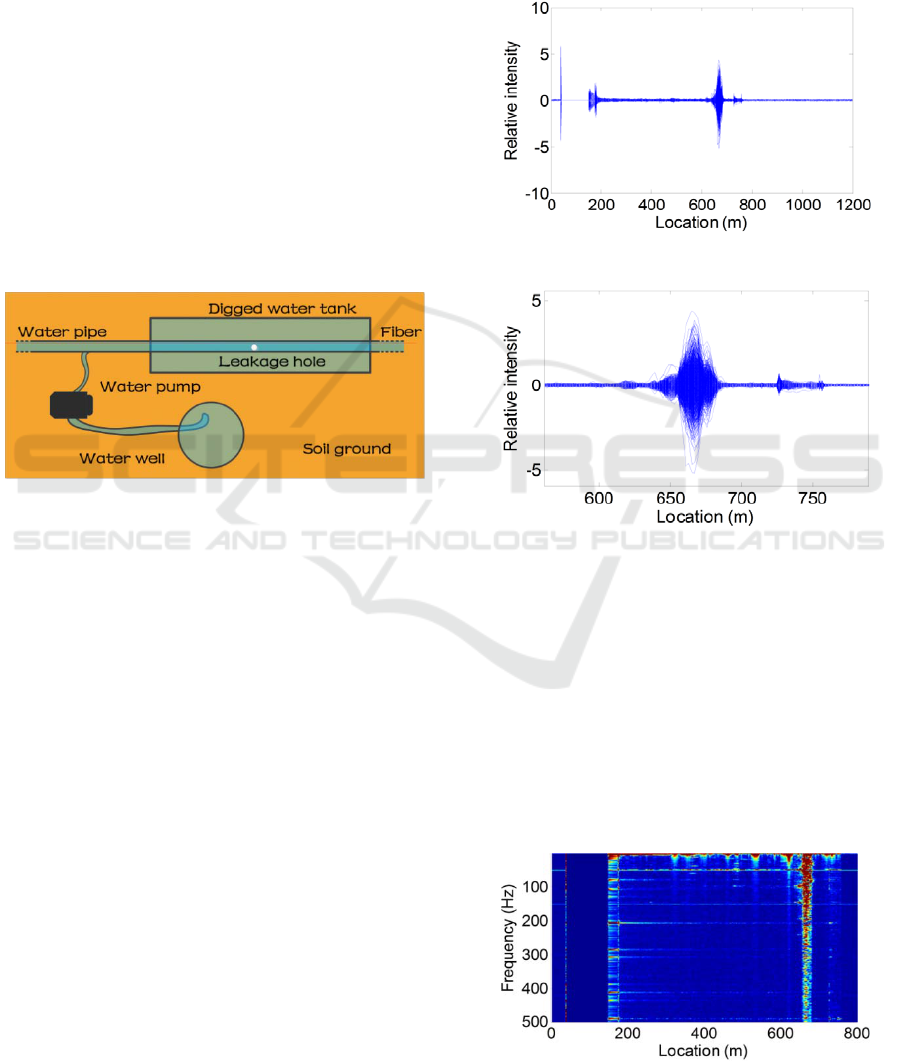
Figure 13: Pipeline leakage experimental setup.
The leakage event is respectively located using
the conventional moving differential method and the
proposed spatial frequency analysis. The processing
result of moving differential is presented in Fig. 14
and Fig. 15. A conspicuous peak appears at around
650m in Fig. 14, which basically gives the correct
position of the leakage event. However in Fig. 14
where the differential peak is zoomed in for clearer
observation, it is hard to tell the starting point of the
vibration segment in that an explicit bound between
the peak and the background trace can hardly be
found. Therefore, the location accuracy is rather
limited.
By performing the proposed spatial frequency
analysis, the leakage event could be better located
with higher accuracy. Fig. 16 gives the spatial
frequency energy distribution in a full view. The
energy line at about 650m reveals the correct
leakage position. In Fig. 17 the energy line is
zoomed in where the start position of vibration
segment can be explicit determined. It can be
observed according to the part of line vertically from
300Hz to 500Hz that the precise start point is 657m.
Disturbance are present in the frequency range
below 200Hz, mainly in 50Hz, 100Hz and 150Hz.
This noise is validated to be caused by the water
pump. When the water pump engine is turned on, the
disturbance accordingly comes about. When the
water pump engine is turned off, the disturbance
disappears.
Figure 14: Moving differential traces.
Figure 15: Moving differential traces (detail).
In general, based on the spatial frequency energy
distribution, one can clearly observe the presence of
the disturbance caused by the water pump engine
vibration, accurately determine the leakage position
by referring to the part of energy distribution over
200Hz and even identify those positions that are
contaminated by the water pump engine noise.
Spatial frequency energy distribution provides more
useful and comprehensive information about the
vibration situation in the monitoring field and thus
helps achieve better location performance.
Figure 16: Spatial frequency energy distribution.
OPTICS 2017 - 8th International Conference on Optical Communication Systems
22
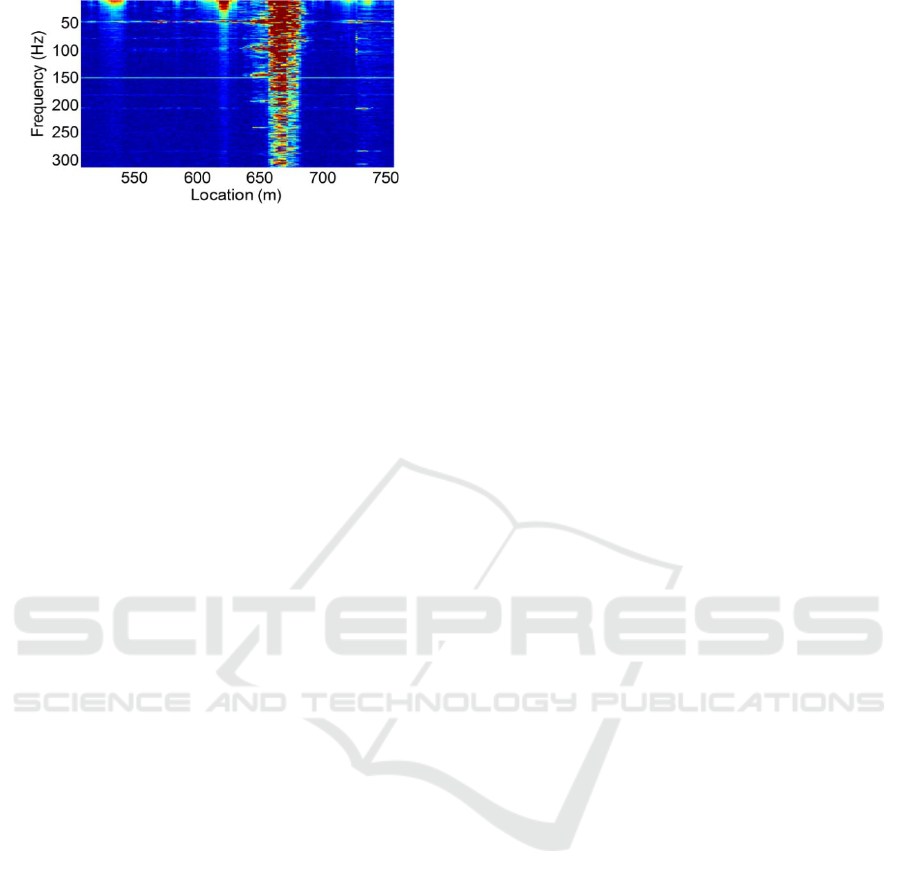
Figure 17: Spatial frequency energy distribution (detail).
4 CONCLUSIONS
A vibration location method used in φ-OTDR
system based on spatial frequency analysis is
proposed and demonstrated. Different experiments
including indoor and outdoor tests are conducted to
comprehensively evaluate the method’s locating
performance in different situations. The method has
been proven to exhibit several useful advantages
over the conventional moving differential method.
Firstly, it provides vibration information in a more
comprehensive way. By referring to the vibration
energy distribution with respect to space and
frequency, one can easily achieve an intuitive
comprehension about the vibration condition in the
entire sensing range. The colour-encoded image can
conveniently reflect how the energy is distributed in
the frequency domain in each position and how the
energy of each frequency component is distributed
along the fibre. Vibration caused by different
sources can be separated according to their unique
frequency spectrums. By synthetically considering
the emerging position of each frequency component,
one can determine the start position of vibration
segment in a more accurate and robust way, which
will lead to better location results. According to the
research result reported in (Shi et al., 2015), it is the
start point of the vibration segment that reveals the
real vibration location, thus accurately determining
the border of vibration segment is of great
importance in that the pulse width limit upon the
spatial resolution can be broken through. Therefore
this method can help achieve break-the-pulse-width-
limit spatial resolution with higher robustness.
Apart from the location information, the
frequency spectrum of each detected vibration is
reflected at the same time. Since vibration caused by
different sources generally exhibit different
characteristic in the frequency domain, this property
is thus very useful to help identify different
vibrations.
Besides, thanks to the mature application of the
FFT algorithm, the proposed method can be
performed in a very convenient and time-saving way.
Real time monitoring based on the proposed method
is generally available.
ACKNOWLEDGEMENTS
The authors appreciate the financial support from the
National Natural Science Foundation of China (No.
61304244), the Natural Science Foundation of
Tianjin (14JCQNJC04900), the Research
Foundation for the Doctoral Program of Higher
Education of China (20130032120066).
REFERENCES
H. F. Taylor and C. E. Lee, 1993. Apparatus and method
for fibre optic intrusion sensing. U.S. Patent 5194847.
X. Bao and L. Chen, 2012. Recent progress in distributed
fibre optic sensors. Sensors (Basel) 12(12), 8601–
8639.
Shi. Y et al., 2015. A long distance phase-sensitive optical
time domain reflectometer with simple structure and
high locating accuracy. Sensors (Basel) 15(9), 21957–
21970.
Wu. H et al., 2015. Separation and determination of the
disturbing signals in phase-sensitive optical time
domain reflectometry (Ф-OTDR). J. Lightwave
Technol. 33(15), 3156–3162.
Peng. F et al., 2014a. Ultra-long high-sensitivity Φ-OTDR
for high spatial resolution intrusion detection of
pipelines. Opt. Express 22(11), 13804–13810.
Peng. F et al., 2014b. Real-time position and speed
monitoring of trains using phase-sensitive OTDR.
IEEE Photonics Technol. Lett. 26(20), 2055–2057.
Owen, G. Duckworth and J. Worsley, 2012. Fibre optical
distributed acoustic sensing for border monitoring.
2012 European Intelligence and Security Informatics
Conference, 362–364.
Shi. Y et al., 2016. Correlation dimension locating method
for phase-sensitive optical time domain reflectometry.
Optical Engineering, 55(9): 091402-091402.
Bahrampour A R et al., 2010. Resolution enhancement in
long pulse OTDR for application in structural health
monitoring. Optical fibre technology, 16(4): 240-249.
Wang. Z et al., 2014. Ultra-long phase-sensitive OTDR
with hybrid distributed amplification. Optics letters,
39(20): 5866-5869.
He. Q et al., 2015. Frequency response enhancement by
periodical non-uniform sampling in distributed
sensing. IEEE Photonics Technology Letters, 27(20):
2158-2161.
Wang. Z et al., 2016. Coherent Φ-OTDR based on I/Q
demodulation and homodyne detection. Optics
express, 24(2): 853-858.
Intrusion Location with Breaking-the-Pulse-Width-Limit Spatial Resolution and High Robustness based on ϕ-OTDR and Spatial Frequency
Analysis
23
