
Flood Modeling using Gis and LiDAR of Padada River in
Southeastern Philippines
Joseph E. Acosta
2
, Ryan Keath L. De Leon
1
, Judy Rose D. Hollite
1
,
Richard M. Logronio
1
and Genelin Ruth James
1
1
LiDAR 1.B. 13, University of the Philippines Mindanao, Mintal, Davao City, Philippines
2
Department of Mathematics, Physics, and Computer Science, University of the Philippines Mindanao,
Mintal, Davao City, Philippines
Keywords: LiDAR, Light Detection and Ranging, HEC-RAS, Modeling, Flood Hazard, Flood, Hazard, Floodplain, River
Analysis System, Digital Terrain Model.
Abstract: Located along the typhoon belt in the Pacific, Philippines is visited annually by an average of 20 typhoons.
This brought frequent flooding to communities and caused damage to flood prone residents. This study is
aimed to generate GIS flood model to simulate flood inundation using Synthetic Aperture Radar (SAR) data
and Digital Terrain Model (DTM) derived from Light Detection and Ranging (LiDAR) datasets. Open-
sourced HEC-HMS and HEC-RAS Models were used. HEC-GeoRAS in ArcMap was used to preprocess
geospatial data of Padada River basin in the Southern Philippines. The result of the study has identified
inundated areas and communities for a 24-hour 5, 25, and 100- year return periods as well as flooded critical
facilities in the flood plains. The output of this study can be used in planning and predicting flood risks for
mitigation.
1 INTRODUCTION
Flood is one of the most disastrous phenomena that
can occur in an area since it has damaging impacts to
human lives, properties, and infrastructures such as
death, spread of diseases, and destruction of
livelihood (Siddayao et al, 2015).
Padada watershed is situated in the southern part of
the Philippines with a total land area of 1,186.80 sq.
km which drains to Padada river and occasionally
flooding the downstream municipalities of Hagonoy,
Padada, and Sulop affecting hundreds of households,
damaging crops, livestocks and properties. Flooding
aggravated hunger and resulted to poor health
conditions among the villagers in these communities
( General (Philippines, 2009):
To reduce flood effects and risks, prediction of the
flood event is a vital information to locate the areas at
risk and to quantify the damages it may result to. The
extraction of this data can be acquired through
simulating the event in a computer using flood model.
Flood modeling requires accurate assessment of
water movement within flood-prone areas as a
reliable basis for mitigation and resource
management (Kim et al, 2016). Several techniques
considering different parameters were used in
practice. One of which is the Hydrologic Engineering
Center-River Analysis System (HEC-RAS).
HEC-RAS is a one-dimensional model which is
able to perform an unsteady flow simulation of a river
(Hammerling et al, 2016). It has been applied to a
range of applications such as bridge and culvert
design, channel modification and floodplain
management (Yuan and Qaiser, 2011). In
implementing this tool, several studies have utilized
high-resolution datasets like digital elevation models
as inputs to capture the detailed profile of river
channels and to achieve more precise results (Turner
et al, 2013).
Light Detection and Ranging (LiDAR) is a digital
elevation model with a topographic horizontal
resolution of 1m. Due to its higher resolution, LiDAR
gives more details and near to accurate topographic
information compared to other DEMS such as
Synthetic Aperture Radar (SAR) and Interferometric
Synthetic Aperture Radar (ifSAR) (Suarez et al,
2014).
In the Philippines, some areas has experienced
Acosta, J., Leon, R., Hollite, J., Logronio, R. and James, G.
Flood Modeling using Gis and LiDAR of Padada River in Southeastern Philippines.
DOI: 10.5220/0006378103010306
In Proceedings of the 3rd International Conference on Geographical Information Systems Theory, Applications and Management (GISTAM 2017), pages 301-306
ISBN: 978-989-758-252-3
Copyright © 2017 by SCITEPRESS – Science and Technology Publications, Lda. All rights reserved
301
distinct changes in the weather patterns with
disastrous results such as flooding (Yumul et al,
2013). With the disaster risk management program in
place, a study was conducted that generates a flood
model using Hydrologic Engineering Center-River
Analysis System (HEC-RAS) as a tool and Light
Detection and Ranging (LiDAR) data sets as digital
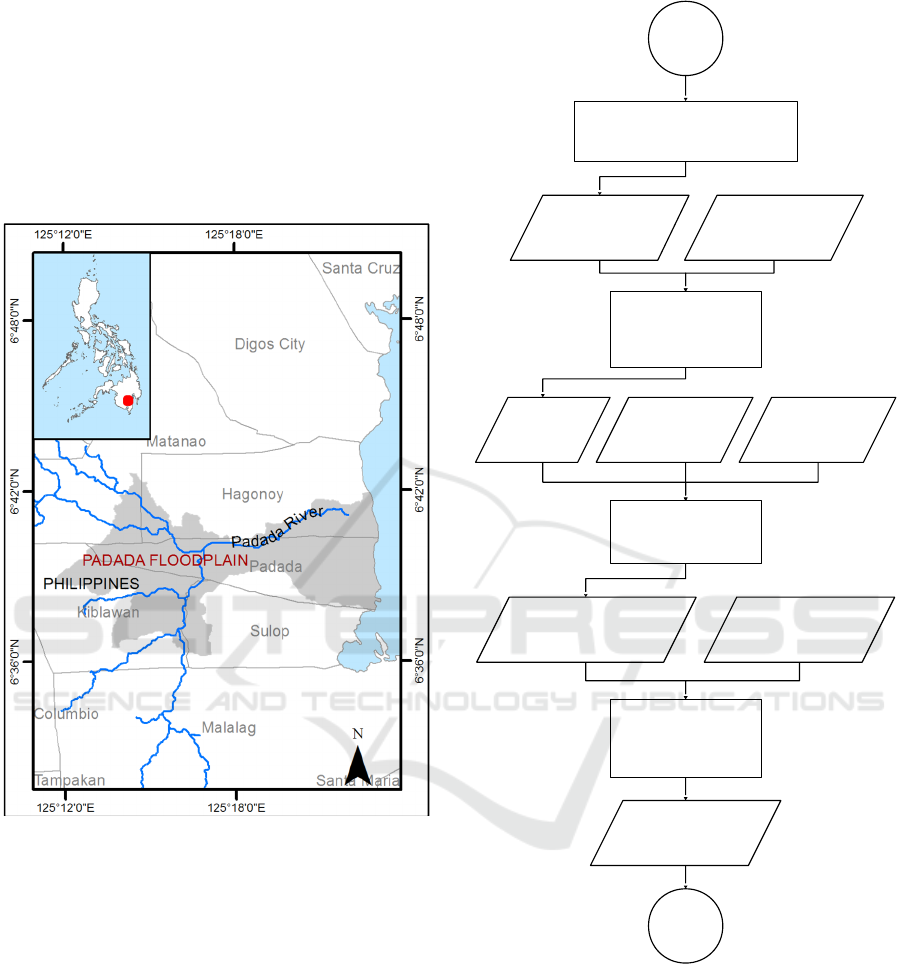
elevation model. A case study is done in Padada River
floodplain in Southern Philippines as in Figure 1.
Figure 1: Location of Padada floodplain in Philippines.
2 METHODOLOGY
Presented in Figure 2 is the method of preparing the
HEC-RAS Model of Padada floodplain. The process
involves four major activities namely (i) Generating
the River Digital Plot, (ii) Flood Model
Preprocessing, (iii) Flood Modeling, and
(iv)Identifying Flood Prone Communities.
Figure 2: Process flow in generating HEC-RAS Model.
2.1 Generating the River Digital Plot
One of the prerequisites in flood model preprocessing
is the river digital plot (RDP) which are polyline
vector files that follow the centerline, left flow path,
right flow path, left bank, and right bank of Padada
River. In this study, LiDAR DTM with a 20 cm
vertical accuracy and various satellite images were
mainly used to verify and generate the RDP. The
digitization of the RDP started from the project point
St art
Generate the River Digital Plot
Digital River Plot
Flood Model
Prep rocessing
Discharge Data of
Padada River
RAS Data
Padada LiDAR Data
Flood Modeling
(HEC-RAS)
Flood Inundation M ap of
Padada Floodplain
Feature Extracted
Shapefiles of Padada
Flood
p
lain
Data Overlay for
Identification of Flood
Prone Communitie
s
Flood Prone Communities
End
Hypothetical
Scenarios
GISTAM 2017 - 3rd International Conference on Geographical Information Systems Theory, Applications and Management
302
where the discharge data was gathered going down to
the outlet of the river. Once done, the generated river
digital plot in Keyhole Markup Language (KML) file
format was converted to a vector file.
2.2 Preprocessing
In generating the flood model, the LiDAR DEM and
the river digital plot were prepared for processing the
physical features of the river. The LiDAR DEM was
initialized as the elevation data while the river digital
plot was used to define the extent of the river. The
digitized river lines were grouped into river data,
containing the centerline, River banks data,
containing the left bank and right bank, and flowpaths
data, containing the right flow path, left flow path,
and centerline of the river. The river centerline was
assigned with a river code and a reach code to provide
a name for the river. To define the flow direction of
the river, each paths from the flowpaths data were
assigned whether a right flow path, a left flow path,
or a channel path. Using the LiDAR DEM as terrain
and the river data as the centerline of the stream, the
stream profile was generated to extract the changes in
elevation along the river channel from upstream to
downstream locations.
After generating the geometric attributes along the
rivercenterline, the construction of the cross-section
cutlines followed. Each cross-section cutline
represents a station in the river where the data for the
one-dimensional flood simulation was based on.The
initial set of cross-section cutlines were uniformly
distributed along the river centerline. Furthermore,
these were adjusted so that there were no lines
intersecting another line and that they have crossed a
river bank only once. This was to avoid the
overlapping of flood inundation among stations.
Having the river data as the centerline of the stream,
LiDAR DEM as terrain, and cross-section cutlines,
the cross-section cutline profile was generated to
extract the elevation data across the river in each
station. In preparation for the export of the GIS data
for HEC-RAS modeling, the generated datasets were
initialized including the terrain, centerline of the
stream, cross-section cutlines, cross-section cutline
profiles, bank lines, flow path, and stream profiles.
2.3 Flood Modeling
The previously generated GIS Data in flood model
preprocessing was converted into geometric data with
a metric system of Système international d'unités or
SI. The Manning’s n values were supplied and Cross
Section Point Filter was set in the process to initialize
the roughness value and reduce the elevation data
points that can be processed by HEC-RAS model for
each river station, respectively. For the simulation,
unsteady flow were used in utilising the discharge
data and simulated 5, 25, and 100 Year Rain Return
hypothetical scenarios of the target river. On the other
hand, a friction slope value of 0.001 was set. Once all
the previous parameters were set properly,
computation of unsteady flow simulation followed.
Afterwards, the result of the flood model simulation
was produced. Lastly, generation of a flood
inundation was done.
2.4 Identifying Flood Prone
Communities
The 5, 25, and 100 Year flood inundation maps that
were generated were overlaid to the feature extracted
vector files of Padada floodplain to identify the flood
prone communities. These were done in ArcMap
10.2.2.
3 RESULTS AND DISCUSSION
The digitization of the river digital plot started from
Diversion Bridge (06°40’35.4”N, 125°19’47.9”E).
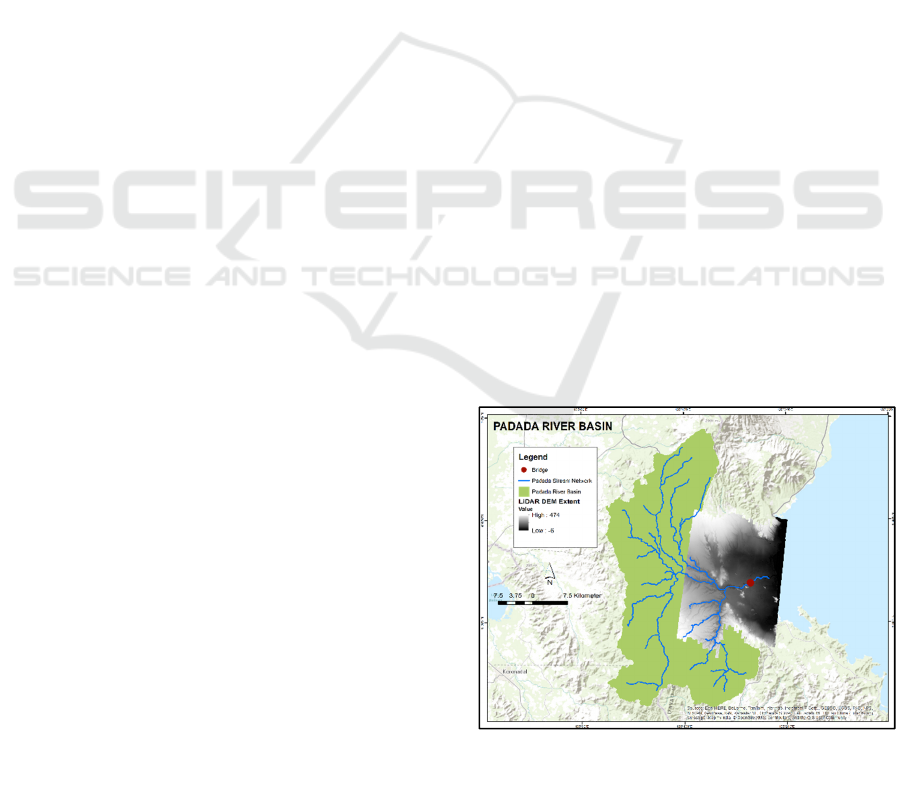
The LiDAR elevation datasets used in preprocessing
the RAS Model has a 1-meter resolution with 20cm
vertical accuracy and is covering the Padada
floodplain as in Figure 3. For the development of the
model, the discharge data used was gathered in the
same bridge with a base flow discharge of 3.35 m
3
/s
and was specifically set as input as the normal flow
of Padada River.
Figure 3: LiDAR Coverage of Padada River floodplain.
Riverbed cross-sections or the XS-Cutlines of the
target watershed are crucial in the setup of HEC-RAS
Flood Modeling using Gis and LiDAR of Padada River in Southeastern Philippines
303
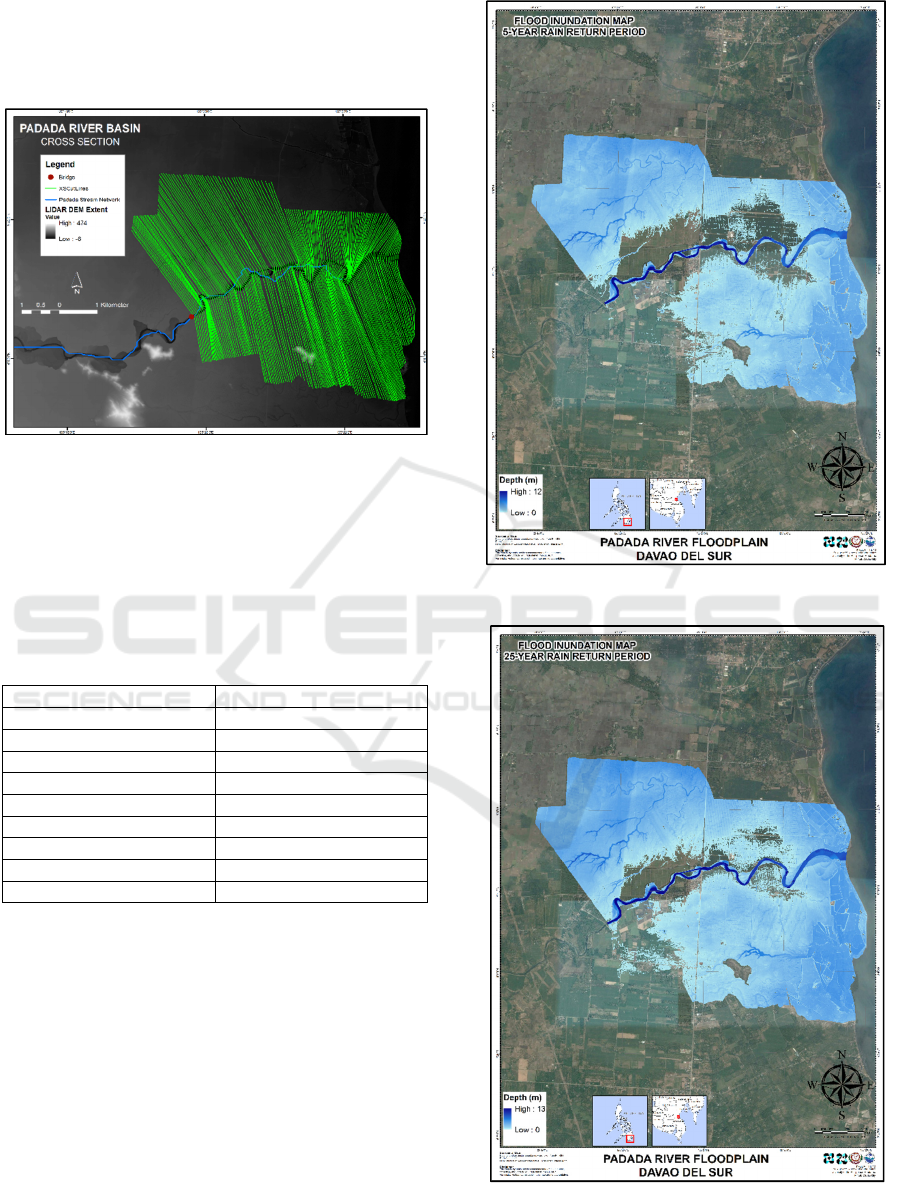
Model. These cross-section data (Figure 4) were
defined using the Arc GeoRAS tool and the
LiDARDEM and were post-processed in ArcMap
10.2.2.
Figure 4: Padada riverbed cross-section data.
The Manning’s n is dependent by the nature of the
channel and surface. It is important to determine the
correct roughness coefficient of the channel to have a
good water flow simulation. The values used were
based on the floodplain’s land cover type and
standardized Manning’s n look-up table (Table 1).
Table 1: Look-up Table for Manning’s n Values.
Land-cover Class Manning’s n
Barren Land 0.030
Built-up Area 0.015
Annual Crop 0.040
Perennial Crop 0.035
Fishpond 0.018
Inland Water 0.030
Grassland 0.030
Mangrove Forest 0.120
Shrub Land 0.100
The HEC-RAS Flood Model produced water level for
every cross-section based on the discharge data that
served as input. Initially, the actual discharge data
were used in running the model to assure good
simulation and afterwards, hypothetical scenarios of
5, 25, and 100 year rain return periods were then used
as the input discharge. Right after running three
simulations, 5, 25, and 100 year rain return flood
inundation maps of Padada floodplain were generated
as shown in Figures 5-7.
Figure 5: Padada Floodplain 5 Year Flood Inundation Map.
Figure 6: Padada Floodplain 25 Year Flood Inundation
Map.
GISTAM 2017 - 3rd International Conference on Geographical Information Systems Theory, Applications and Management
304
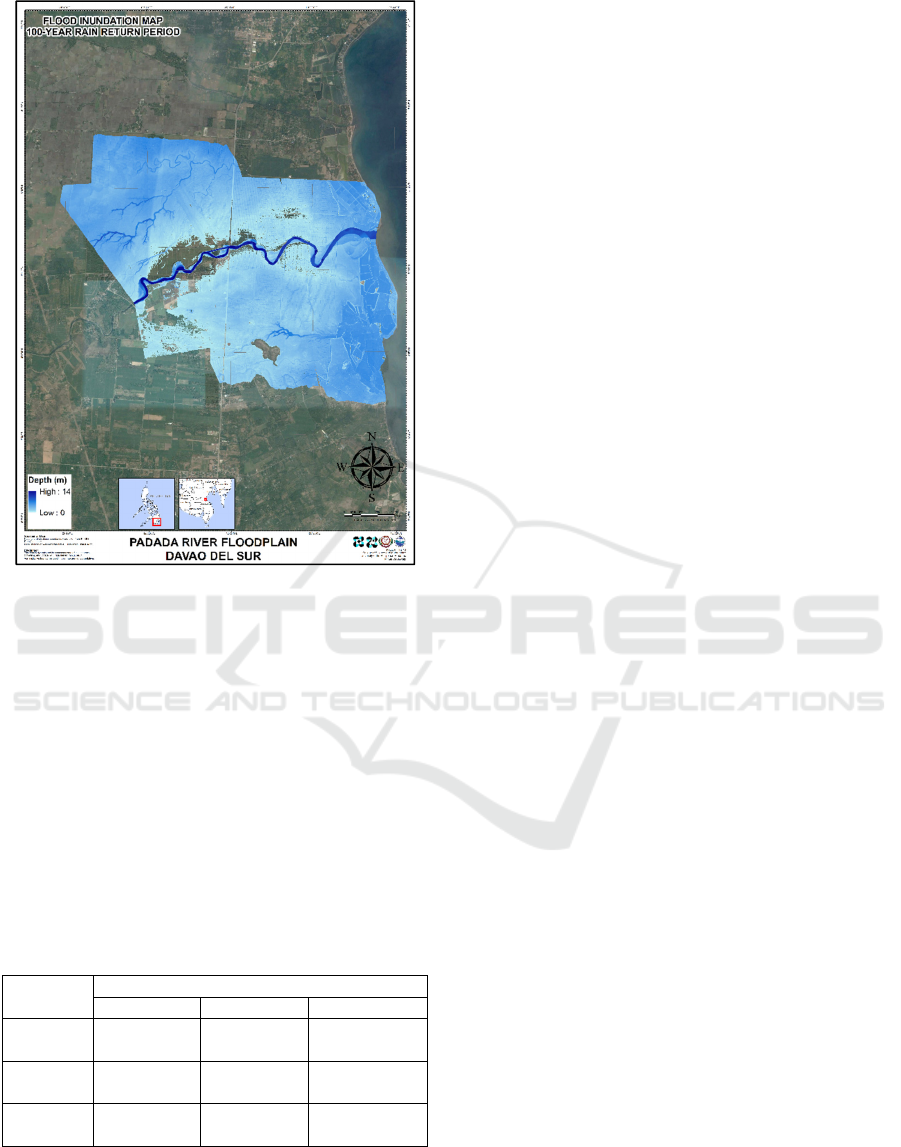
Figure 7: Padada Floodplain 100 Year Flood Inundation
Map.
The generated flood inundation maps, together with
the feature extracted vector files of the floodplain,
were overlaid to identify the number of structures that
will be affected in a given return period. For each
rainfall return period, flood levels were categorized
into low, moderate, and high. Structures affected with
low flood level will experience below 0.5m flood
depth while structures in the moderate level will have
flooding between 0.5m and 1.5m deep. Structures
with high flood level will encounter more than 1.5m
flood depth. The result is shown in Table 2.
Table 2: Number of structures in Padada floodplain that will
be affected during 5, 25, and 100 Year RIDF.
Flood
Level
Number of Structures Affected in:
5-Year 25-Year 100-Year
Low
3,704
Structures
4,977
Structures
5,406
Structures
Moderate
951
Structure
1,800
Structures
2,999
Structures
High
23
Structures
65
Structures
143
Structures
4 CONCLUSIONS
Flood model geometric data preparation and model
parameterization were made through HEC-RAS and
ArcMap extension. The 24-hour 5, 25, and 100
Rainfall Intensity Duration Frequency (RIDF) curves
of Padada river were used as input for the setup of
HEC-RAS model. The HEC-RAS flood model
produced a water level at every cross-section for
every time step and for every flood simulation
created. The resulting model was used in determining
the flooded areas. The model demonstrated change in
the behavior for the three different return periods.
There are two communities that will be affected
resulting from the hypothetical scenarios. A total of
4,678 structures in the floodplain will be flooded in a
5-year rain return period, 6,842 in a 25-year rain
return period, and 8,548 for a100-year rain return
period. The simulated results provided the maximum
flood extent and inundation levels. As a result, the
identification of those flood-prone areas at risk will
help in the information and planning of a more
effective emergency responses. The output of this
study can help the local planning units to forecast and
assess future flood risk for sustainable development.
REFERENCES
General (Philippines): Flood aggravates hunger and poor
health of the villagers in Davao. (2009, February 5)
Retrieved from Asian Human Rights Commission:
http://www.humanrights.asia/news/hunger-alerts/AHR
C-HAG-002-2009/
Hammerling, M., Walczak, N., Walczak, Z., and Zawadzki,
P. “The Possibilities Of Using HEC-RAS Software For
Modelling Hydraulic Conditions Of Water Flow In The
Fish Passexampled By The Pomiłowo Barrage On The
Wieprza River,” Journal of Ecological Engineering,
Vol. 17, No. 2, Apr. 2016, pp. 81–89.
Kim, S., Yoon, B., Kim, D., and Kim, S. “Accuracy
Analysis of HEC-RAS for Unsteady Flow Simulation
considering the Flow Pattern Variations over the Side-
weir of Side-Weir Detention Basin,” in Journal of
Korea Water Resources Association, 2016, vol. 49 no.
1, pp. 29-39.
Siddayao, G., Valdez, S., and Fernandez, P. “Modeling
Flood Risk for an Urban CBD Using AHP and GIS” in
International Journal of Information and Education
Technology, Vol. 5, No. 10, October 2015, pp. 748-
753.
Suarez, J. K. B., Santiago, J. T., Muldong, T. M. M.,
Lagmay, A. M. A., Caro, C. V., and Ramos, M.
“Comparison of High Resolution Topographic Data
Sources (SAR, IfSAR, and LiDAR) for Storm Surge
Flood Modeling using Gis and LiDAR of Padada River in Southeastern Philippines
305

Hazard Maps,” in American Geophysical Union, Fall
Meeting 2014, abstract #ED11B-3405.
Turner, A., Colby, J., Csontos, R., and Batten, M. “Flood
Modeling Using a Synthesis of Multi-Platform LiDAR
Data,” in Water 2013, Vol. 5, No. 4, pp.1533-1560.
Yumul, G., Dimalanta, C., Servando, N., and Cruz, N.
“Abnormal weather events in 2009, increased
precipitation and disastrous impacts in the Philippines,”
Climatic Change June 2013, Vol. 118, No. 3, pp. 715–
727.
Yuan, Y. and Qaiser, K. “Floodplain Modeling in the
Kansas River Basin Using Hydrologic Engineering
Center (HEC) Models” in U.S. Environmental
Protection Agency, National Exposure Research
Laboratory, Environmental Sciences Division,
Landscape Ecology Branch, Las Vegas, NV 89119.
GISTAM 2017 - 3rd International Conference on Geographical Information Systems Theory, Applications and Management
306
