
Optimization for Sustainable Manufacturing
Application of Optimization Techniques to Foster Resource Efficiency
Enrico Ferrera
1
, Riccardo Tisseur
1
, Emanuel Lorenço
2
, E. J. Silva
3
, Antonio J. Baptista
2
,
Gonçalo Cardeal
3
and Paulo Peças
4
1
Istituto Superiore Mario Boella, Via Pier Carlo Boggio 61, Turin, Italy
2
Instituto de Ciência e Inovação em Engenharia Mecânica e Engenharia Industrial,
Rua Dr. Roberto Frias, Campus da FEUP, 400 4200-465, Porto, Portugal
3
Instituto de Soldadura e Qualidade, Avenida do Professor Doutor Cavaco Silva 33, Oeiras, Portugal
4
Instituto Superior Técnico, Universidade de Lisboa, Avenida Rovisco Pais, 1, 1049-001, Lisboa, Portugal
Keywords: Optimisation, Metaheuristics, Resource Efficiency, Sustainability, Industry 4.0.
Abstract: Resource efficiency assessment methods, along with eco-efficiency assessment methods are needed for
various industrial sectors to support sustainable development, decision-making and evaluate efficiency
performance. The combination of eco-efficiency with efficiency assessment allows to identify major
inefficiencies and provides means to foster sustainability, through the efficient and effective material and
energy use. Despite the available information for decision making, this proves to be a difficult task in the
manufacturing industry, therefore, there is a real need to develop and use optimization techniques to enhance
resource efficiency. In this context, and due to the lack of simple and integrated tools to assess and optimize
resource efficiency, crossing the different environmental and economic aspects, arises the need to develop
optimisations models, enabling support and optimize sustainable decision making process and identification
of potential improvements. The optimisation method should provide robust knowledge to support decision-
making, allow comparability of the results and consider a cost-saving approach to help set priorities.
Moreover, the optimisation techniques should centre the process through design/configuration of the
production system, without considering time, in order not to limit the physical agents.
1 INTRODUCTION
Sustainability assessment has become a rapidly
developing topic with a growing number of concepts
and tools being developed during the last decades.
This has been particularly relevant for manufacturing
industries, main consumers of natural resources
(Garetti, 2012). Despite the fact that the concept of
sustainability might be understood intuitively, yet to
evaluate the sustainability of production systems is a
complex task and not intuitive, which led industries
to deviate from these kind of issues. Therefore, an
accurate management of sustainability issues is
proven to be essential to achieve continuous
improvement, and became a fundamental principle
for successful organisations.
Common decision support tools provide the
ability to access the immediate state of the process
and some add the capability of simulating different
configurations. The concept of sustainable
manufacturing comprehends a significant number of
objectives. The most quoted definition is given by the
U.S. Department of Commerce: sustainable
manufacturing is “the creation of manufactured
products that use processes that minimize negative
environmental impacts, conserve energy and natural
resources, are safe for employees, communities, and
consumers and are economically sound” (U.S
Department, 2014).
Thus, maximizing resources and energy
efficiency, reducing environmental and social
impacts and promoting the use of renewable
technologies are all key objectives included in the
concept of sustainable manufacturing (Kersten,
1999). While evaluating these parameters might
appear simple, using them for decision making can be
more difficult, as these objectives must meet
requirements regarding the impacts on employee,
community and especially on the economic aspects
(Kulatunga, 2015). Combining this set of conditions
424
Ferrera, E., Tisseur, R., Lorenço, E., Silva, E., Baptista, A., Cardeal, G. and Peças, P.
Optimization for Sustainable Manufacturing - Application of Optimization Techniques to Foster Resource Efficiency.
DOI: 10.5220/0006374604240430
In Proceedings of the 2nd International Conference on Internet of Things, Big Data and Security (IoTBDS 2017), pages 424-430
ISBN: 978-989-758-245-5
Copyright © 2017 by SCITEPRESS – Science and Technology Publications, Lda. All rights reserved

lead to complex problems. Sustainable decision
support tools and frameworks simplify the
assessment by using a single value to identify the
immediate state of the process and by using carefully
chosen indicators to simplify and compare the
information.
Simulation tools go a step further and add the
possibility to foresee the outcome of possible
improvements in the process. However, the
quantification of those changes can be a difficult
process. Thanks to the indicator based system used in
decision support tools there is a common comparison
element between the immediate assessment and the
simulated scenario. According to (Sproedt 2015), the
major shortcomings regarding the simulation for the
environmental assessment of production systems are
the following:
Product specific allocation of resources is rarely
provided
Materials and direct emissions not considered
No seamless integration of Life Cycle
Assessment (LCA) evaluation
Focus either on environmental or cost evaluation
High efforts for data acquisition and modelling
required
Lack of methodical guidance for application
Level of detail not sufficiently scalable
Yet, advances towards industry 4.0 and total
control of manufacturing systems, will lead to a
significant increase of available information. Industry
4.0 leverages on the concept of Internet-of-Things
(IoT), which incorporates machine learning and big
data technology, exploiting the sensor data, machine-
to-machine (M2M) communication and automation
technologies that have existed in industrial settings
for years. Smart systems are better than humans in
capturing and communicating data. This data can
enable companies to detect inefficiencies and
problems earlier, saving time and money and
optimizing business intelligence efforts. This would
be overwhelming without proper tools to assist the
treatment of that data. Decision support tools and
frameworks assist in simplifying the problem
identification process and the comparison of different
alternatives.
1.1 Objectives
The goal of this paper is to present an approach to
improve the overall sustainability of manufacturing
through the simulation and optimisation of resource
efficiency and eco-efficiency performance.
The eco-efficiency assessment through simulation
is a support to better understand the influence of any
process parameter on the production system
performance. This can be done by the solver, which
introduces changes regarding the process parameters
quantitative amount, and assessing the influence of
these changes on the production system efficiency
and/or eco-efficiency performance. As a
consequence, participants are able to identify and
select process parameters that should be targeted for
the identification of improvement actions. Moreover,
the solver will support the identification of the
optimal scenario.
2 BACKGROUND
2.1 Efficiency Framework
The proposed Efficiency Framework, developed
under the H2020 SPIRE Project MAESTRI, consists
in the integration of two methodologies, namely eco-
efficiency and efficiency assessment methods and
Information and Communication Technology (ICT)
tools. The eco-efficiency method is oriented for the
evaluation and assessment of eco-efficiency
performance, while the lean based efficiency method,
is to assess overall efficiency performance.
The eco-efficiency approach, here considered,
aims to promote continuous improvement and a more
efficient use of resources and energy, by providing a
set of indicators easy to understand/analyse. The goal
is to assess eco-efficiency performance in order to
support decision making and enable the maximization
of product/processes value creation while minimizing
environmental burdens. Therefore, the use of the eco-
efficiency approach, which base concept is to
measure the environmental and economic aspects of
activities as sustainability aspects that evidence, for
instance, more value from lower inputs of material
and energy (Baptista 2016). The common expression
for eco-efficiency is the ratio between value and
environmental influence (see equation 1).
Eco-Efficiency=
Production or Service Value
Environmental Influence
(1)
The resource efficiency assessment methodology,
takes into account the base design elements from the
Value Stream Mapping. Namely, by considering the
value streams, in order to identify and quantify, at
each stage of the process system, the "value added"
(VA) and "non-value added" (NVA) actions, i.e. all
types of waste and inefficiencies along the production
system (Lourenço 2013). Therefore, the basic
principle relates to Lean Principles via clear
definition between value and waste (in the Lean
Optimization for Sustainable Manufacturing - Application of Optimization Techniques to Foster Resource Efficiency
425
Principles context). The goal is to assess the overall
performance, by taking into account the efficiency of
each process parameter/variable (e.g. time, energy,
water, raw material) associated to one or more
processing units. Consequently, the approach will
provide an efficiency analysis (see equation 2), which
supports the decision making process and helps
prioritize the implementation of improvement actions
by identifying inefficiencies in a very direct manner.
Efficiency=
ValueaddedVA
ValueaddedVANon‐valueaddedNVA
(2)
The outline of the Efficiency Framework, consists
in the integration of eco-efficiency and efficiency
methods through the mutual exchange of information,
which corresponds to the central objective of the
Efficiency Framework. Such integration strategy
enables to obtain, besides the efficiency and eco-
efficiency stand-alone, results to support decisions
and new integrated results, namely the Total
Efficiency Index (TEI) - obtained by combining
normalized eco-efficiency results with efficiency
results.
Regarding TEI, this index is calculated for each
processing unit of the production system under
analysis. In quantitative terms, the TEI is obtained by
multiplying the normalized eco-efficiency and the
efficiency assessment results. The logic behind this
index is to combine two fundamental efficiency
aspects, namely eco-efficiency, which considers the
ecology and economy aspects, and resource and
operational efficiency, which considers the NVA and
VA activities aligned with the Lean Principles from
Multi-layer Stream Mapping (MSM). Consequently,
TEI main outcome relates with providing the ability
of evaluating if eco-efficiency performance variation
is due to higher or lower environmental influence, or
due to higher or lower economic value.
In practice, this results from the distribution
variance of TEI results that occur on two major axes:
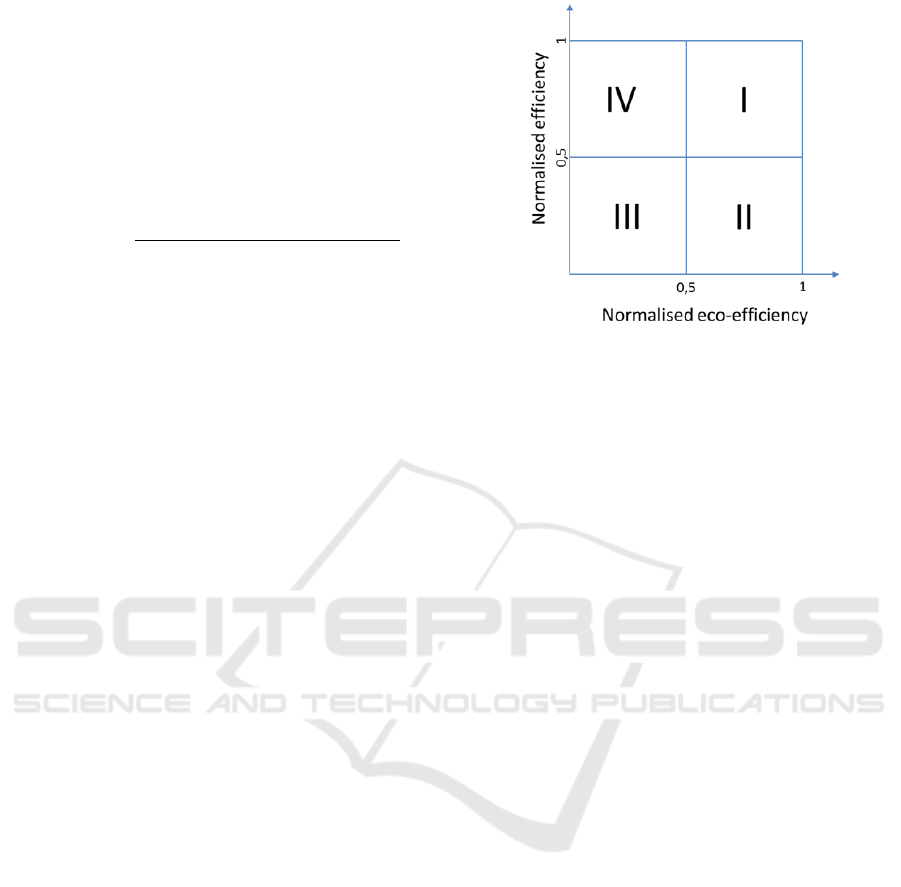
the efficiency and eco-efficiency. This distribution is
presented in a graphical way in Figure 1. The main
characteristics and insights related to the TEI results
distribution is:
Quadrant I - High efficiency and eco-
efficiency performance.
Quadrant II - Low efficiency and High
eco-efficiency performance.
Quadrant III - Low efficiency and eco-
efficiency performance.
Quadrant IV - High efficiency and low
eco-efficiency performance.
Figure 1: Theoretical distribution of TEI values.
2.2 Optimisation Problem
Problem arising in the industrial decision making
process are a trade-off of conflicting objectives, e.g.
identify which technology or processes sequence
provides highest eco-efficiency and efficiency ratios,
or identify the resource efficiency, environmental
influence and costs of, for instance, different
materials in order to identify the one that enables
higher TEI. This kind of problem is commonly named
Multi-objective Optimization Problem (MOP) and
are mathematically represented by
min
̅
(3)
where ̅ is the array of process variable that influence
the decision and
̅
represents the set of
objective function taken into account.
MOP problem does not have a single solution but
provide a set of solutions, named Pareto front, where
different set of ̅ have the same
. Therefore, is not
possible to have a global optimum but only near
optimum solution are possible.
One way of representing
̅
is the weighted
sum approach that is a linear relation of the single
objective functions as follows:
̅
̅
(4)
where
̅
is the i-th objective function and
is the weight associated to
. The single
objective function is a relation between the process
variable/parameters that can be controlled by the user
and one of the objective. This relation can be of
different form:
Analytic - a mathematical representation of
is available or can be retrieve through
regression models.
IoTBDS 2017 - 2nd International Conference on Internet of Things, Big Data and Security
426
Black box - the system is too complex to be
analytically modelled so the a
.is
established through the use of trained
machine learning algorithm.
Many problem arising in this context are
NonPolynomial-hard, meaning that they cannot be
solved optimally in polynomial time. To solve large
instances of this kind of problem the use of heuristic
algorithm can provide approximate optimal solutions.
They use some kind of knowledge in order to provide
problem specific rules to explore the solution space,
e.g. k-exchange neighbourhoods local search
algorithm (Lin, 1973) (Helsgaun, 2000). A derived
form of heuristic algorithm are the metaheuristic ones
where a general applicable algorithm concept is used
to define a heuristic method, e.g. Simulated
Annealing (Kirkpatrick, 1984), Genetic Algorithm
(Deb, 2002), Tabu Search, Particle Swarm (Shi,
2001) and Ant Colony (Dorigo, 2004).
Ant Colony Optimization (ACO) is a family of
algorithm inspired by ants’ behaviour and their way
of communication when searching from food which
allows them to find the shortest way between the
colony and the food source.
Genetic Algorithm (GA) are inspired by the
natural evolution process of a population. Each
individual correspond to a point in the solution space
and undergo to an evolution process. Individuals that
have better results produce more offspring than others
and genes from good individuals contribute to the
generation of improved solution. Random mutation in
the evolution process allow the algorithm to explore
the solution space.
Figure 2: Optimization Module Architecture.
2.3 Use Case Example
The reference example used in the project to develop
the efficiency framework and optimization module
concept is the injection moulding. This production
process is characterized by a variety of materials,
shape and sizes that can be used by the same machine
to produce from simple to complex products.
The use case example will consider the following
variables:
Cycle time measurement,
Energy consumption per cycle,
Material consumption per cycle,
Parts produced per cycle,
Number of Not-OK (NOK) parts per cycle.
The use case example considers that company
established goals to continuously increase
sustainability and resource efficiency. In order to
assess efficiency and eco-efficiency performance
based on energy consumption, material consumption
and other key variables, like cycle-time. The use case
considers that all necessary data on resources and
materials costs, energy costs, as well as other cost
factors related to process operation (machine
operating costs, labour costs, parts selling price, etc.)
can be retrieved via the IoT Platform, to enable
calculation of eco-efficiency related Key
Performance Indicators (KPIs).
The goal here is to better understand and optimise
the interdependencies between process stages, both
from technical and economic perspectives. For this
reason, it is necessary to optimize energy and material
consumption, in a manner that does not affect process
productivity by creating problems on the other
upstream and downstream process stages.
3 PROPOSED SOLUTION
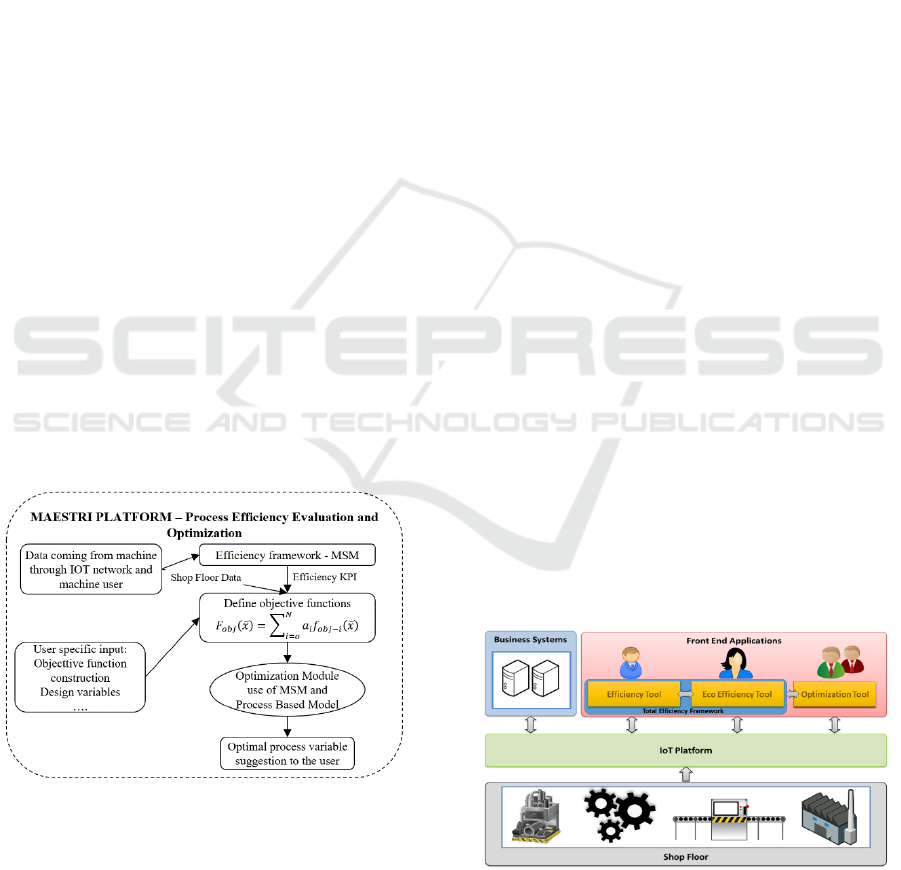
Figure 2 shows the proposed methodology that will
be implemented in the MAESTRI platform to support
the decision making process in order to optimize the
environmental impact and the overall efficiency.
Figure 3 shows the MAESTRI platform architecture.
Figure 3: MAESTRI platform architecture.
The central element is an IoT platform, which
facilitates the data transfer from machines, systems,
Optimization for Sustainable Manufacturing - Application of Optimization Techniques to Foster Resource Efficiency
427

and sensors at shop floor to end user software tools
and applications at the industrial sites. Data coming
from the IoT Platform and eco-efficiency KPI are
used by the platform user to design specific objective
function. The IoT Platform provides interoperable
interconnection of appliances, devices, terminals,
subsystems, and services. The platform has been
designed according to the service-oriented
architecture (SoA) approach where services are
provided to the other components by loosely-coupled
application components.
Each of the functional submodules of the
architecture is explained in the following. The Shop
Floor will usually be the place where the major part
of the relevant data is being produced, e.g. material
consumption in injection moulding machine. Device
Connectors (DC) provide the means for devices to
communicate with the rest of the framework
regardless of the communication protocol it uses.
DCs need to be developed specifically for each new
device or protocol. Business Systems are the second
type of data source. Enterprise Resource Planning
(ERP) and Manufacturing Execution System (MES)
systems can be connected to the IoT Platform in order
to complement the data from shop floor. Frontend
Applications represent all the end user software tools
and services, which are the main data consumers from
the point of view of the IoT Platform. These include
mainly tools for eco-efficiency and process
efficiency, which allow the overall assessment
providing relevant KPIs. The optimization tool then
finds the optimal solution, based on defined objective
function and process based model, see section 3.1,
with the result of optimizing the KPIs.
3.1 Modelling of the Process
The process modelling allows the optimization
algorithms to iterate the influence of the design
variables in the response function. Most of those
relationships representing the influence of those
variables are linear or can be simplified as linear (e.g.
production rate vs. material consumption, parts per
cycle vs cycle time per part, etc.). Nevertheless, the
complexity increases when several linear correlations
influencing the same process performance output are
analysed simultaneously. One powerful approach is
recommended to deal with this complexity – the
process-based models (PBM) (Peças, 2013). The
PBM comprises mathematical relations that bridge
the design choices and the resources inventory from
where the costs, environmental impact and value are
calculated. PBM is composed by a process model and
by an operations model. In the process model the
relation between process variables and performance
output are established and programmed. In the
operations model the production context is defined,
like number/type of machines, production time,
operators use rate, etc. The PBM outputs are, in
general, the time required to produce the parts, the
material, energy and consumables consumed, as well
as the number of tools, number of machine and other
resources required (if applicable).
The aim of the intended analysis to be performed
influences the PBM design (its extension in number
of variables and outputs). Therefore, the eco-
efficiency KPIs aimed to be accessed (optimized)
should be defined in this phase. There are some
almost obvious KPIs like the ratio between the
product added-value and total environmental impact,
parts produced and energy consumed or tool/system
duration (in shots or parts produced during its life
cycle) and its life cycle environmental influence
(LCA results). For each specific analysis particular
KPIs should be defined and the PBM must be
designed to allow the output of time and resources
consumed figures required for the KPIs calculations.
Aiming to optimize a set of KPIs at the same time is
not a simple task, since for the same process variables
variation each KPI will vary in a distinct way, so
metaheuristics methods abilities allow the
identification of the most proper variable setting that
maximizes performance.
3.2 Optimization Module
The process based model approach defined in the
previous section can describe a relation between the
input process variable ̅ and the resulting process
behaviour. With this and the tools implemented in the
efficiency framework we can extract the TEI and
other KPI that measure the ECO-efficiency of the
process.
Figure 4 represents the optimization approach
applied to the efficiency framework concepts. After
the definition of the objective function composition
that can be personalized following the specific project
under study the optimization algorithm defines a new
set of possible solution following its own
characteristic strategy. The new set of solutions is
evaluated through
̅
and if the value is minor
than a user defined value the solution is accepted
otherwise a new iteration of the optimization
algorithm is run to find a new set of solutions. If the
number of iteration is higher than a predefined
maximum number defined by the user, the best
solutions founded until that iteration are given to the
user.
IoTBDS 2017 - 2nd International Conference on Internet of Things, Big Data and Security
428
Figure 4: Optimization algorithm application schema.
In industrial process the number of parameters to
be controlled can be very high so the selected
optimization algorithm must be able to deal with a lot
of input and to find the best solution of multiple
objectives. In this application context metaheuristic
algorithm, see section 2.2, are widely use (Satadru,
2015). The major drawback of metaheuristic
algorithm is the fine tuning of the algorithm
parameters to the specific problem but specific
algorithm can be used to partially overcome this issue
(Eiben, 2011).
The combination of different techniques, like
Artificial Neural Network (ANN) and GA (Shen,
2007), is named Hybrid approach and can give good
results especially in presence of non-linear
relationship between the process parameter and the
objective function.
Figure 5 shows the hybrid approach using ANN
to simulate the process behaviour. The ANN must be
trained during an initial phase and can be used in the
iteration process to simulate the process. ANN can
also be trained through simulation, that are time
consuming, and continuously trained during the
iterations, see (Shen, 2007). An example of
application is the relation between the energy
consumption and the process design variable. The
black box approach through the use of ANN suite this
kind of application due to the non-linear nature and
difficulties in the evaluation with standard
approaches.
3.3 Decision Support Capabilities
The connection of a highly integrated framework for
both eco-efficiency and operations efficiency
assessment, the MAESTRI Efficiency Framework,
with a suitable optimization module and algorithms
opens new vast opportunities towards providing
solutions to complex problems in sustainability
domain namely in industrial companies. Indeed, the
capabilities of such rich methods and associated tools
as the Efficiency Framework, besides their potential
to individual analysis “what if improved scenarios
creation” or even online monitoring, can become of
more impact in the improvement strategies and
deployment with the support of the adequate
optimization technics. Providing only a selection of
best available solutions the MAESTRI platform will
help the user in the results selection and avoid wrong
choices.
Figure 5: Optimization approach using ANN hybrid
technique.
4 CONCLUSIONS
This work presents a first preposition towards an
effective connection between a high level
sustainability oriented tool, the Efficiency
Framework, with the potential usefulness and
industrial impact of a suitable optimization scheme.
These connected tools will allow deeper analysis
Optimization for Sustainable Manufacturing - Application of Optimization Techniques to Foster Resource Efficiency
429

towards the optimization of resource efficiency,
crossing the different environmental and economic
aspects, enabling support and optimize sustainable
decision making process and identification and
quantification of potential improvements in the
industrial processes. For that result, the optimisation
methods should provide robust knowledge to support
decision-making, allow comparability of the results
and consider a cost-saving approach to help set
priorities. Moreover, the optimisation techniques
should centre the process through
design/configuration of the production system,
without considering time, in order not to limit the
physical agents. The optimization task is enabled and
facilitated leveraging a SOA IoT platform which
provides services for efficiency and eco-efficiency
assessment other than optimization.
ACKNOWLEDGEMENTS
This work was supported by the European Union’s
Horizon 2020 research and innovation program
through the MAESTRI project (grant n° 680570).
REFERENCES
Garetti, M. and Taisch, M. 2012. Sustainable
manufacturing: trends and research challenges.
Production Planning & Control 23.2-3: 83-104.
U.S. Department of Commerce 2014. “How does
Commerce define Sustainable Manufacturing?”
International Trade Administration.
Kersten, G. E.; Mikolajuk, Z., and Yeh, A. G. 1999,
“Decision Support Systems for Sustainable
Development” Kluwer Academic Publishers. ISBN: 0-
88936-906-2.
Kulatungaa, A.K., Karunatilakeb N., Weerasinghea N.,
Ihalawattaa R. K., 2015. Sustainable Manufacturing
based Decision Support model for Product Design and
Development Process, Procedia CIRP - The 12th CIRP
Conference on Sustainable Manufacturing, Volume 26,
Pages 87 – 92.
Sproedt, A., Plehn, J., Schönsleben, P., & Herrmann, C.
2015. A simulation-based decision support for eco-
efficiency improvements in production systems.
Journal of Cleaner Production, 105, 389-405.
A.J. Baptista, E.J. Lourenço, J.P. Pereira, F. Cunha, E.J.
Silva, P. Peças. 2016. ecoPROSYS: An Eco-Efficiency
Framework Applied to a Medium Density Fiberboard
Finishing Line, Procedia CIRP, Volume 48, Pages 170-
175, ISSN 2212-8271.
Lourenço, E. J., Baptista, A. J., Pereira, J. P., Dias-Ferreira,
C. 2013. Multi-Layer Stream Mapping as a Combined
Approach for Industrial Processes Eco-Efficiency
Assessment. In: Re-engineering Manufacturing for
Sustainability: 427-433.
Lin, Shen, and Brian W. Kernighan. 1973. An effective
heuristic algorithm for the traveling-salesman problem.
Operations research 21.2: 498-516.
Helsgaun, Keld. 2000. An effective implementation of the
Lin–Kernighan traveling salesman heuristic. European
Journal of Operational Research, 126.1: 106-130.
Kirkpatrick, Scott. 1984. Optimization by simulated
annealing: Quantitative studies. Journal of statistical
physics 34.5-6: 975-986.
Deb, Kalyanmoy, et al., 2002. A fast and elitist multi-
objective genetic algorithm: NSGA-II. IEEE
transactions on evolutionary computation 6.2: 182-197.
Shi, Yuhui. 2001. Particle swarm optimization:
developments, applications and resources."
evolutionary computation. Proceedings of the 2001
Congress on. Vol. 1. IEEE.
M. Dorigo and T. Stuzle, 2004. Ant Colony Optimization,
A Bradford Book.
P. Peças, I. Ribeiro, A. Silva, E. Henriques. 2013.
Comprehensive approach for informed life cycle-based
materials selection, Mater. Des. 43 220–232.
K. Satadru, and Dilip Datta. 2015. Process parameter
optimization of plastic injection moulding: a review.
International Journal of Plastics Technology 19.1: 1-
18.
Shen, Changyu, Lixia Wang, and Qian Li. 2007.
Optimization of injection moulding process parameters
using combination of artificial neural network and
genetic algorithm method. Journal of Materials
Processing Technology 183.2: 412-418.
Eiben, Agoston E., and Selmar K. Smit. 2011. Parameter
tuning for configuring and analysing evolutionary
algorithms." Swarm and Evolutionary Computation
1.1: 19-31.
Zhao, Jian, et al. 2015. Multi-objective optimization design
of injection moulding process parameters based on the
improved efficient global optimization algorithm and
non-dominated sorting-based genetic algorithm. The
International Journal of Advanced Manufacturing
Technology 78.9-12: 1813-1826.
IoTBDS 2017 - 2nd International Conference on Internet of Things, Big Data and Security
430
