
Design and Implementation of Human Mobility Embedded System
for Urban Planning of Smart City
Anwar Al-Khateeb
Politecnico di Milano, Dipartimento di Elettronica, Informazione e Bioingegneria,
Piazza Leonardo da Vinci, 32, 20133, Milano, Italy
Keywords: Human Mobility, Smart City, Urban Planning, Embedded System, Optimization.
Abstract: The mobility model will help us to simulate the movements of people more realistic as in real case. This
paper developed human mobility system using random way point and random walk methods to model the
individual movement of person in different places within area of Baghdad, Iraq. There are a lot of types of
mobility model but we use Random Way Point (RWP) because it is simple, most common use and needs
less memory and time for computation. The geographical information and maps of the cities are used to tell
the person about the constraints and correct the direction of motion in different areas to generate more
accurate data. Tested areas are quite different in style, structure, social, history and culture. The most similar
thing between them is that they are both in continuously changing which is the one of biggest difficulties in
designing the city. Al-Sadar city is one of biggest population city in Baghdad, Iraq. It has three millions
people population. We choose 5000 users moves from Al-Sadar city to two different places in Baghdad: Al-
Khadmia and Al-Zawra. Al-Khadmiia is old and religion place and Al-Zawra is biggest public garden in
Baghdad. In our work, we find the best ways that connect Al-Sadar city with both places. We decide the
best ways depending on distances and traffic between them. It gives good method to build smart
transportation and smart city using mobility and traffic models. .This paper will help urban decision maker
to suggest the analytical model for urban space and have a clear picture about the city: how can it change,
how do the people move in the city, what are the problems and how can solve them to generate smart city.
1 INTRODUCTION
The smart cities market size is estimated to grow
from USD 312.03 Billion in 2015 to USD 757.74
Billion by 2020, at a Compound Annual Growth
Rate (CAGR) of 19.4%. The base year considered
for the study is 2014 and the market size is
forecasted from 2015 to 2020.
Smart cities market has been segmented into four
major focus areas across regions (Vicente Casares-
Giner et al., 2011; Ignacio Martinez-Arrue et al.,
2008). The focus areas include transportation,
utilities, buildings, and smart citizen services.
Technological advancements in Information and
Communication Technology (ICT) and growing
demographics & hyper-urbanization are the major
driving factors for the market. Cities across the
world are increasingly adopting smart solutions for
their various sectors, such as buildings,
transportation, utilities, and citizen services in order
to achieve better living standards, increased
efficiency, economic stability, optimization of
energy, and higher environmental protection based
on the technologies: IoT, cloud, mobile, and sensors.
Estimates forecast the smart energy technologies
market (including smart grid) reaching $220 billion
worldwide by 2020, whilst other sources estimate
smart transport to be $156 billion, and smart water
to be $22 billion globally by 2020 (Mir et al., 2006;
Tamás Szálka et al., 2009). The example of
Singapore next generation smart city. Singapore
aims to have 80% of all its buildings meet its
minimum ‘Green Mark Certified' energy efficiency
standards by 2030. We identified eight key aspects
that define a Smart City: smart governance, smart
energy, smart building, smart mobility, smart
infrastructure, smart technology, smart healthcare
and smart citizen.
Geographic information systems, often known as
GIS, are computer-based tools for the capture,
analysis, storage, manipulation and visualization of
geographic information. Companies, researchers and
individuals use GIS to analyze spatial data and
Al-Khateeb, A.
Design and Implementation of Human Mobility Embedded System for Urban Planning of Smart City.
DOI: 10.5220/0006374103370345
In Proceedings of the 6th International Conference on Smart Cities and Green ICT Systems (SMARTGREENS 2017), pages 337-345
ISBN: 978-989-758-241-7
Copyright © 2017 by SCITEPRESS – Science and Technology Publications, Lda. All rights reserved
337

create maps of many different types. GIS-created
maps can store and display large amounts of data
within a single map (Yu-Liang Tang et al., 2010;
Son et al., 2004; Tamás Szálka et al., 2009; Peppino
Fazio et al., 2012).
According to the Environmental Protection
Agency, a GIS, which refers to Geographic
Information System, works by combining database
functions with computer mapping to map and
analyses geographic data. It uses a "layering"
technique to combine various types of data. Special
GIS software is used to analyse layered data and
create new layers of data (Broch et al., 1998;
Francesco Calabrese et al., 2010; Heiko Bauke et al.,
2007).
GIS maps can be used to show an estimated
number of people living in a given region. Because
these maps are created after careful considerations of
various data, the results are usually quite accurate.
These maps can be quite specific and show the
number of individuals in a region according to
profession. Users can actually tell the number of
doctors, lawyers or policemen in a region by simply
going through a GIS map (Injong Rhee et al., 2011;
Jae-Hyung Jeon et al., 2013).
GIS maps are capable of giving users a rough
idea of each region on the map and what it is prone
to. For example, a map can depict flood-prone
regions against the landmarks situated close by.
Researchers use these maps to analyze the
characteristics of a given region over a period. This
help in developing strategies to combat issues such
as crime, flooding and any other form of disaster
(Chellappa Doss et al., 2004; Berk Birand et al.,
2011; Matteo Leccardi, 2005).
Disadvantages of using a geographic information
system, or GIS, are that its technical nature might
portray results as being more reliable than they
actually are, and errors and assumptions can be
hidden, leading to a lack of questioning into the
results. Another disadvantage of analyzing the
results from a GIS is that the results will only be as
accurate as the data that they come from. Because of
this, the data may not be able to serve different
contexts, particularly if the data is not applicable
(Francesco Calabrese et al., 2010; Matteo Leccardi,
2005).
For instance, if the input data on a GIS is entered
at the county level, the results in the GIS will only
be usable for the county level, not any other level,
such as the district or ward levels. Data availability,
in itself, is also a major issue. If the data is not
available, than the GIS system is useless.
Furthermore, GIS systems are not like other
programs. They do not come "off the shelf," which
means that they must be assembled and constructed
to a user design. This could be a long, complex and
costly process. Because of this, many GIS systems
don't come to fruition or fail outright in their
implementation because their creation was rushed or
inadequately planned (R. Chellappa Doss et al.,
2004; Jae-Hyung Jeon et al., 2013).
GIS systems are often so complex, in fact, that it
becomes difficult to describe the intangible benefits
they may provide, making it difficult to find funding
for their creation. Also, the technology behind GIS
technology expands rapidly, causing GIS systems to
have a high rate of obsolescence. It's also very
difficult to make GIS programs that are both fast and
user friendly. GIS systems typically require complex
command language (Chellappa Doss et al., 2004;
Broch et al., 1998). Data fields and their
accessibility are also not very understood, and data
can become incomplete, obsolete or erroneous,
rendering the GIS misleading.
In this paper, we introduced the mobility model
which help us to simulate the movement of users
with more realistic as in the real case. There are a lot
of types of mobility model depending on the
characteristics of nodes such as historical model,
correlated model and geographical depending. Each
method has its advantages and disadvantages. In our
work we use random way point method (RWP). It is
simple; most common used in mobile networks and
needs less memory and time for computation. It fits
our requirements. Also we use random walk method.
It is more realistic and near to human walk.
But the goal for our system is to find the location
of users and decide the best way that can be used.
Therefore we need also to predict the position of
users. We use Polynomial method as a predicted
method. It gives accurate and fast prediction of user
position.
Beside the individual movement of user, we use
the relative movements (within the area). We used
geographical mobility depending using map from
openstreet program and parsed the geographical
constraints using Matlab (ways, nodes and tags) to
present the required area.
Using the mobility model is very useful to
decide the way taken by user and improve it. It helps
the city planner to have correct decision depending
on the data given from mobility model. It is one step
to model smart city with enhanced transportation
and improved the ways taken by users.
Using mobility model is much easier and
accurate compared with GIS. It is more realistic and
near to human walk. Also it takes into account the
SMARTGREENS 2017 - 6th International Conference on Smart Cities and Green ICT Systems
338

nature of the tested area by adding geographical
mobility to the original mobility model.
In this paper, we show in section 2 the previous
works for mobility and prediction. Sections 3 and 4
study the mobility algorithms. They give the
mathematical models of RWP, random walk and
Polynomial methods. They explain the principles
and algorithms details of mobility and prediction
methods. The simulation results and figures are
shown in Section 5. We use Matlab and openstreet
map for Al-Sadar city in Baghdad, Iraq to simulate
mobility, prediction and urban planning
management algorithms. The mobility tested areas
include: Al-Khadmid and Al-Zawar. They are both
in centre of Baghdad, Iraq. The best ways between
these places and Al-Sadar city was founded using
mobility and traffic models. Finally the conclusion
and suggestion for future works is in section 6.
2 RELATED WORK
In (Ignacio Martinez-Arrue et al., 2008) a new
model to predict the location of a person over time
based on individual and collective behaviours. The
model is based on the person’s past trajectory and
the geographical features of the area where the
collectively data are organized in terms of land use,
points of interests and distance of trips.
The mobility aspects and some basic background
on mobility are provided in (Son et al., 2004). They
are being used in performance evaluation of relevant
mobility management procedures. While in (Mir et
al., 2006; Heiko Bauke, 2007) the same group
proposed a new mobility model as an extension of
the random walk model. It gathers mobility patterns
with several degrees of randomness, so that both
random walk and totally directional mobility
patterns are modelled. This model is used as input to
study and compare the location management cost of
the distance-based and movement-based strategies as
a function of the mobile terminal directional
mobility patterns.
In (Tamás Szálka, 2009; Matteo Leccardi, 2005)
authors proposed a mobility prediction algorithm
based on dividing sensitive ranges. In the future
distance prediction scheme proposed in (Peppino
Fazio et al., 2012; R. Chellappa Doss et al., 2004), a
node predicts its own future position from its current
position, speed, and direction.
Tuduce and Gross in (Matteo Leccardi, 2005)
present a mobility model based on real data from the
campus wireless LAN at ETH in Zurich. They used
a simulation area divided into squares and derive the
probability of transitions between adjacent squares
from the data of the access points.
MoVes (Berk Birand et al., 2001; Injong Rhee et
al., 2011) is an embedded system generating
vehicular mobility traces and also containing a basic
network simulator. The major asset of this project is
its ability to partition the geographical area into
clusters and parallelize and distribute the processing
of the tasks from them, which improves the
simulation performance. Although the mobility
model reaches a sufficient level of detail, the
project’s drawback is the poor network simulation.
MOVE (Injong Rhee et al., 2011) contains a
single graphical user interface for the configuration
the mobility modelling and network simulation.
However, MOVE does not itself include a network
simulator, but simply parses realistic mobility traces
extracted from a micro-motion model.
In (Mir et al., 2006), authors also proposed an
integrated vehicular and network simulator. As all
solutions proposed by this approach, the authors
developed their own traffic and network simulator.
In (Ignacio Martinez-Arrue et al., 2008;
Francesco Calabrese et al., 2010) the City Form Lab
has released a state-of-the-art toolbox for urban
network analysis. As the first of its kind, the
Centrality Tools this ArcGIS toolbox can be used to
compute five types of graph analysis measures on
spatial networks: Reach; Gravity; Betweenness;
Closeness; and Straightness. Redundancy Tools
additionally calculate the Redundancy Index,
Redundant Paths, and the Wayfinding Index. The
toolbox requires ArcGIS software with an ArcGIS
Network Analyst Extension.
3 INTRODUCTION FOR
MOBILITY MODEL
In this section we give the definition of mobility
pattern, types, analysis and effect on the
performance of the network. Studying mobility
models will help us to choose the best model that
can fit with our requirements. For example, the
nodes move with random walks are different from
the nodes with spatial dependency (move in group or
follow leader of group).
In our work, we use the movement of individual
users (location, velocity, direction) as well as the
movement relative to given area.
The mobility models are divided into different
classes. They are classified depending on their
characteristics such as history dependence, spatial
Design and Implementation of Human Mobility Embedded System for Urban Planning of Smart City
339
dependence and geographical dependence (Matteo
Leccardi, 2005; Jae-Hyung Jeonet al., 2013).
Random walks are example of history
dependence where the nodes change their speed,
destination and direction randomly in each step. In
temporal mobility model the velocities and
directions of nodes at different slots are correlated
such as Gauss-Markov Mobility Model. While the
streets, freeways and geographical restrictions are
important in designing the path mobility model
In our work, we use Random Way Point (RWP)
and geographical restriction model. RWP is most
common way used in different networks. It was first
proposed by Johnson and Maltz (Francesco
Calabrese et al., 2010). In simulation of RWP, the
nodes start by choosing the starting point and
velocity randomly.
The velocity is uniform distribution with ranges
[0, Vmax] where Vmax is maximum velocity
allowable by node. The velocities and targets points
for given node are not correlated with other nodes. If
Vmax is high then the node will move fast and
mobility will be dynamic otherwise it will be stable.
The average length of transition of all nodes is equal
to the average length of single node at different
times. Therefore RWP has mean-ergodic properties.
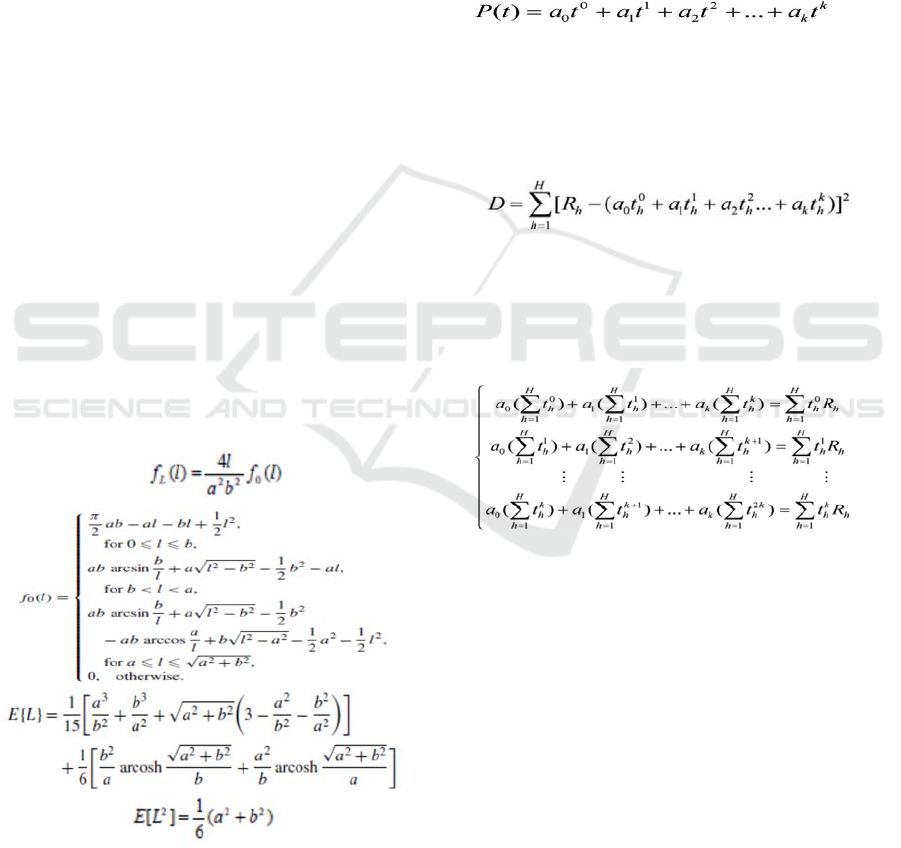
The PDF of transition length for rectangular field
(as in our case) is Eq. (1). A rectangular area with
length a and width b. Without losing the generality,
we assume that b≤ a. The mean and variance of
transition length L are given in Eqs. (2-3)
respectively (Jae-Hyung Jeon et al., 2013).
(1)
(2)
(3)
The expected time transition between two successive
steps is:
E[T]=(E[L].(ln(Vmax/Vmin)))/(Vmax-Vmin)
RWP is memoryless process because each node does
not correlate with other node. In our case we choose
RWP because it is simple and fit the requirements
for not correlated users move on map in random way
with velocities of range [Vmin Vmax].
4 POLYNOMIAL PREDICTION
ALGORITHM
If P(.) is a polynomial function with k + 1 unknown
coefficients as follows:
(4)
The previous location data at H-times compose an
original data sequence S(p) where (p = 1, 2, …, H).
If R
h
is the location of the previous h-th process,
the sum of the square of the difference between
actual R
h
and predictive P(t) of the previous n
processes is defined as
(5)
Each a
i
in each polynomial can be treated as a
variable. The coefficient a
i
can be determined by
taking the partial differential of each a
i
in equation
(5), and setting each partial differential equation to
zero. At the end, we can obtain the following
equivalent polynomials:
(6)
After determining all the summations of t in equation
(6), this matrix of polynomials can simplify to an
upper triangle matrix of polynomials. Each
coefficient a
i
can be determined by the native Gauss
elimination method, Consequently, the polynomial
function of P(t
n+1
) can be obtained,
In our work, we will use the polynomial
regression mobility prediction to predict the future
user position. For the velocity we take the second
derivative of Eq. (5) and equal the results for zero.
Also we can use geographical information after
applying the predicted values on map and see the
direction if there is forbidden area or error in
prediction direction.
SMARTGREENS 2017 - 6th International Conference on Smart Cities and Green ICT Systems
340

5 MOBILITY MODEL AND
SIMULATION RESULTS
In our system, we have the requirement of design the
smart city is with good quality of services as shown
in Figure 1. It is specified in abstract layer where all
arithmetic, optimized ways and solutions are used.
The constraints and the measurements are used to
choose the implantation ways in the abstract layer.
In first stages we chose the software platform and
architecture and in last stages we proposed the
services providing and advance performance
monitoring of city urban planning.
The lower layer (architecture and space design)
includes: fading, noise and shadowing models,
mobility management (RWP and RW models),
mobility prediction models (Polynomial model),
network layout and traffic model. Architecture layer
takes all these information, processes and sends the
performance to the upper layer (Application layer)
where evaluate, visualize and monitor the design
according to the requirements and constraints.
The simulation program is divided into three
phases: initial phase, processing phase and urban
planning management phase. In the initial phase, we
select the initial values such as number of users,
number of steps, x, y and velocities for all users. The
initial values of one user are not correlated with other
users. It used dependent on the traffic model after
entering the intra-segment components and inter-
segment components. They are taken from tested
field. The values of x and y are within the limit of our
selected rectangular simulation area. The velocities
are in uniform distribution and randomly selected
within the range [Vmin, Vmax]. The time for the first
phase is within t_int. The second phase is the
processing phase where all computations and
optimizations will run in this phase. It is divided into
two parts: mobility models and prediction of user
location, velocity and direction. The mobility models
RWP and random walk. For prediction side, we use
polynomial method. At the beginning, RWP chooses
randomly the destination and velocity and repeats
this in each step till it reaches to steps_end then it
will go to next which is prediction. The same we do
with Random Walk method.
The prediction methods will choose polynomial
method. It is accurate, simple and need less memory
storage for coding and processing. The mobility in
our work deals with individual movement of users
and relative movement within the selected simulated
area.
For prediction method, we first predict the value
of velocity using the last values of time, x and y of
each user and move to direction and the location of
users at selected time. The time required at the end of
this step is t_int+t_processing. At the end of this step
we have the predicted values of location, velocity and
direction of user movement at selected time.
The last and important step in our system is the
urban planning calculation, optimization and testing.
The saving and advantage for design the city and
how our work can help the city. The time required at
the end of this step is t_int+t_processing+t_manag.
The Dijkstra algorithm is used to get the nearest
and optimum way between the source and
destination points.
To test the system with all phases, we use
openstreet program. The simulated area is one place
in Baghdad, Iraq called Al-Sadar City. It has high
population in Baghdad. There is serious need to plan
and manage the ways to enter and leave it. In our
work, he users move from Al-Sadar City to two
places; Al-Khadmia and Al-Zawra. Al-Khadmia is
religion place and old city in centre of Baghdad. The
map of Al-Khadmia is shown in Figure 2-a. Al-
Zawra is biggest public garden in Baghdad. The map
of Al-Zawra is shown in Figure 3-a.
We export files with type xml.osm files for Al-
Khadmia city and Al-Zawra and parsed the data
using Matlab such as:
Bounds: [2x2 double] axis limitations of our
areas
Node: [1x1 struct] node_id, node_xy
Way: [1x1 struct] combination of nodes,
node_id, way_id, way_tag
For our area we have
id: [1x14626 double]
nd: {1x14626 cell}
tag: {1x14626 cell}
Figures 2-a and 3-a show the parsed files with
ways for Al-Khadmia and Al-Zawar areas
respectively. Figures 2-b and 3-b show the area with
nodes and complete ways in Al-Khadmia and Al-
Zawar areas respectively.
The connectivity of nodes and ways are parsed in
connectivity matrix using Matlab as shown in the
following:
Connectivity matrix =
(68,5) 1
(98,5) 1
(100,20) 1
The connectivity matrix is parsed matrix and “1”
here means there is connection between the nodes.
To decide the connection and route between ways we
Design and Implementation of Human Mobility Embedded System for Urban Planning of Smart City
341

choose Dijkstra's algorithm to decide the shortest
path between nodes and ways.
Dijkstra's algorithm is invented by scientist
Edsger Dijkstra in 1956 and published in 1959
(Matteo Leccardi, 2005; Jae-Hyung Jeon et al.,
2014). It is used to find the shortest path between two
points in graph.
We use Dijkstra's algorithm to find the shortest
path in each step and the best route to reach the
destination point for RWP model in our limited area
(Baghdad). In each step there are number of hops
(nodes) to pass during the complete route. The parsed
data provides us with node_id and node_xy of each
hope.
The number of users in our work is 5000 users
move from Al-Sadar city to both Al-Khadmia and
Al-Zawara. For RWP point we use 400 steps for ech
user. After running the program with random 5000
user with 400 steps for each user in both places (Al-
Khadmia and Al-Zawara), we get the best ways from
Al-Sadar city to Al-Khadmia and Al-Zawar. The
program decides the best ways depending on
Dijkstra's algorithm for l and traffic in both tested
areas.
In this case, we solve the one of biggest problem
in Baghdad. Al-Sadar city has a population for more
than 3 million people. It needs to plan and manage in
smart way. It is one example how to solve the
problems and build smart city.
6 CONCLUSIONS
Transportation and choosing the best way are very
important factors in designing the smart city.
Needing for designing the smart transportation is
increased with increasing number of people and the
cars.In our work, we study the mobility of users and
predict their locations in the tested area. It will help
the designer to choose the best way in advance to
cover the users and have the chance to manage
congestion and traffic for different ways within the
tested area.
We use RWP and Random Walk models to
represent the individual mobility of a user and use
geographical dependent to represent the relative
mobility (corresponding to the tested area). The
mixing models provide more realistic representation
for the movement of users.
For prediction side we used polynomial method
to calculate the user’s velocity, direction and location
at given time slot. Also we deal with traffic and
number of users when decide the ways within the
tested areas and optimized the best way taken by
users.
Al-Sadar City in Baghdad, Iraq is chosen as
tested area. It has high population near 3 millions
people. The users move from Al-Sadar city to
different places: Al-Khadmia and Al-Zawra. They
are different areas. Al-Khadmia is religion and old
city. It has also big market. The second one, Al-
Zawra, is biggest public garden in Baghdad. It has
big green places, games and restaurants. In Baghdad
there is serious need to manage and plan the best
ways to to enter and leave Al-Sadar city.
In our work, we find the best ways to connect Al-
Sada city with both Al-Khadmia and Al-Zawra using
mobility model and traffic model in both places. It
will help the designer to take the correct decision
when design and manage the ways and transportation
of the cities. It will help us to build smart cites with
good planning and smart transportation ways.
REFERENCES
Vicente Casares-Giner_, Vicent Pla, and Pablo Escalle-
Garc´ıa,” Mobility Models for Mobility Management”,
Next Generation Internet, LNCS 5233, pp. 716–745,
2011.
Ignacio Martinez-Arrue, Pablo Garcia-Escalle and Vicente
Casares-Giner,” Location Management Based on the
Mobility Patterns of Mobile Users”, Wireless Systems
and Mobility in Next Generation Internet Lecture
Notes in Computer Science Volume 5122, 2008, pp
185-200.
Yu-Liang Tang, Chun-Cheng Lin, Yannan Yuan1 and
Der-Jiunn Deng,” Dividing Sensitive Ranges Based
Mobility Prediction Algorithm in Wireless Networks”,
Tamkang Journal of Science and Engineering, Vol. 13,
No. 1, pp. 107_115, 2010.
Son, D., Helmy, A. and Krishnamachari, B., “The Effect
of Mobility-Induced Location Errors on Geographic
Routing in Mobile Ad Hoc Sensor Networks: Analysis
and Improvement Using Mobility Prediction,” IEEE
Transactions on Mobile Computing, Vol. 3, pp.
233_245 (2004).
Mir, Z. H., Shrestha, D. M., Cho, G.-H. and Ko, Y.-B.,
Mobility Aware Distributed Topology Control for
Mobile Multi-Hop Wireless Networks, in Proc. of
ICOINS 2006, Vol. 3961 of LNCS. 2006, pp. 257_266.
TAMÁS SZÁLKA, SÁNDOR SZABÓ, PÉTER FÜLÖP,
”Markov model based location prediction in wireless
cellular networks”, Info-communication journal, 2009.
Peppino Fazio, Salvatore Marano,” A New Markov-Based
Mobility Prediction Scheme for Wireless Networks
with Mobile Hosts” International Symposium on
Performance Evaluation of Computer and
Telecommunication Systems (SPECTS), 8-11 July
2012.
SMARTGREENS 2017 - 6th International Conference on Smart Cities and Green ICT Systems
342

R. Chellappa Doss , A. Jennings, N. Shenoy, “A Review
on Current Work in Mobility Prediction for Wireless
Networks”, Proceedings Third Asian International
Mobile Computing Conference, Bangkok, Thailand,
26-28 May 2004.
J. Broch, D. A. Maltz, D. B. Johnson, Y.-C. Hu, and J.
Jetcheva, A performance comparison of multi-hop
wireless ad hoc network routing protocols, in
Proceedings of the Fourth Annual ACM/IEEE
International Conference on Mobile Computing and
Networking (Mobicom98), ACM, October 1998.
Berk Birand, Murtaza Zafer, Gil Zussman, Kang-Won
Lee,” Dynamic Graph Properties of Mobile Networks
under Levy Walk Mobility”, Eighth IEEE International
Conference on Mobile Ad-Hoc and Sensor Systems,
2011.
Injong Rhee, Minsu Shin, Seongik Hong, “On the Levy-
Walk Nature of Human Mobility”, IEEE/ACM
TRANSACTIONS ON NETWORKING, VOL. 19,
NO. 3, JUNE 2011.
Francesco Calabrese, Giusy Di Lorenzo, C. Ratti, “Human
Mobility Prediction based on Individual and Collective
Geographical Preferences”, 2010.
Matteo Leccardi,”Comparison of Three Algorithms for
Lévy Noise Generation”, 2005.
Jae-Hyung Jeon, Eli Barkai, Ralf M, etzler, ” Noisy
continuous time random walks”, final report, 2013.
Heiko Bauke,’ Parameter estimation for power-law
distributions by maximum likelihood methods’,
August, 2007.
Design and Implementation of Human Mobility Embedded System for Urban Planning of Smart City
343
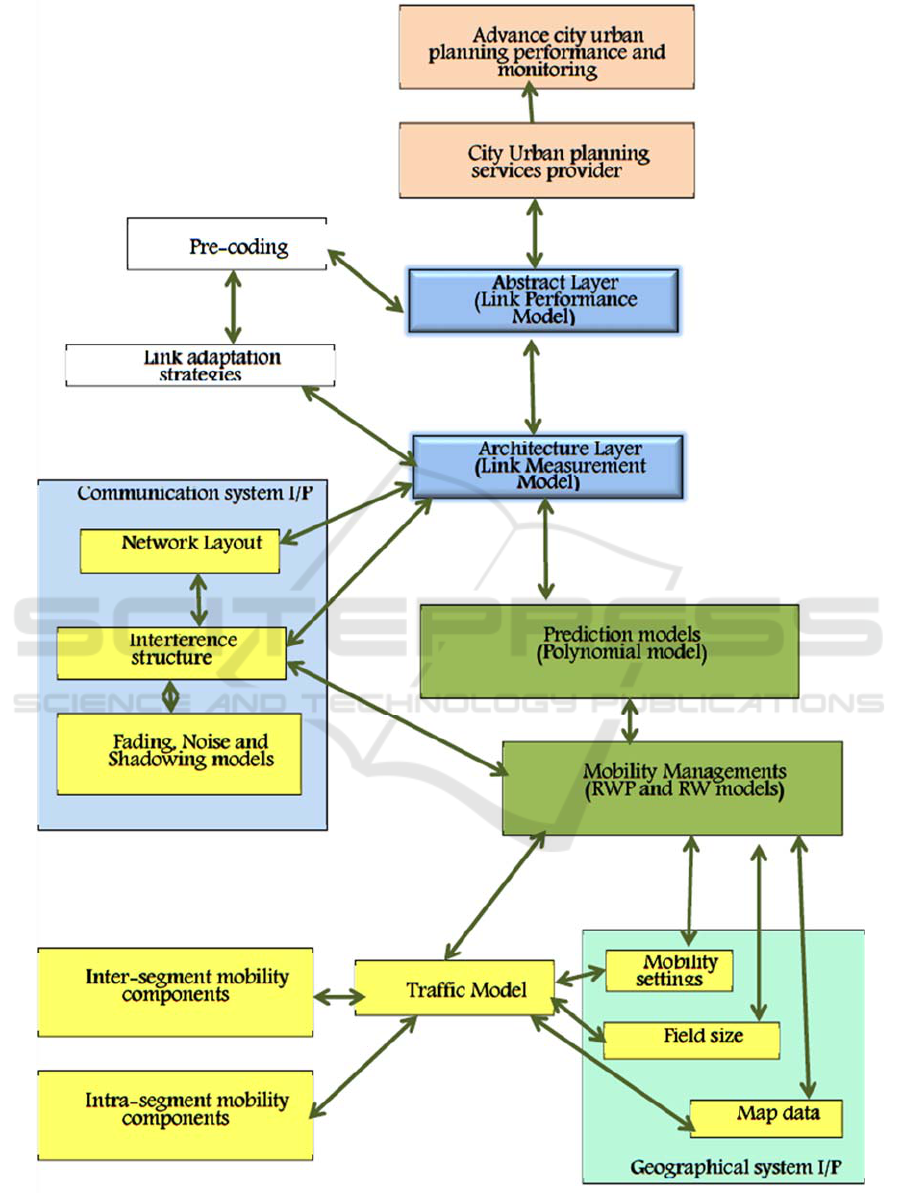
Figure 1: Schematic block diagram of mobility and city urban planning system.
SMARTGREENS 2017 - 6th International Conference on Smart Cities and Green ICT Systems
344
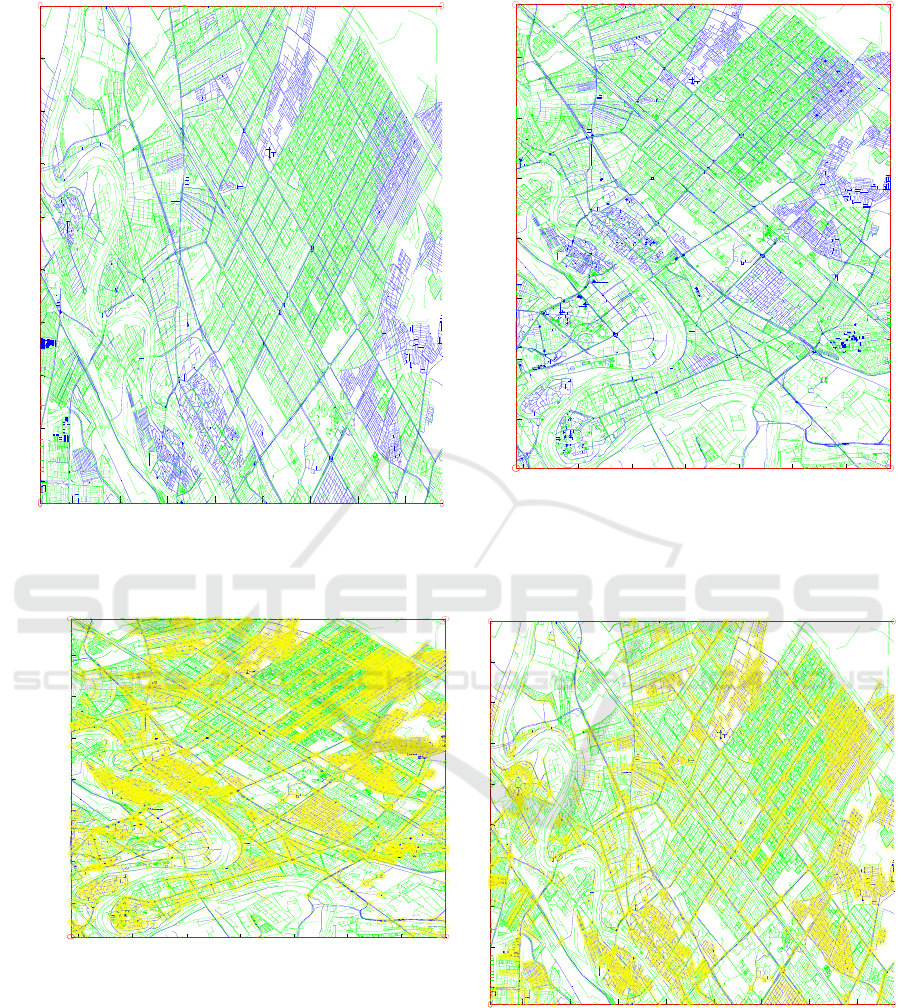
a) Parsed the map using Matlab program for Al-Sadar City
and Al-Khadmia places in Baghdad, Iraq
a) Parsed the map using Matlab program for Al-Sadar City
and Al-Zawra places in Baghdad, Iraq
b) Parsed nodes from the map using Matlab program for
Al-Sadar City and Al-Khadmia places in Baghdad, Iraq
b) Parsed nodes from the map using Matlab program for
Al-Sadar City and Al-Zawraia places in Baghdad, Iraq
Figure 2: Openstreet Map for for Al-Sadar City and Al-
Khadmia places in Baghdad, Iraq with parsed information
using Matlab.
Figure 3 Openstreet Map for for Al-Sadar City and Al-
Zawra places in Baghdad, Iraq with parsed information
using Matlab.
44.34 44.36 44.38 44.4 44.42 44.44 44.46 44.48
33.33
33.34
33.35
33.36
33.37
33.38
33.39
33.4
33.41
33.42
Longitude (
o
)
Latitude (
o
)
OpenStreetMap osm file
44.36 44.38 44.4 44.42 44.44 44.46 44.48
33.28
33.3
33.32
33.34
33.36
33.38
33.4
Longitude (
o
)
Latitude (
o
)
OpenStreetMap osm file
44.36 44.38 44.4 44.42 44.44 44.46 44.48
33.28
33.3
33.32
33.34
33.36
33.38
33.4
Longitude (
o
)
Lati tude (
o
)
OpenStreetMap osm file
44.34 44.36 44.38 44.4 44.42 44.44 44.46 44.48
33.33
33.34
33.35
33.36
33.37
33.38
33.39
33.4
33.41
33.42
Longitude (
o
)
Latitude (
o
)
OpenStreetMap osm file
Design and Implementation of Human Mobility Embedded System for Urban Planning of Smart City
345
