
Knowledge Tracking Variables in Intelligent Tutoring Systems
Ani Grubišić
1
, Slavomir Stankov
2
, Branko Žitko
1
, Ines Šarić
1
, Suzana Tomaš
3
, Emil Brajković
4
,
Tomislav Volarić
4
, Daniel Vasić
4
and Arta Dodaj
5
1
Faculty of Science, University of Split, Split, Croatia
2
Retired full professor, Croatia
3
Faculty of Humanities and Social Sciences, University of Split, Split, Croatia
4
Faculty of Science and Education, University of Mostar, Mostar, Bosnia and Herzegovina
5
Faculty of Philosophy, University of Mostar, Mostar, Bosnia and Herzegovina
Keywords: Intelligent Tutoring Systems, Learning Analytics.
Abstract: In this research we propose a comprehensive set of knowledge indicators aimed to enhance learners’ self-
reflection and awareness in the learning and testing process. Since examined intelligent tutoring systems do
not include additional messaging features, the introduction of common set of knowledge indicators
differentiates our approach from the previous studies. In order to investigate the relation between proposed
knowledge indicators and learner performance, the correlation and regression analysis were performed for 3
different courses and each examined intelligent tutoring system. The results of correlation and regression
analysis, as well as learners’ feedback, guided us in discussion about the introduction of knowledge
indicators in dashboard-like visualizations of integrated intelligent tutoring system.
1 INTRODUCTION
Researchers’ efforts and technology development
combined in e-learning are constantly enhancing
teaching and learning process. Although human
tutoring is still widely believed to be the most
effective form of instruction, the intelligent
component of e-learning systems deals with
uncertain situations that appear in education process.
The possibility of learning anywhere, any-place and
any-time contributes to the widespread use of e-
learning. Today, as one of the e-learning platforms,
Intelligent Tutoring Systems (ITSs) are in
widespread use in education with positive impact on
student learning (Baker, 2016). ITSs respect
learner’s individuality, as in traditional "one-to-one"
tutoring, all in order to support and improve learning
and teaching process. These e-learning platforms
provide immediate and customized instruction or
feedback to learners, usually for certain domain
knowledge and without intervention from a human
teacher.
During teaching, learning and testing process,
ITSs generate vast amounts of data which may be
crucial for creation of better systems and
improvement of education overall. Generated data is
analyzed using different techniques and methods,
while research efforts to advance the understanding
of student learning are mostly being pursued in the
fields of learning analytics (Koedinger et al., 2013;
Long and Siemens, 2011) and educational data
mining (Baker and Yacef, 2009; Romero and
Ventura, 2007). By examining learner’s data logs,
these research areas offer the possibility to support
teaching, learning and testing process in ITSs.
2 CONCEPT MAP BASED ITSs
The process of developing ITSs often includes
collaborative domain knowledge modelling, starting
from the expert's natural language description of
their knowledge in a form of concepts and their
relations, at the same time forming the inventory of
the domain ontology (Carnot et al., 2003). In the
focus of this study are ITSs that use ontological
domain knowledge representation, in which students
are taught domain knowledge graphically presented
as a network of nodes and relations between them –
as a concept map. Concept mapping technique was
developed by Novak’s research team in the 1970s
who based their research on Ausubel work in
learning psychology (Ausubel, 1968) with
fundamental idea that learning takes place by the
Grubiši
´
c, A., Stankov, S., Žitko, B., Šari
´
c, I., Tomaš, S., Brajkovi
´
c, E., Volari
´
c, T., Vasi
´
c, D. and Dodaj, A.
Knowledge Tracking Variables in Intelligent Tutoring Systems.
DOI: 10.5220/0006366905130518
In Proceedings of the 9th International Conference on Computer Supported Education (CSEDU 2017) - Volume 1, pages 513-518
ISBN: 978-989-758-239-4
Copyright © 2017 by SCITEPRESS – Science and Technology Publications, Lda. All rights reserved
513
assimilation of new concepts and propositions into
existing concepts and propositional frameworks held
by the learner (Novak and Cañas, 2008). The
concept map grows around a focus question, while
helping learners see how individual ideas and
concepts form a larger whole.
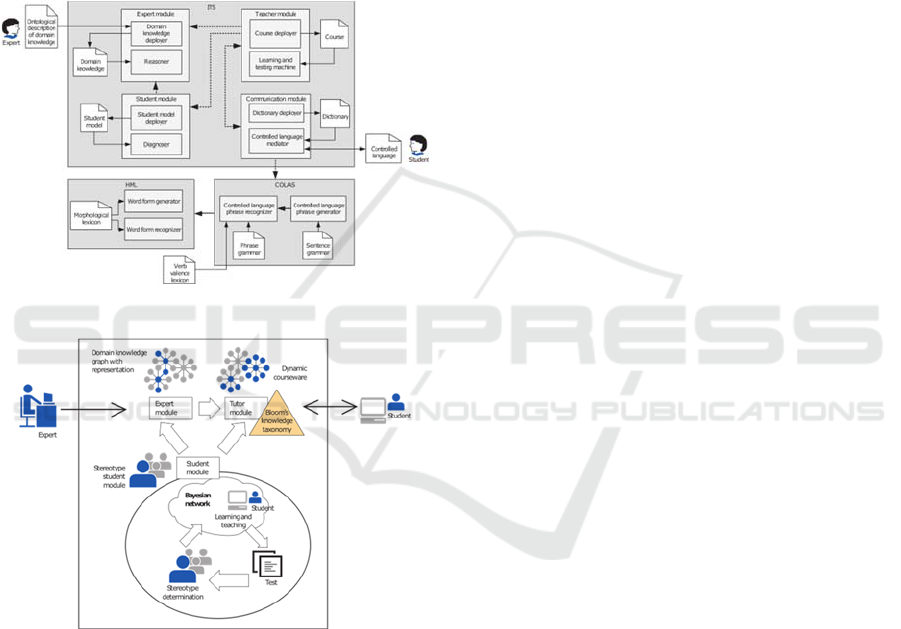
Since 2003 we have followed two directions of
research, development and application of concept
map based ITSs - Controlled Language Based Tutor
(CoLaB Tutor, Figure 1) and Adaptive Courseware
Tutor Model (AC-ware Tutor, Figure 2) (Grubišić,
2012; Žitko, 2010).
Figure 1: CoLaB Tutor.
Figure 2: AC-ware Tutor.
2.1 CoLaB and AC-ware Tutor
The examined ITSs are specific in term of structural
components, main idea and implementation. CoLaB
Tutor’s forte lies in teacher - learner communication
in controlled natural language, while AC-ware Tutor
focuses on automatic and dynamic generation of
adaptive courseware based on learner stereotypes,
Bayesian networks and Bloom's knowledge
taxonomy. Both Tutors share the idea of iterative
process of learning and testing, until the learner
finishes courseware at a certain knowledge level.
Also, both Tutors do not include additional
messaging features, such as forum or chat.
The previous experience guided us in the
development of a new integrated ITS - Adaptive
Courseware & Natural Language Tutor (AC&NL
Tutor) (Grubišić et al., 2015). Since 2015, AC&NL
Tutor is in its development phase, with support of
the United States Office of Naval Research Grant.
In this preliminary research we will examine LA
opportunities in CoLaB and AC-ware Tutor
(Tutors), with aim to introduce supporting
dashboard-like visualizations in the integrated
AC&NL Tutor.
3 RESEARCH OBJECTIVES
This research study aims to address the following
research questions:
- Which knowledge indicators can be extracted from
experimental Tutors’ logs?
- What is the relationship between proposed
knowledge indicators and learner performance?
- How the proposed knowledge indicators can be
used in supporting dashboard-like ITS
visualizations?
4 BACKGROUND
So far, researchers tracked different types of data in
order to measure different aspects of learners’
behavior during online learning. In order to discover
connections between gathered data, as well as, to
investigate the model in which a single aspect of
data (predicted variable) is the consequence of
combination of other aspects of the data (predictor
variables), relationship mining and prediction are
frequently used methods. In term of selecting
variables and investigating the relation between
online behavior and learner performance, the
number of studies revealed positive results.
The factors that were previously investigated as
predictor variables included: student's performance
in previous courses, on initial test, or on assignments
during the experiment; student's behavior in term of
single online activities (i.e. the number of log-in
times) and collaborative online activities (i.e. the
number of forum posts read); student's affective
states while learning online; student's perception
about the online education, cognitive-motivational
factors or study habits; demographic and other
factors; or combination of previous factors.
CSEDU 2017 - 9th International Conference on Computer Supported Education
514

In the research study by Lin and Chiu (Lin and
Chiu, 2013), selected course tracking variables
demonstrated a positive and statistically significant
correlation with student final grade, where the
number of online sessions demonstrated a medium-
large effect size with explaining 15% of the variance
in the student final grade. The remaining 4 variables
(the number of original posts created, the number of
follow-up posts created, the number of content pages
viewed and the number of posts read) had a small-
medium effect size with each explaining from 2% to
8% of variance in student final grade. In the
prediction analysis of the same research,
approximately 16% of the variability in academic
performance was explained including 3 predictor
variables: the number of online sessions, the number
of follow-up posts created, and the number of posts
read. Macfadyen and Dawson (Macfadyen and
Dawson, 2010) reported regression model which
incorporated key variables such as total number of
discussion messages posted, total number of mail
messages sent, and total number of completed
assessments and which explained more than 30% of
the variation in student final grade. Previous model
was further applied to predict student retention,
which correctly identified 81% of students who
achieved a failing grade. Also, Morris et al (Morris
et al., 2005) discovered similar results as previous
research studies in which approximately 31% of the
variability in achievement was accounted for by
student participation measures, with 3 statistically
significant variables: number of discussion posts
viewed, number of content pages viewed, and total
seconds in viewing discussions. Besides research
studies that revealed positive results, Abdous et al
(Abdous et al., 2012) analyzed online
communication in live video streaming courses and
did not find positive correlations between students’
number of questions, chat messages, login times and
students’ success.
The mentioned data extracted from the learners’
logs is usually presented on dashboard-like systems’
visualizations and includes: login trends,
performance results, content usage, message analysis
and social network (Park and Jo, 2015). ITSs’
dashboards differentiate in term of targeted users
(teachers and/or learners), as well as intended goals.
There are dashboards focused on the representation
of raw data and dashboards that involve prediction
algorithms. Descriptive approach enables learners’
self-reflection and awareness of what and how they
are doing, while prescriptive approach provides
feedback on learners’ activities to the teacher,
learner or Tutor itself.
5 PROPOSED KNOWLEDGE
TRACKING VARIABLES
During teaching, learning and testing process in
Tutors, learners adaptively pass through courseware,
gain score on tests, while doing all of that in the
certain amount of time. Tutors represent ITSs
without additional features such as forum or chat
and they are mainly oriented on adaption or
communication in natural language. Because of the
previous, our approach focuses on tracking
knowledge using comprehensive set of Knowledge
Tracking Variables (KTVs): total number of objects
(#O), total number of concepts (#C), total score
gained on Tutor (#S) and total time spent online
(#T). The proposed approach is relevant for various
tutoring examples, because courseware can
generally be presented as a group of lessons, videos,
presentations etc., while total score and time can be
calculated accordingly.
In CoLaB Tutor, objects are presented as groups
of concepts seen in the learning process and
concepts are presented as nodes of the concept map
seen in the learning process. In AC-ware Tutor
objects are presented as total number of content
pages seen in the learning process while concepts
are presented as concept map nodes seen in the
learning process. The main difference between
Tutors’ scoring systems lies in fact that CoLaB
Tutor calculates negative points for incorrectly
answered questions, while AC-ware Tutor’s score
includes only the maximum points earned for each
answered question. Total time is calculated out of
data logs, in a way if there was no learner activity
for more than 30 minutes, it is assumed that learner
took a break from the learning process. The
complete learner record consists of KTVs in the
following form: #Objects, #Concepts, #Score,
#Time in minutes and #Final exam score.
6 THE RELATIONSHIP
BETWEEN ONLINE
BEHAVIOR AND LEARNER’S
PERFORMANCE
The relationship between online behavior (KTVs)
and learner’s performance (total score on final exam,
FE) was examined by conducting the experiment in
the winter semester 2015/2016.
Knowledge Tracking Variables in Intelligent Tutoring Systems
515
6.1 Research Methodology
During the winter semester 2015/2016, 156
undergraduate and graduate students from 3 faculties
participated in the research study. The study
included 3 online courses that had aim to teach
different domain knowledge: Introduction to
computer science, Theory of e-learning and
Introduction to programming. Data collection was
generated in specific Tutors' environments, with
over 100.000 database records. Several pre-
processing methods were used in data
transformation process: standardization of data
formats and syntax correction, grouping of data, and
Python implementation of algorithms for calculation
of total values of KTVs. After learners finished
online courses on Tutors, data logs were analyzed
using SPSS statistical package.
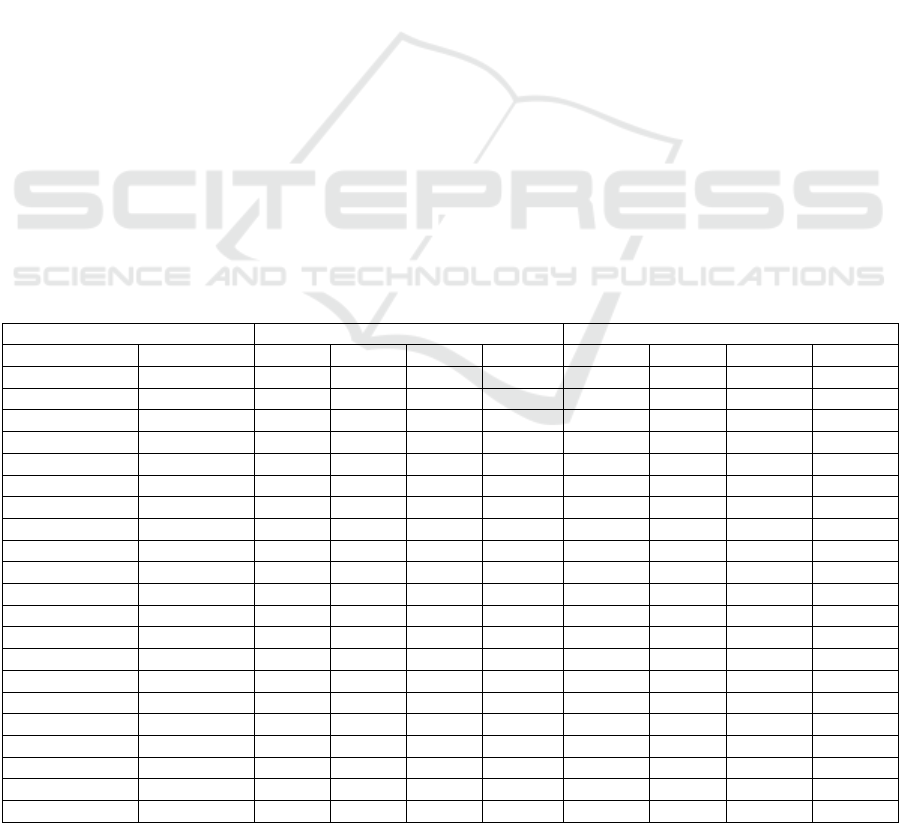
Descriptive indicators, including number of
students (row #Students), mean values (row Mean),
minimum (row Min), maximum (row Max) and
standard deviations (row SD) for each KTV and
specific Tutor are presented in Table 1. Since we
observe 3 courses, raw data (#O, #C, #S) for
particular Tutor (columns CoLaB and AC-ware) is
normalized to the scale 0-100, according to the
maximum value of the group that used particular
Tutor and selected course. Total time spent on each
Tutor for specific course is calculated in minutes.
The average user on CoLaB Tutor in 65 minutes
went through 90% of all objects, 91% of all
concepts, gained 70/100 score, and on the final exam
got score of 42/100. The average user on AC-ware
Tutor in 48 minutes went through 20% of the
maximum number of pages seen in learning process,
78% of all concepts, gained 50/100 score, and on
final exam got score of 45/100.
6.2 Correlation Analysis
To further investigate the relationship between
KTVs and final exam performance, correlations are
calculated and presented in Table 2. In case of
CoLaB Tutor, the results revealed positive and
statistically significant correlations (p<0.01, p<0.05)
between the number of objects, concepts and online
score as KTVs and final exam score.
In term of objects and online score, revealed
correlations correspond to small-medium effect size
(r<0.30), with 5% of variance explained in the final
exam performance each. In term of concepts,
correlation corresponds to medium effect size
(r=0.30-0.50), with 10% of variance explained in the
final exam performance. In case of AC-ware Tutor,
there are positive and statistically significant
correlations (p<0.01, p<0.05) between all KTVs and
final exam score. In term of the number of objects
and concepts, revealed correlations correspond to
small- medium effect size (r<0.30), with 6% and 8%
of variance explained in the final exam performance.
Table 1: Descriptive statistics for courses under study.
CoLaB Tutor AC-ware Tutor
KTV Indicator S1 S2 S3 Total S1 S2 S3 Total
#Students
41 29 26 96 27 24 32 83
#Objects Mean
4.53 5 3.11 90.05 12.55 2.45 3.56 20.82
Min
1 5 1 20 1 0 0 0
Max
5 5 4 100 44 9 40 100
SD
1 0 1.14 21.33 10.66 2.3 7.71 24.73
#Concepts Mean
41.12 28 32.42 91 68.33 30.37 53.18 78.62
Min
29 28 1 2.27 39 11 40 28.20
Max
43 28 44 100 71 39 83 100
SD
4.24 0 15.48 21.97 7.94 12.06 13.84 24.02
#Score Mean
37.66 14.07 29.66 70.85 295.22 93.79 58.40 50.05
Min
16.54 6.45 0 0 43 0 0 0
Max
50.79 18.02 51.53 100 348 168 336 100
SD
9.76 3.03 20.98 27.28 93.53 69.84 81.28 41.83
#Time Mean
70.78 73.89 48.69 65.73 98.91 28.71 20.74 48.88
Min
0 34 0 0 4.78 0 0 0
Max
226 113 174 226 269.55 82.58 173.36 269.55
SD
57.42 24.35 47.38 47.59 55.42 25.25 35.58 54.09
#Final exam Mean
65.60 34.27 16.53 42.85 48.81 85.43 14.96 45.24
Min
33 6 0 0 12 66 0 0
Max
94 80.5 36 94 91 93 42.5 93
SD
13.50 18.79 11.05 25.46 19.71 7.06 11.46 32
CSEDU 2017 - 9th International Conference on Computer Supported Education
516

Table 2: Correlations between final exam score and KTVs.
KTV CoLaB AC-ware
#O
0.224* 0.252*
#C
0.323** 0.288**
#S
0.229* 0.410**
#T
-0.023 0.315**
* 0.05 significance level ** 0.01 significance level
In term of online score and total time spent online,
revealed correlations correspond to medium effect
size (r=0.30-0.50), with 16% and 9% of variance
explained in the final exam performance.
6.3 Regression Analysis
The Pearson correlation coefficient cannot determine
a cause-and-effect relationship; it can only establish
the strength of the association between two
variables. From the set of KTVs, seven potentially
significant indicator variables revealed in correlation
analysis were further included in the regression
analysis. Regression models are generally developed
using hierarchical or block wise approaches for
cases in which predictors have been identified in
previous or published works. In the absence of such
information, a backwards stepwise approach for
entering potentially significant variables into a
model is a robust and valid approach (Field, 2005;
Macfadyen and Dawson, 2010).
In case of CoLaB Tutor, the regression analysis
generated a ‘best predictive model’ of the final exam
score (F(10.949), p=0.00), as a linear measure of the
total number of concepts (showed in Table 3). The
total number of concepts, as KTV and knowledge
indicator, is statistically significant contributor
(p<0.05) and multiple squared correlation coefficient
for this model is 0.104, indicating that around 10%
of the variability in learner performance in these
courses can be explained by this KTV for online
behavior.
Table 3: Regression analysis for CoLaB Tutor.
USC SC
Var β SE β
C
8.788 10.588
#C
0.374 0.113 0.323
Table 4: Regression analysis for AC-ware Tutor.
USC SC
Var β SE β
C
30.609 5.051
#S
0.312 0.077 0.410
In case of AC-ware Tutor, the regression analysis
generated a ‘best predictive model’ of learner final
exam score (F(16.350), p=0.00), as a linear measure
of the gained online score (showed in
Table 4). The
total score gained online, as KTV and knowledge
indicator, is statistically significant contributor
(p<0.05) and multiple squared correlation coefficient
for this model is 0.168, indicating that around 16%
of the variability in learner performance in these
courses can be explained by this KTV for online
behavior.
The previous findings may be discussed using
learners’ feedback about difficulties they
encountered during the use of Tutors. CoLaB
Tutor’s limited communication skills during
dialogue were an obstacle for some students, who
occasionally struggled to find ‘the right words’. The
previous could contribute to the non-significant
small correlation between the total time spent on
CoLaB Tutor and learners’ performance.
Although all other KTVs were positively
correlated with the learners’ performance for both
Tutors, only finished courseware in CoLaB Tutor
and total score in AC-ware Tutor resulted as
predictors of learners’ performance. The learning
process in AC-ware Tutor seemed to be more
tedious than the learning process in CoLaB Tutor.
AC-ware Tutor presents more text which learners
have to memorize, so some of the learners had
practice to photograph lesson screens during the
experiment, making easier testing process and
completing the courses without mastering the
concepts. The more appropriate learning behavior in
CoLaB Tutor could contribute to the significance of
finished courseware as learner performance
predictor.
In term of scoring systems, the main difference
between Tutors is in calculating negative points
during testing process. CoLaB Tutor calculates
negative points for incorrectly put concepts during
the dialogue, while AC-ware Tutor lets learners to
make mistakes during this learning-by-testing
process. AC-ware Tutor’s total score which includes
points only for correct answers resulted as the
strongest predictor of learners’ performance. Based
on the obtained results we may conclude that Tutors
probably lead to different measured aspects of
knowledge (and learning). The higher predictive
value of gained score in AC-ware Tutor compared to
the finished courseware in CoLaB Tutor imply that
online score is probably more similar to the level of
knowledge examined through paper-pencil final
exam.
Knowledge Tracking Variables in Intelligent Tutoring Systems
517

7 FURTHER RESEARCH AND
FUTURE DASHBOARD
The analysis results follow the idea of supporting
learners in online learning by using KTVs. Since
integrated AC&NL Tutor will encompass main
structural components of both Tutors, the
information about passed courseware and gained
score should be presented in the learning and testing
process. After the learner finishes online course,
total time spent online should also be presented.
From the teacher point of view, all available
knowledge information should be visible on
dashboard, enabling teachers to additionally
intervene and support learners. The descriptive role
of dashboard will help on learners’ self-reflection
and awareness. The prediction power of revealed
KTVs in this research study will be verified in the
winter experiment 2016/2017. The experiment
protocol will be enhanced in term of strengthening
learner motivation, better learner preparation at the
beginning of the experiment and monitoring learner
progress during the experiment.
ACKNOWLEDGEMENTS
The paper is part of the work supported by the
Office of Naval Research grant No. N00014-15-1-
2789.
REFERENCES
Abdous, M. ’hammed, He, W. and Yen, C.-J. (2012),
“Using Data Mining for Predicting Relationships
between Online Question Theme and Final Grade”,
Educational Technology & Society, 15(3), pp. 77–88.
Ausubel, D.P. (1968), Educational Psychology: A
Cognitive View, Holt, Rinehart and Winston.
Baker, R.S. (2016), “Stupid Tutoring Systems, Intelligent
Humans”, International Journal of Artificial
Intelligence in Education, Vol. 26 No. 2, pp. 600–614.
Baker, R.S. and Yacef, K. (2009), “The State of
Educational Data Mining in 2009: A Review and
Future Visions”, JEDM - Journal of Educational Data
Mining, Vol. 1 No. 1, pp. 3–17.
Carnot, M.J., Feltovich, P., Hoffman, R.R., Feltovich, J.
and Novak, J.D. (2003), A Summary of Literature
Pertaining to the Use of Concept Mapping Techniques
and Technologies for Education and Performance
Support, Report from the Institute for Human and
Machine Cognition, Pensacola, FL.
Field, A. (2005), Discovering Statistics Using SPSS,
Second Edition., Sage Publications Ltd, London;
Thousand Oaks, Calif.
Grubišić, A. (2012), Adaptive Student’s Knowledge
Acquisition Model in E-Learning Systems, University
of Zagreb, Croatia.
Grubišić, A., Stankov, S. and Žitko, B. (2015), “Adaptive
Courseware based on Natural Language Processing
(AC & NL Tutor), United States Office of Naval
Research grant (N00014-15-1-2789)”.
Koedinger, K.R., Brunskill, E., Baker, R.S., McLaughlin,
E.A. and Stamper, J. (2013), “New Potentials for
Data-Driven Intelligent Tutoring System Development
and Optimization”, AI Magazine, Vol. 34 No. 3, pp.
27–41.
Lin, C.-C. and Chiu, C.-H. (2013), “Correlation between
Course Tracking Variables and Academic
Performance in Blended Online Courses”, IEEE, pp.
184–188.
Long, P. and Siemens, G. (2011), “Penetrating the fog:
Analytics in learning and education”, Educause
Review, 46(5), 31-40.
Macfadyen, L.P. and Dawson, S. (2010), “Mining LMS
data to develop an ‘early warning system’ for
educators: A proof of concept”, Computers &
Education, Vol. 54 No. 2, pp. 588–599.
Morris, L.V., Finnegan, C. and Wu, S.-S. (2005),
“Tracking student behavior, persistence, and
achievement in online courses”, The Internet and
Higher Education, Vol. 8 No. 3, pp. 221–231.
Novak, J.D. and Cañas, A.J. (2008), “The Theory
Underlying Concept Maps and How to Construct and
Use Them”, available at:
http://cmap.ihmc.us/Publications/ResearchPapers/The
oryUnderlyingConceptMaps.pdf (accessed 16
September 2016).
Park, Y. and Jo, I.-H. (2015), “Development of the
Learning Analytics Dashboard to Support Students’
Learning Performance”, Journal of Universal
Computer Science, Vol. 21 No. 1, pp. 110–133.
Romero, C. and Ventura, S. (2007), “Educational Data
Mining: A Survey from 1995 to 2005”, Expert Syst.
Appl., Vol. 33 No. 1, pp. 135–146.
Žitko, B. (2010), Model of Intelligent Tutoring System
Based on Processing of Controlled Language over
Ontology, University of Zagreb, Croatia.
CSEDU 2017 - 9th International Conference on Computer Supported Education
518
