
A CO2 Emissions Accounting Framework with Market-based Incentives
for Cloud Infrastructures
David Margery
1
, David Guyon
2
, Anne-C
´
ecile Orgerie
3
, Christine Morin
1
,
Gareth Francis
4
, Charaka Palansuriya
4
and Kostas Kavoussanakis
4
1
Inria, IRISA, Rennes, France
2
University of Rennes 1, IRISA, Rennes, France
3
CNRS, IRISA, Rennes, France
4
University of Edinburgh, EPCC, Edinburgh, U.K.
Keywords:
Cloud Computing, Energy Monitoring, Carbon Emissions, CO2 Accounting.
Abstract:
CO2 emissions related to Cloud computing reach nowadays worrying levels, without any reduction in sight.
Often, Cloud users, asking for virtual machines, are not aware of such emissions which concern the entire
Cloud infrastructures and are thus difficult to split into the actual resources utilization, such as virtual ma-
chines. We propose a CO2 emissions accounting framework giving flexibility to the Cloud providers, pre-
dictability to the users and allocating all the carbon costs to the users. This paper shows the architecture of our
accounting framework and ideas on how to practically implement it.
1 INTRODUCTION
Cloud computing’s wide adoption leads to a rising in-
crease of data center’s electricity consumption. This
major social issue will worsen with the explosion of
connected devices and Internet of Things (IoT), ask-
ing for always more computing and storage capacity
in the Cloud. In 2013, U.S. data centers consumed
an estimated 91 billion kWh of electricity; this con-
sumption is projected to increase to roughly 140 bil-
lion kilowatt-hours annually by 2020, the equivalent
annual output of 50 power plants, costing American
businesses $13 billion per year in electricity bills and
causing the emission of nearly 150 million metric tons
of carbon pollution annually (Natural Resources De-
fense Council, 2014).
This uncontrolled energy consumption of Cloud’s
data center causes increased greenhouse gas (GHG)
emissions. This important consequence is mainly de-
termined by the amount and sources of consumed en-
ergy (Bosse et al., 2016). Among GHG, carbon diox-
ide (CO
2
) is the major one in quantity produced by
human activities. Consequently, carbon taxes have
been proposed in order to reduce CO
2
emissions
and their negative effects on environment (Nordhaus,
2012). From an operational point of view, a carbon
tax requires a monitoring and accounting infrastruc-
ture in order to fairly distribute CO
2
costs among the
Cloud users. Even outside a carbon tax system, such
an infrastructure can provide useful information to
users about their real CO
2
emissions based on their
utilization of the Cloud system, and therefore, it can
raise their environmental awareness and incite them
to adopt more sustainable practices.
To build a carbon tax system, it is required to
precisely monitor the resource usage that can be at-
tributed to each user (computing, storage, communi-
cation), and to account for the resource cost induced
by the user’s utilization, like the data center air con-
ditioning cost for instance. While the live monitoring
issue has already been addressed in literature (Wajid
et al., 2015), the accounting issue has received little
attention.
The accounting problem consists in splitting the
indirect costs between the Cloud users (such as air
conditioning), and forecasting the direct costs for
each user. Indeed, Cloud computing is using a pay-
as-you-go model where users buy computing, stor-
age and network resources in the form of virtual ma-
chines (VM). Cloud providers exhibit prices per vir-
tual machine type, depending on the amount of vir-
tual resources included in the virtual machine. Such
Margery, D., Guyon, D., Orgerie, A-C., Morin, C., Francis, G., Palansuriya, C. and Kavoussanakis, K.
A CO2 Emissions Accounting Framework with Market-based Incentives for Cloud Infrastructures.
DOI: 10.5220/0006356502990304
In Proceedings of the 6th International Conference on Smart Cities and Green ICT Systems (SMARTGREENS 2017), pages 299-304
ISBN: 978-989-758-241-7
Copyright © 2017 by SCITEPRESS – Science and Technology Publications, Lda. All rights reser ved
299

a model involves an a priori cost which is known by
the user upon purchase as opposed to an a posteriori
cost based on a precise monitoring of the resources
really used and thus, provided to the user at the end
of its Cloud resources utilization. Such an account-
ing model has to be flexible enough for the Cloud
providers to be attractive, and it should provide to the
users a predictable cost. From an external third-party
organization, the carbon tax accounting system needs
to be certified: for a given period of time, all the car-
bon emissions of the data center must be equal to the
overall carbon emissions charged to the users.
In this paper, we propose a CO
2
emissions ac-
counting framework giving flexibility to the Cloud
providers, predictability to the users and allocating all
the carbon costs to the users. We provide the architec-
ture of our accounting framework and ideas on how to
practically implement it. We argue that instead of try-
ing to keep the difference between predicted and real
CO
2
emissions as low as possible at any time, an ef-
fective framework could consider this difference as a
flexible capital to support an economical approach for
users’ energy-awareness.
The paper is organized as follows. Section 2 pro-
vides motivational examples and the context of this
work. The related work is presented in Section 3. Our
proposed architecture is described in Section 4. Sec-
tion 5 discusses the advantages and drawbacks of our
approach and provides ideas for implementing it in
real Cloud infrastructures. Section 6 concludes this
work.
2 CONTEXT AND MOTIVATION
2.1 From the Cloud User Point of View
Cloud users are renting virtual machines (VM) on
a pay-as-you-go basis. The energy consumption of
their virtual machine depends on the resource utiliza-
tion (CPU, memory, disk, network) and on the infras-
tructure power management (cooling cost, resource
allocation management, etc.) (Kurpicz et al., 2016).
The CO
2
emissions depends on the energy consump-
tion and on the electricity mix (Wajid et al., 2015).
One could compute these costs at each time and di-
vide them proportionally to the number of resources
booked by each VM. However, it would mean that
identical VMs running the same computation could
have really different costs. Indeed, if a VM is alone on
the infrastructure at a given time, then it would sup-
port the entire infrastructure cost, while this same VM
during a busy period would account for a much lower
cost. Such an accounting model, with high variations
over the time, would provide great unpredictability to
users, and is thus not desirable.
On the contrary, we argue for a shift of the pre-
diction responsibility from the user to the provider.
The Cloud provider gives a CO
2
cost for a VM upon
its purchase. This cost depends on the VM size and
can vary over time, but it cannot change for VMs al-
ready paid. So, the provider has to carefully monitor
resource consumption, infrastructure costs and elec-
tricity mix to entirely attribute the CO
2
emissions to
its users for a given period of time (a month for in-
stance).
2.2 From the Cloud Provider Point of
View
The Cloud provider is responsible for assigning all the
CO
2
costs to the users over a long period (a month for
instance). A third-party, like a governmental organi-
zation could be in charge of certifying the summary
of provider’s CO
2
accounts. The accounting model
described above does not aim at being as accurate as
possible. Indeed, the provider could compute the dif-
ference between invoiced and real costs at the end of
each VM booking and it could directly pass on this
difference to the next client. However, such a system
does not give any flexibility to the provider. Instead,
we argue for a flexible model, fixed by the provider
itself, and following market opportunities.
The provider is then responsible for dealing with
the difference between invoiced and real costs. It
fixes its own CO
2
cost model for its VMs, and it can
choose not to make direct adjustments, but to use this
difference as a capital to invest. For instance, this
capital can be reinvested to reduce the cost of VMs
when the electricity mix is better or when cooling
costs are lower (at night for instance with free cool-
ing). This capital with its associated cheap offers
would constitute a market-based incentive to increase
users’ energy-awareness. This accounting framework
also favors energy-aware behavior from the Cloud
providers as they need to invoice all the CO
2
costs
to the users. So, in order to be competitive, they need
to have CO
2
costs as low as possible. It creates then
a strong incentive to switch off unused servers or per-
form over-commitment on servers hosting VMs with
low workload.
3 RELATED WORK
The carbon emissions of users’ virtualized resources
mainly depend on their power consumption. The
power consumption attributed to a user is not equal
SMARTGREENS 2017 - 6th International Conference on Smart Cities and Green ICT Systems
300
to the total server power consumption when the user
is not using all the server’s resources. A fine-grained
monitoring of the power consumed by each VM on
a server is necessary in order to be able to estimate
their carbon emissions. Several VM power models
have been proposed in literature with different imple-
mentations. They are usually based on counters (hard-
ware or software) in order to monitor the resource
usage. Their accuracy thus depends which resources
are selected, how they are monitored and which for-
mulas are used to estimate the VM power consump-
tion from the monitoring data, such as linear regres-
sion (Kim et al., 2011) (Wu et al., 2016), polynomial
regression (Xiao et al., 2013), machine learning (Yang
et al., 2014) or tree regression based approach (Gu
et al., 2015). In these studies, estimation errors typi-
cally fluctuate from 2 to 5%.
Research studies start to include ecological-
related factors in their optimization algorithms.
Bosse et al introduces GHG emissions into the system
availability and cost optimization problem of fault-
tolerant IT services (Bosse et al., 2016). Experiments
show that, for a slightly increased cost, a significant
reduction in GHG emissions is possible. Similarly,
Khosravi et al propose a VM placement algorithm
taking into account Cloud sites’ PUE and their carbon
footprint (Khosravi et al., 2013). While maintaining
the same level of QoS, their solution manages to re-
duce the power consumption and CO
2
emissions.
Workload predictions as well as green energy
availability predictions bring an important contribu-
tion in reducing CO
2
emissions as it offers the ability
to adapt system configurations in order to face future
trends. Cloud resources usage can be predicted for
a given Cloud by using Extreme Learning Machine
algorithm on VM usage traces and user behavior (Is-
maeel and Miri, 2016). Sharma et al present a pre-
diction model for green energy availability (Sharma
et al., 2010). The model is able to predict next day en-
ergy harvesting based on weather forecasts. They im-
proved accuracy by 27% with machine learning tech-
niques (Sharma et al., 2011).
The existing studies show the ability to moni-
tor VMs power consumption, the inclusion of GHG
emissions factor in algorithms and also the possibil-
ity to predict availability of green energy as well as
Cloud users workload. However, to the best of our
knowledge, no work is handling the difference be-
tween predictions and calculated estimations of ef-
fective CO
2
emissions. Enabling quotes would allow
Cloud providers to bill the CO
2
emissions of a Cloud
VM to the final user.
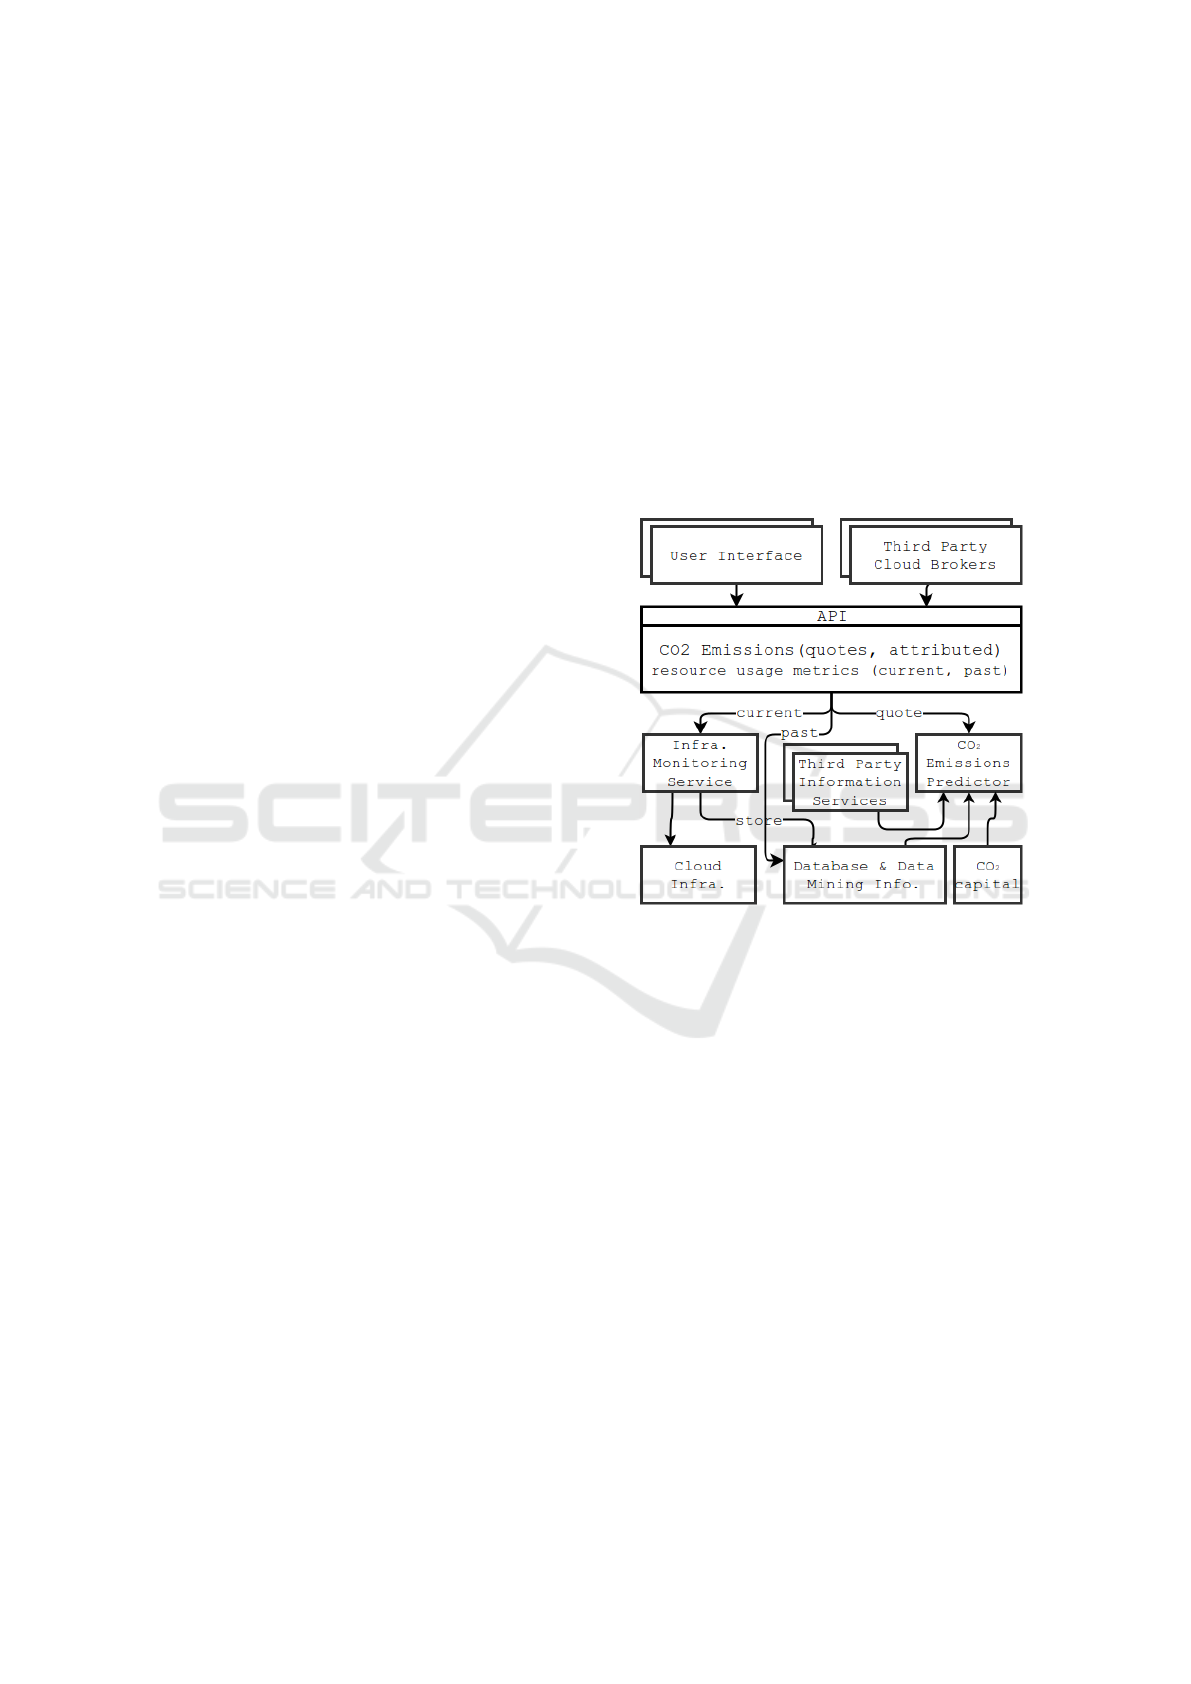
4 PROPOSED ARCHITECTURE
Figure 1 presents the high level architecture for en-
abling a provider to attribute CO
2
emissions to end-
users. This system allows users to access informa-
tion about resource usage (past and present), CO
2
emissions (estimated and attributed) for the VMs they
run, and to quotes for CO
2
emissions that will be
attributed to their future usage. Moreover, external
services named Third Party Cloud Brokers can select
platforms emitting the smallest amount of carbon be-
tween several Cloud providers to execute an applica-
tion.
Figure 1: High level architecture of a CO
2
emissions ac-
counting framework.
In order to accurately predict the carbon emis-
sions, the system needs to compute current and histor-
ical data. The current data is retrieved by communi-
cating with the Infrastructure Monitoring Service and
Third Party Information Services components. The
historical data comes from the Database and Third
Party Information Services. These components are
presented in details below.
4.1 Infrastructure Monitoring Service
The Infrastructure Monitoring Service accesses the
underlying hardware and software infrastructure
which belongs to the Cloud provider. Thus, it knows
the hardware data of each server: its energy efficiency,
its availability and down times (planned and unex-
pected). As for the software infrastructure, it collects
the amount of resources used by each VM. It is used
to compute a cost per resource type as presented to
the user.
A CO2 Emissions Accounting Framework with Market-based Incentives for Cloud Infrastructures
301

4.2 Third Party Information Services
To increase the accuracy of the carbon emissions pre-
diction, the model gathers information from external
services. They can be of different types and sources.
The electricity power grid service provides informa-
tion about the current Carbon Intensity Factor (CIF).
The CIF represents the amount of carbon emitted for
a given quantity of electricity provided by the power
grid. The value of CIF varies over time depending on
the electricity’s origin (renewable or not). Other in-
formation sources can be used depending on the elec-
tricity used. For instance, weather forecast services
can help predicting the production of solar panels.
4.3 Application Programming Interface
The Application Programming Interface (API) gives
clients access to resource usage metrics for their VMs.
It also provides a quote system that informs the clients
about the CO
2
emissions that will be attributed to
their VMs. The quote system publishes the period for
which the quote is valid, binding the Cloud provider
to attribute CO
2
emissions according to that quote.
This allows clients, who are in control of resource us-
age (i.e. they can deploy additional VMs), to predict
CO
2
emissions that will be attributed to their usage,
enabling them to make provisioning decisions based
only on parameters under their control.
4.4 Database and Data Mining
Information
The data from the Infrastructure Monitoring Service
and Third Party Information Services is gathered and
stored in the Database. The former stores static in-
formation such as the energy efficiency of servers as
well as non-static information such as planned down
time of servers. The Database also saves periodically
information about the current CIF value and the other
third party-related information.
The Data Mining Information provides the data
needed by CO
2
Emission Predictor. It can give the
variation trend of the CIF associated to a specific time
period for instance.
4.5 CO
2
Emissions Predictor
In order to offer quotes, the provider must be able to
forecast resource usage and energy provisioning. The
forecast and quote calculations are based on a mix
of current data and historical data patterns retrieved
by mining data stored in the Database. For example,
records such as the past variation trend of the CIF for
a specific time period can have a significant impact
on the accuracy of the prediction. Prediction accu-
racy can also be increased by including factors that
have an effect on CO
2
emissions. Such factors can
be seasonal changes or the prediction of green energy
availability (wind energy, solar energy).
Internal information is as important as external
information. The Infrastructure Monitoring Service
component allows to figure out which servers are
likely to be available to satisfy a request and their
CO
2
footprint. Some servers may be less energy ef-
ficient and therefore have a greater carbon footprint.
The past carbon emission attribution is gathered from
the Database records. Users can ask for a collection
of their historical carbon emissions for a specific time
period. After data is retrieved from the Database, the
collection is created and sent to the user through the
API.
The prediction algorithm is left to Cloud
providers’ discretion as it is part of the market-based
incentive. They can indeed choose to underestimate
or to overestimate their CO
2
emissions predictions at
some point in order to attract clients. The difference
between the billed cost (depending on the predictions
and policy of the Cloud provider at a given time) and
the real cost is managed by the CO
2
Capital.
4.6 CO
2
Capital
At the infrastructure level, the provider can mea-
sure the total power consumption, and using external
sources, the total CO
2
emissions attributable to its in-
frastructure. Comparing this latter value with the sum
of CO
2
emissions attributed to users provides a way
to measure the difference induced by the Cloud pol-
icy. These differences are accumulated over time in
the CO
2
Capital. In order to keep this capital under
an acceptable threshold, it can be taken into account
by the prediction algorithm, or by a business policy
(not described in the architecture) sitting between the
API and the Predictor. Please note that this capital can
be negative when estimation is too high and thus users
are attributed more CO
2
emissions than attributable to
the infrastructure.
5 DISCUSSION
In this section, we discuss the pitfalls to avoid for im-
plementing the proposed accounting framework.
SMARTGREENS 2017 - 6th International Conference on Smart Cities and Green ICT Systems
302

5.1 Architecture Difficulties
The architecture presented in this paper relies on the
capacity to get real-time information about the energy
sources and their CO
2
intensity at the level of each
Cloud infrastructure. While it is quite easy to get
that information country-wide or to rely on contrac-
tual promises made by the energy provider, it might
be difficult in practice to get that information in the
general case. Indeed, some green energy accounted
for in the country-wide energy mix will probably al-
ready have been sold as such.
A second issue with this architecture is that it does
not include a mechanism to protect an infrastructure
provider from users massively changing their behav-
ior to adapt their workload to the current quote for
CO
2
emissions. This in turn would impact the ac-
curacy of the workload prediction component of the
CO
2
Emission Predictor, always increasing the error
made during prediction. Some form of user behavior
modeling might be necessary to be able to keep pre-
dictions accurate, or some business model component
to link quotes to clients using Service Level Agree-
ments and base quotes not on periods but on expected
resources usage.
5.2 Certification
The presented architecture exhibits good properties
only if the CO
2
Capital stays very low. This is what
ensures that globally all CO
2
emissions estimated for
the infrastructure are passed on to users.
On the one hand, it seems relatively easy to accu-
rately measure power consumption at the infrastruc-
ture level, using the same perimeter as in PUE calcu-
lations, and to certify that value. In the same vein,
a certification authority could independently monitor
power sources, and certify the CO
2
emissions that
need to be attributed to users.
On the other hand, getting a certifiable view of all
CO
2
emissions attributed to users is more complex.
Some form of publicly auditable record of CO
2
emis-
sions attributed to every client must be made avail-
able, raising confidentiality issues. Some form of
block-chain usage might help here (Swan, 2015).
The difference between the CO
2
emissions to at-
tribute and those attributed to clients builds up over
time in the CO
2
Capital. Further work is needed to
understand the properties required for the CO
2
capi-
tal so as to limit side effects in the way CO
2
emissions
are attributed.
At a global scale, our initial thoughts are that the
CO
2
Capital must stay within a few percent of total
CO
2
emissions over a year. Maybe a higher threshold
should be required at the scale of a week, a month,
etc. Another threshold could be set per client, so that
eco-aware clients do not benefit from the presence of
other users that don’t care about CO
2
emissions. This
would avoid shifting all CO
2
emissions to clients that
do not report their carbon footprint, so as to offer un-
realistic reports to eco-aware clients.
5.3 Quotes and Business Logic
We have said very little until now about the contents
of quotes, other than the fact that they give users the
amount of attributed CO
2
per unit of usage of re-
sources over a period of time in the future. We an-
ticipate that providers might want to offer different
quotes for different periods, different quotes for dif-
ferent VM sizes, or for different hardware zones or
regions. The provider could even attempt to sell at a
higher price usage of the part of energy he gets from
renewable sources, in an attempt to partition its user
base between clients for which environmental impact
is important and others. As long as it can stay cer-
tified while doing this, it is possible, thus enabling
a dynamic and competitive eco-system of eco-aware
providers.
5.4 VM CO
2
Emissions
As seen in the related work, the literature has focused
on modeling the power consumption of a single VM.
These models are seldom able to take into account
the infrastructure costs of the VM, for example, the
amount of unusable memory on the VM’s host be-
cause of the effective size of the VM.
With the presented architecture, it only impor-
tant to have an accurate enough VM power model
so that the clients have little opportunity to change
their behavior to beat the system to be attributed less
CO
2
emissions than the system would do. It is impor-
tant to note that there is no value for real CO
2
emis-
sions. The difference does not lie between an ob-
jective value measured after the fact and the value
attributed to a VM according to the quote given to
the client by the provider. It lies between the value
attributed to a VM and calculated using the power
model at the VM level and the one using the power
model at the infrastructure level. As the complete
model takes into account the infrastructure contribu-
tion to power consumption, and that the quote sys-
tem does not, there are optimization opportunities for
clients.
Because the optimization opportunities come
from infrastructure costs more than from inaccu-
rate power modeling, the focus of an infrastructure
A CO2 Emissions Accounting Framework with Market-based Incentives for Cloud Infrastructures
303

provider should be to make its infrastructure energy
proportional, rather than to provide accurate VM
power modeling.
5.5 Passing the Cost Up to the End-user
We have discussed here how CO
2
emissions are at-
tributed to VMs by the infrastructure provider. Be-
cause the VM user has the ability to predict CO
2
emis-
sions as she knows in advance how they will be com-
puted from resource usage counters, she has the abil-
ity to apply the same techniques to pass the costs up
to the different users of her VMs. This can be applied
recursively up to the end user, who is then empowered
with information about the CO
2
emissions attributed
to her usage of computing resources.
6 CONCLUSION
We present in this paper an architecture that allows
users of a Cloud infrastructure to have predictable
CO
2
emissions attributed to their usage while taking
into account the difference between predictions and
estimations of effective CO
2
emissions. If this differ-
ence is kept under a pre-defined threshold, it opens the
way to an eco-system where infrastructure providers
can be certified as providing reasonable CO
2
emis-
sions certificates to users while at the same time giv-
ing predictability to users. This creates a fair playing
field where infrastructure providers compete to attract
eco-aware users in a way such that the complete in-
frastructure costs are taken into account. This should
increase the adoption of green technologies in all as-
pects of datacenter provisioning and therefore, con-
tribute to limiting the impact of IT on GHG.
ACKNOWLEDGEMENTS
This work has been supported by the ECO2Clouds
project (http://eco2clouds.eu/) and was partially
funded by the European Commission under grant
agreement number 318048.
REFERENCES
Bosse, S., Jamous, N., Kramer, F., and Turowski, K.
(2016). Introducing Greenhouse Emissions in Cost
Optimization of Fault-Tolerant Data Center Design. In
IEEE Conference on Business Informatics (CBI), vol-
ume 01, pages 163–172.
Gu, C., Shi, P., Shi, S., Huang, H., and Jia, X. (2015). A
Tree Regression-Based Approach for VM Power Me-
tering. IEEE Access, 3:610–621.
Ismaeel, S. and Miri, A. (2016). Multivariate Time Series
ELM for Cloud Data Centre Workload Prediction. In
International Conference on Human-Computer Inter-
action (HCI), pages 565–576.
Khosravi, A., Garg, S. K., and Buyya, R. (2013). Energy
and Carbon-Efficient Placement of Virtual Machines
in Distributed Cloud DataCenters. In International
Conference on Parallel Processing (EuroPar).
Kim, N., Cho, J., and Seo, E. (2011). Energy-Based
Accounting and Scheduling of Virtual Machines in
a Cloud System. In IEEE/ACM International Con-
ference on Green Computing and Communications
(GreenCom), pages 176–181.
Kurpicz, M., Orgerie, A.-C., and Sobe, A. (2016). How
much does a VM cost? Energy-proportional Account-
ing in VM-based Environments. In Euromicro In-
ternational Conference on Parallel, Distributed, and
Network-Based Processing (PDP), pages 651–658.
Natural Resources Defense Council (2014). Data Cen-
ter Efficiency Assessment. NRDC Issue Paper,
https://www.nrdc.org/sites/default/files/data-center-
efficiency-assessment-IP.pdf.
Nordhaus, W. D. (2012). Carbon Taxes to Move Toward
Fiscal Sustainability, pages 208–214. Columbia Uni-
versity Press.
Sharma, N., Gummeson, J., Irwin, D., and Shenoy, P.
(2010). Cloudy Computing: Leveraging Weather
Forecasts in Energy Harvesting Sensor Systems. In
IEEE Conference on Sensor, Mesh and Ad Hoc Com-
munications and Networks (SECON), pages 1–9.
Sharma, N., Sharma, P., Irwin, D., and Shenoy, P. (2011).
Predicting Solar Generation from Weather Forecasts
Using Machine Learning. In IEEE International Con-
ference on Smart Grid Communications (SmartGrid-
Comm), pages 528–533.
Swan, M. (2015). Blockchain: Blueprint for a new econ-
omy. ” O’Reilly Media, Inc.”.
Wajid, U., Cappiello, C., Plebani, P., Pernici, B., Mehand-
jiev, N., Vitali, M., Gienger, M., Kavoussanakis,
K., Margery, D., Garc
´
ıa-P
´
erez, D., and Sampaio, P.
(2015). On Achieving Energy Efficiency and Reduc-
ing CO2 Footprint in Cloud Computing. IEEE Trans-
actions on Cloud Computing, PP(99):14.
Wu, W., Lin, W., and Peng, Z. (2016). An Intelligent
Power Consumption Model for Virtual Machines Un-
der CPU-intensive Workload in Cloud Environment.
Soft Computing, pages 1–10.
Xiao, P., Hu, Z., Liu, D., Yan, G., and Qu, X. (2013). Virtual
Machine Power Measuring Technique with Bounded
Error in Cloud Environments. Journal of Network and
Computer Applications, 36(2):818–828.
Yang, H., Zhao, Q., Luan, Z., and Qian, D. (2014). iMe-
ter: An integrated VM power model based on perfor-
mance profiling. Future Generation Computer Sys-
tems, 36:267 – 286.
SMARTGREENS 2017 - 6th International Conference on Smart Cities and Green ICT Systems
304
