
Traffic Accidents Analysis using Self-Organizing Maps and
Association Rules for Improved Tourist Safety
Andreas Gregoriades
1
and Andreas Chrystodoulides
2
1
Cyprus University of Technology, Limassol, Cyprus
2
European University Cyprus, Nicosia, Cyprus
Keywords: Tourists Safety, Self-Organizing Maps, Association Rules.
Abstract: Traffic accidents is the most common cause of injury among tourists. This paper presents a method and a tool
for analysing historical traffic accident records using data mining techniques for the development of an
application that warns tourist drivers of possible accident risks. The knowledge necessary for the specification
of the application is based on patterns distilled from spatiotemporal analysis of historical accidents records.
Raw accident obtained from Police records, underwent pre-processing and subsequently was integrated with
secondary traffic-flow data from a mesoscopic simulation. Two data mining techniques were applied on the
resulting dataset, namely, clustering with self-organizing maps (SOM) and association rules. The former was
used to identify accident black spots, while the latter was applied in the clusters that emerged from SOM to
identify causes of accidents in each black spot. Identified patterns were utilized to develop a software
application to alert travellers of imminent accident risks, using characteristics of drivers along with real-time
feeds of drivers’ geolocation and environmental conditions.
1 INTRODUCTION
The increase of tourism has implied a rise in tourism-
associated casualties, with vehicle crashes as the most
common cause of injury for tourists (Rossello et al,
2016). Traffic Accidents is one of the most significant
causes of fatalities and injuries worldwide. According
to World Health Organization (WHO, 2015), over
1.25 million people dies daily and millions more are
seriously injured. Among these casualties a high
percentage are tourists. According to the literature,
vehicle crashes is the most common cause of injury
for tourists (Bentley et al., 2001), (Howard, 2009),
(Page and Meyer, 1996) and (Page, 2009). Tourist
drivers belong to a special type of drivers that are not
aware of possible, or even known road-hazards, and
hence are more vulnerable to accidents. Poor
knowledge of the road network and local traffic rules,
in combination with insufficient driving skills
increase accident risk (Yiannis et. al, 2007).
Therefore tourism can be associated with a significant
amount of traffic accidents (Rossello et al, 2016).
As reported in (WHO, 2015), accident fatalities is
the number one cause of deaths for young people
between the age of fifteen and twenty-nine, and the
ninth cause of death for all age groups worldwide. An
indirect consequence of these large numbers of
deaths, injuries and disabilities, is the financial
burden that falls not only on individual families but
also at the national level. The impact on countries’
economies worldwide, reaches an average 3% of the
gross domestic product. There is a number of
approaches to automatic accident detection. These
can be divided into: predictive and descriptive
techniques (Berry et al, 1997). Descriptive data
mining techniques for cluster analysis is used to
divide heterogeneous data into several homogeneous
classes or clusters (Depaire et al, 2008).
A significant amount of research activities is
conducted in the area of accident forecasting using
data mining (Mahdi et al, 2013), (Sun et al, 2014)
(Tambouratzis et al, 2010). The main goal has been
to invent accurate mechanisms for accident
prediction. In our previous work (Gregoriades, 2013)
we combined Bayesian Networks with a Dynamic
Traffic Assignment Simulator to identify black spots
in Nicosia, Cyprus. This paper is a continuation of
that work and concentrates on the application of
clustering and association rules, for the identification
and analysis of accident black spots. Historical traffic
accidents data, occurred between 2004 and 2014 in
Nicosia, Cyprus, is analysed to distil patterns for the
452
Gregoriades, A. and Christodoulides, A.
Traffic Accidents Analysis using Self-Organizing Maps and Association Rules for Improved Tourist Safety.
DOI: 10.5220/0006356204520459
In Proceedings of the 19th International Conference on Enterprise Information Systems (ICEIS 2017) - Volume 1, pages 452-459
ISBN: 978-989-758-247-9
Copyright © 2017 by SCITEPRESS – Science and Technology Publications, Lda. All rights reserved

specification of heuristic rules necessary for the
development of a mobile accident warning
application for tourist drivers. The app utilises the
aforementioned knowledge, in combination with real
time situational factors obtained from the tourist’s
mobile device sensors. The main contribution lies to
the personalised warnings provided by the
application, depending on driver’s characteristics,
spatiotemporal state and dynamically assessed
environmental conditions.
The paper is organized as follows. Firstly a review
of the literature is presented followed by an overview
of the methodology. Subsequently, the steps followed
to clean and pre-process the accident data are
explained, along with the application of a self-
organizing-maps and association rules to identify
patterns in each SOM cluster. Next follows the
description of a mobile application that warns
tourists’ drivers of possible accident risks. The paper
concludes with a summary and future directions.
2 RELATED WORK
Clustering methods is a type of Data mining
techniques that are important in identifying groups of
records which are characterised by common features.
Hence, cluster analysis is a statistical technique that
groups items together on the basis of similarities or
dissimilarities (Anderberg, 1973). Clustering has
been used extensively for market segmentation (Liu,
2012). In traffic analysis, combination of cluster
analysis, regression and GIS was used to group
similar accident data, to assess the risk of traffic
accidents (Ng, Hung and Wong 2002). Despite the
fact that statistical models have been widely used to
analyse road crashes, certain problems may arise
when analysing datasets with large dimensions
(Chen, 2002). In such cases data mining is used that
extract implicit, previously unknown, and potentially
useful information from large amounts of data
(Frawley et al, 1991). When dealing with a large and
complex datasets, the use of data mining methods
seems particularly useful to identify the relevant
variables that make a strong contribution towards a
better understanding of accident conditions.
Similarly with (Gregoriades, 2013), Sun (2015)
proposed a method for real time accident prediction
using a Dynamic Bayesian Network (DBN) to handle
spatiotemporal time-series crash data in combination
with traffic data (speed, flow and occupancy)
collected from highways in Shanghai in China. Their
DBN achieved a crash prediction accuracy of 76.4 %
with a false alarm rate of 23.7%. Moreover, Pei Liu
(2009) used Self Organizing Maps (SOMs) and Data
Mining (DM) models to analyse liability attributions
of car accidents and developed a Decision Support
Tool based on previous similar crash cases, which
could be used by insurance companies to achieve fair
liability authentications and compensation
attributions. The DM model achieved a 65% accurate
authentications for rear collisions and 73% and 82%
for frontal and side collisions respectively. The
decision support tool they developed, appeared to
provide helpful information for similar collision
cases. Alikhani (2013), used a hybrid approach of
clustering and classification methods to check if the
pre-clustering of data can improve the accuracy for
classifying the severity of road accidents. They used
K-means and SOMs for clustering and ANN with
Adaptive Neuro Fuzzy Inference for classification.
Their results showed that pre-clustering improved the
results’ accuracy. In all combinations of the above
methods, the hybrid model accuracy was higher than
using individual classification methods, with the
highest accuracy being achieved by pre-clustering
data using SOM, followed by a classification model
using ANN.
Another study by Kassawat (2015), also engage
the problem of identifying potential accident prone
locations on a map, based on user input. They
developed an interactive web based system that used
an integrated Poisson Regression model and a Multi-
attribute Decision Making tree based on the Decision
Expert approach. Their developed system allows
users to enter weather and time information to
produce a Google Map depicting high risk points.
Each point was categorized in 3 levels of risk namely,
green for low risk, yellow for moderate and red for
high risk. In another related work, Hoon Kwon
(Kwon, 2015), used data from California Highway
Patrol to compare two classification methods, Naïve
Bayes and Decision Trees, to reveal the relative
importance of the risk factors with respect to accident
severity. The Naive Bayes method did not consider
dependencies among the risk factors, whereas
decision trees did. They used two scoring algorithms
to rank the risk factors and their results showed that
Decision Trees outperformed the Naïve Bayes model,
concluding that dependencies among risk factors are
important. Work by Miao Chong, (2005) compared
the performance of Artificial Neural Nets (ANN),
Decision Trees, and Support Vector Machines to
predict injury-severity of accidents. Their results
shown that combination of machine learning
techniques yields better results. Specifically, the
hybrid Decision Tree-ANN outperformed the other
two approaches.
Traffic Accidents Analysis using Self-Organizing Maps and Association Rules for Improved Tourist Safety
453
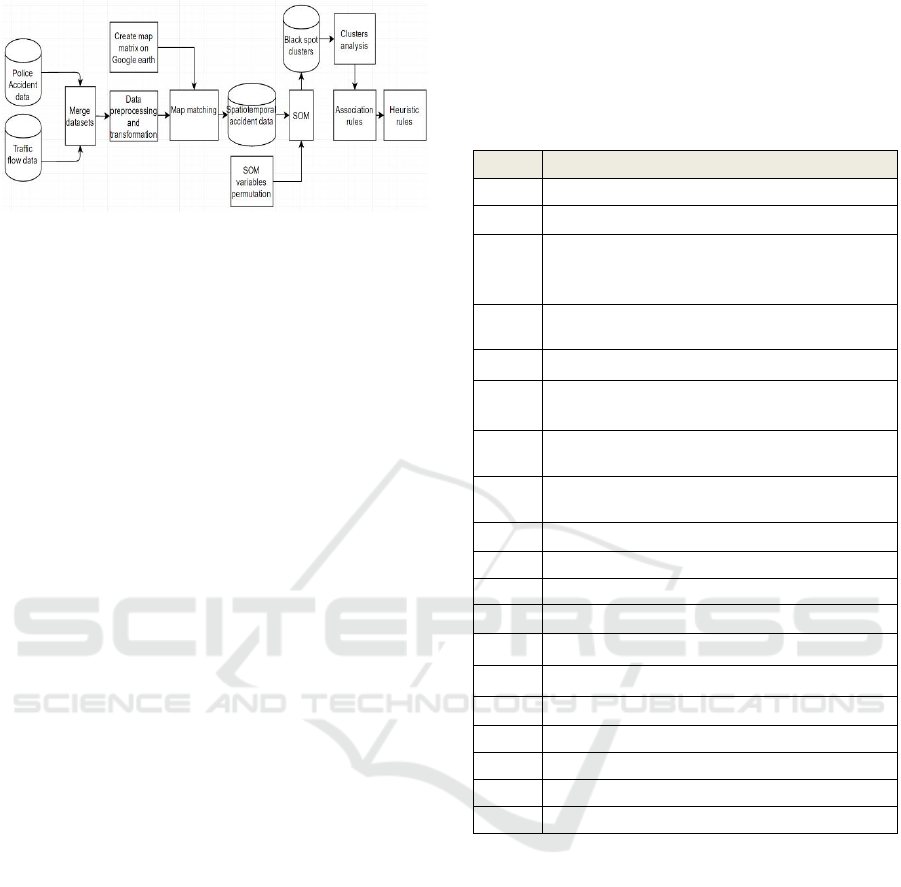
Figure 1: Data analysis Methodology.
3 DATA ANALYSIS
METHODOLOGY
The purpose of this study was to analyse historical
road accidents data from the Cyprus Police, to
identify black spots on the road network of Nicosia to
discover patterns that describe causes of accidents.
Based on the literature above, combination of
techniques seems to outperform single method
approaches (Mahdi et al, 2013). Hence, the method
proposed herein utilises two machine learning
techniques aiming to firstly identify the main clusters
of traffic accidents in Nicosia using a combination of
input parameters, and subsequently to pinpoint the
factors that significantly affect accidents for each
cluster. The knowledge distilled from this process
was used to develop an accident prediction model that
embedded in an application, used to inform tourists of
possible accident risks on a real-time basis.
The methodology followed is diagrammatically
depicted in Figure 1. The main steps in the process
include the integration of accident data with traffic
flow data from a traffic simulator as per our previous
work (Gregoriades et al, 2013). Subsequently, pre-
process the resulting dataset to eliminate outliers and
reduce the dataset’s dimensionality as explained next.
Finally perform cluster analysis and association rules
extraction on the clusters that emerged. The distilled
knowledge was utilised to specify the tourist accident
warning application.
3.1 Data Pre-processing
The original accident dataset contained 21179
accident records occurred in Nicosia, Cyprus between
2004 and 2014. An accident record contained 47
variables, each associated with multiple attributes.
The variables were grouped in the following
categories: environment, infrastructure, driver and
vehicle. Pre-processing and data transformation was
performed to convert the data in the desired format
based on the rules of Table 1. These rules have been
specified by a traffic safety expert. The study focused
on the town of Nicosia, hence the data was selected
accordingly from the original dataset.
Table 1: Pre-processing rules.
V
ariable
Name
Variable states
Day
1 for Sunday, 2 for Monday, 3 for Tuesday, …, 7 for Saturda
y
Time
1 for 11am-1.59pm, 2 for 2-4.59pm, 3 for 5 to 7.59pm, 4 for 8-10.59pm, 5 for
11-1.59am, 6 for 2-4.59am, 7 for 5-7.59am, 8 for 8-10.59am
Facto
r
1 for mental state of drive
r
2 for driver inability old fields 8, 10-11, 16-17, 26, 31-33, 35,
3 for carelessness old fields 9, 12-15, 18-25, 27-20, 34, 36-42,
4 for vehicle fault old fields 43-52,
5 for environmental cause old fields 53-66)
Traffic
control
1 for none and traffic signs out of order, 2 for stop sign, give way sign and
roundabout, 3 for police and traffic signals (both traffic signals and police as
well as flashing traffic signals do not appear in the records
Road
Width
1 for <7m, 2 for 7-10m, 3 for >10m
Diagram
code
fields 1-10 ca
r
-to-car, namely 1 for nose to tail, 2 for overtake, 3 for frontal, 4
for side, 5 for one car stationary, 6 for angle, 7 for runoff, 8 for object, 9 for
other, 10 for pedestrian involved, 11 for other
Junction
type
1 for intersection of two or more roads, 2 for T-
j
unction, 3 for staggered
junction, 4 for Y-junction, 5 for roundabout, 6 for slip road, 7 for other, 8 for no
junction
Barrie
r
1 for none, 2 for single broken, 3 for single or double continuous single, 4 for
island (ghost island, with or without physical barrier), 5 for combination of the
above
Road
works
1 for yes, 2 for no
Bus stop
1 for yes, 2 for no
Ligh
t
1 for daylight, 2 for dawn, 3 for dusk, 4 night-street lit, 5 for night-street unlit,
Road
description
1 for straight and flat, 2 for straight and not flat, 3 for curved
Pavement
type
1 for good, 2 for bad
Weathe
r
1 for dry, 2 for othe
r
A
ccident
Type
1 for fatal, 2 for serious, 3 for light and damages only
Speed
1 for high 2 for low
Traffic flo
w
1 for high, 2 for average, 3 for low
A
ge
1 for <18, 2 for 18-35, 3 for 36-55, 4 for >56
Gende
r
1 for Male, 2 for Female
During pre-processing no missing values were
identified, but some outliers (extremely high speed
i.e. >160 Km/h and traffic flow i.e. greater than the
capacity of the road section) were discovered and
were excluded from the dataset. Four accident types
were available, namely, fatal, serious, light injuries,
and damage-only. The last two types were merged
into one, so three types of accidents were used.
Accident time was converted into interval times as
shown in Table 1. Accident point was only used to
identify the geographic location (coordinates) of
accidents as described later in map-matching
Accident data.
ICEIS 2017 - 19th International Conference on Enterprise Information Systems
454
3.1.1 Map Matching Accidents to
Geolocation
Due to the unavailability of the geospatial coordinates
of accidents’ locations, the accident data had to
undergo processing and map-matching onto a GIS
system. The original dataset as was obtained from the
Police, was plotted on a hardcopy map divided into
squares and populated with accident locations.
Hence, it had to be converted into an electronic form
to enable its processing. Specifically, a variable X in
the dataset, encoded the x/y coordinates of the
accident on the hard-copy map. The first letter and the
subsequent two digits of X corresponded to a square
on a map, while the last two digits to the road-link in
the matching square, where the accident occurred. To
avoid manual entry of each individual accident on the
GIS system, accidents were grouped according to the
box they belonged based on their XY coordinates. For
instance, for an accident with X value of ‘M1201’, the
last two digits were ignored and the accident was
assigned a new value of ‘M12’ representing the id of
the box on the map. To achieve that, we used Google
Earth to geotag the GPS coordinates of each box from
the original hard copy version of the map. To do that
the two end points of each square were used. The
upper left and lower right corner that formed the
diagonal of each box. This was done for all boxes on
the road network, resulting in the map depicted in
Figure 2. Subsequently, the coordinates were
exported from Google Earth in a KML format and
imported in ArcMap from where it was again
exported in an .xml format and subsequently
converted in excel format. In order to make
consecutive work easier, we used the coordinates of
the midpoint of the diagonal of each square, as the
coordinates of each box.
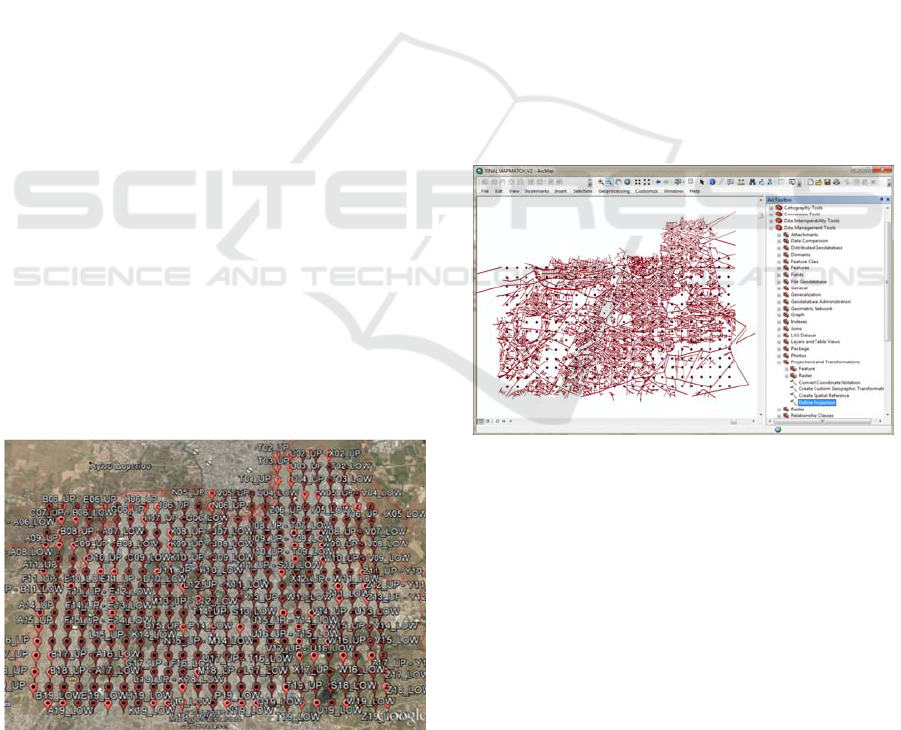
Figure 2: Map of Nicosia overlaid with tags of centroids of
the segmented road network.
To do this we added the longitude and latitude
coordinates that described the two diagonal corners of
each square and divided these by 2. This yielded one
set of coordinates for each square and for the
accidents that falls within that square. Finally, an
algorithm was devised in MatLab to assign each data-
point from the pre-processed dataset to its
corresponding box. Accidents that fallen outside the
modelled map boundaries were ignored. The resulting
number of accidents modelled using this coordinate
system was 13327.
To enhance accident records with traffic flow
information at the time of the accident, ArcMap was
also used. Essentially, mapping accident location
with the road link on a simulation model and from
there retrieving the traffic flow for that link at the time
of accident. The source was the shape files provided
by our previous work (Gregoriades, 2013). Shape file
is a common data file format for GIS software and it
is stored as a set of related files. It can spatially
describe features like points, lines and polygons that
may represent roads, rivers, lakes etc. The graphical
representation of the shape file with the overlaid
centroids of each of the squares is depicted in Figure
3.
Figure 3: ArGIS map with centroids for each accident box.
3.2 Self-Organizing Maps
Clustering is used in market segmentation (Smith,
1956) to provide a conceptual view of heterogeneous
markets (Liu et al., 2012). Clustering approaches aim
to classify data records into different groups.
Numerous clustering methods exist and are divided
into hierarchical and partitioning techniques i.e.
DBSCAN, Expectation Maximisation, K-means. The
latter however was criticised in accurately detecting
clusters when these do not have spherical shape (Tan
,2006). Moreover, these techniques lack appropriate
visualisation metaphors. On the contrary SOM
provides the analyst with an intuitive visualisation
Traffic Accidents Analysis using Self-Organizing Maps and Association Rules for Improved Tourist Safety
455
that enables the interpretation of its results.
Essentially, SOM is a special case of Artificial Neural
Networks. More specifically, SOM can identify
patterns and cluster data by identifying common
features. SOM produces a low-dimensional
representation of the input space of the training data,
called a map and belong to the category of
unsupervised competitive learning algorithms for
which, no human intervention is required.
The general idea of a SOM is to take an input
matrix NxM of N variables and M occurrences of
each variable, and parse it into the SOM topology
(usually a two dimensional grid or map). Using a
neighbourhood function, neurons organize
themselves forming clusters on the output SOM
topology. In SOM algorithm, the output neurons
compete between themselves against the
characteristics of an input vector that describe the
variables of the problem. Only one neuron is activated
at any given time during a SOM process cycle. The
activated neuron is called the winning neuron (or Best
Matching Unit - BMU). Hence, each occurrence of
the variables-set (also called input vectors) is
eventually assigned to a cluster. Input vectors that are
similar are grouped into clusters on the output SOM
topology. To achieve this competition, there are
feedback paths between the neurons which in return
force neurons to organize themselves. The aim in
SOM learning is to cause different parts of the
network to respond similarly to certain input patterns.
Each neuron is a node on the network and is
associated with a weight vector that describes its
similarity to the input vector. Every node of the SOM
is examined to identify the one whose weight is most
similar to the input vector. An activated neuron is
called the winning neuron or BMU and is the most
similar to the input vector. The input data X is parsed
into an M = [m1,m2] topology as shown in Figure 4.
Each cell of the input vector X(n) is fully connected
to all nodes of M. The lines connecting the input
vector with the output topology represents a weight
vector W(n,k) and have the same dimension as the
input vector. W(n,k) specifies the connection weights
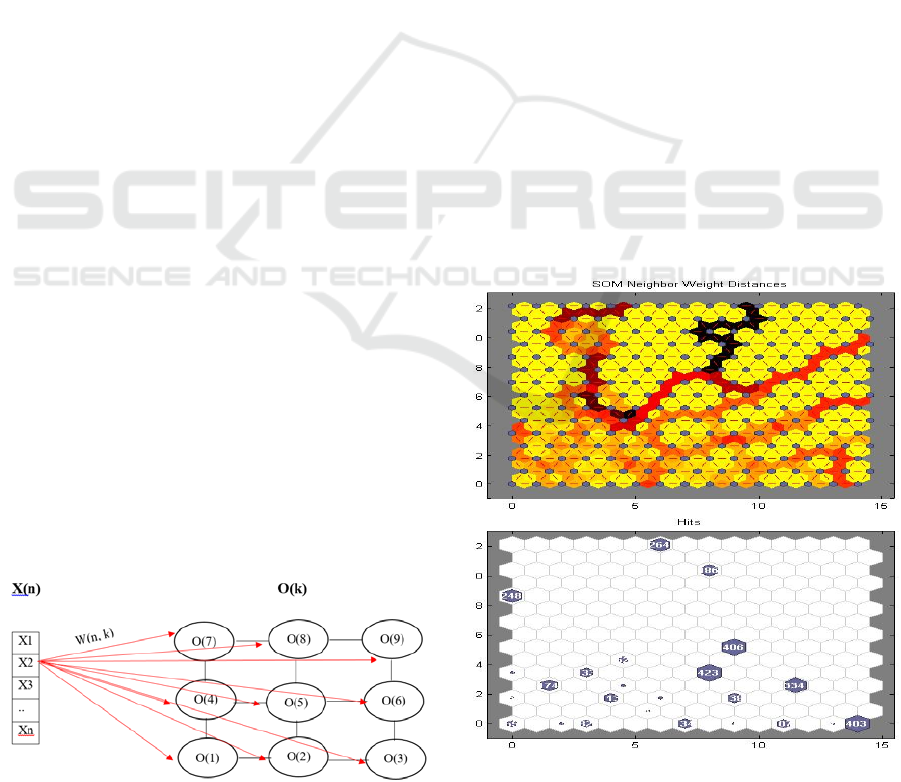
Figure 4: Representation of Input to SOM Topology.
between the input X(n) and the neurons k in the output
topology O(k).
The algorithm used in SOM is the following: firstly
initialize the connecting weight vectors of neurons
with random values. Then, a vector X(i) from the input
accident dataset is randomly chosen and presented to
the SOM topology. The weights of all neurons of the
topology are examined to find the ones that are closest
to the input vector-BMU. The neuron which is closest
(distance) to the input vector wins the competition.
The neighbouring nodes’ weights are adjusted so that
they get closer to the input vector. The change of the
weights of the neighbouring neurons depend on how
close they are to the winning neuron. The process is
repeated for number of epochs (iterations) specified by
the user.
To determine the BMU, the most common method
is to calculate and compare the Euclidean Distance of
each and every neuron’s weight vector and compare
it with the randomly selected input vector. The neuron
that has the smallest Euclidean Distance from the
Input vector is the BMU.
Matlab’s Neural Network Toolbox was used to
run the SOM analysis on the accident dataset. A
15x15 SOM Topology was used to give flexibility to
the algorithm to clearly create the desired clusters.
The algorithm run for 1000 epochs. All combinations
of variables were used during SOM analysis. All
variables were specified in accordance to accidents’
geospatial coordinates
Figure 5: SOM Neighbour Weight Distances (up) and SOM
Hits plot for Accident-Type and Accident-time variables.
ICEIS 2017 - 19th International Conference on Enterprise Information Systems
456
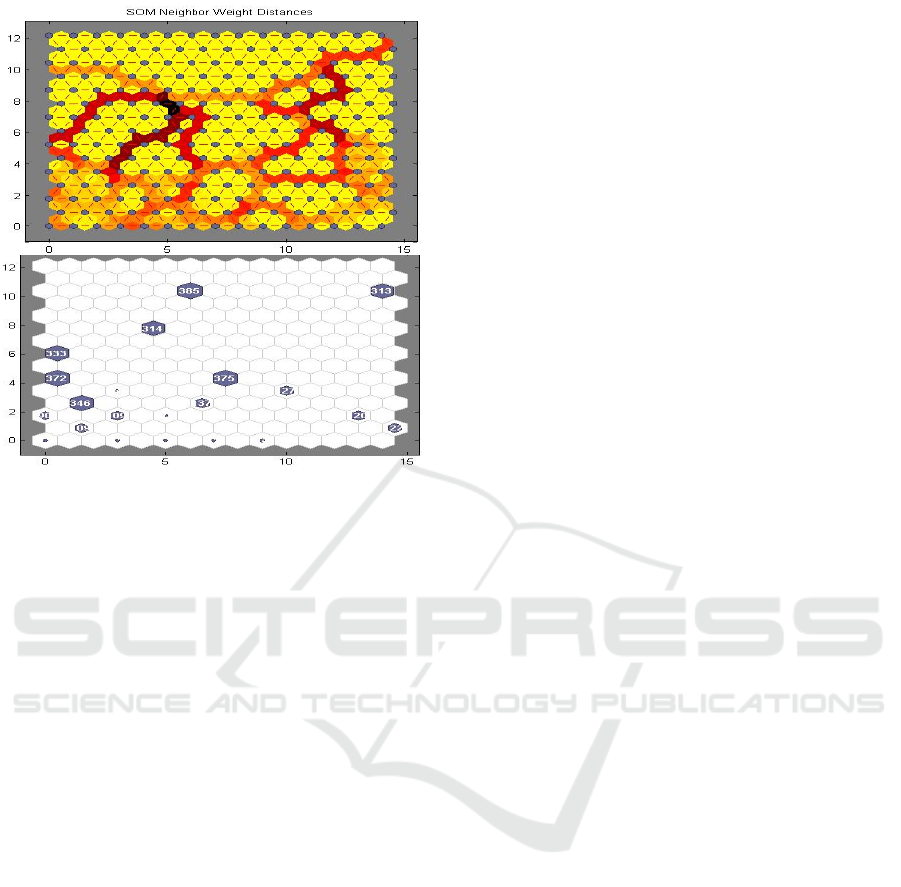
Figure 6: SOM Neighbour Weight Distances (up) and SOM
Hits plot for Accident-Type and Accident-day.
4 RESULTS
SOM analysis was performed with all combinations
of variables to identify the variables that yield
significant clusters. Hence, a permutation algorithm
was devised in Matlab to perform SOM analysis with
all possible combinations between the dependent
variable Accident-Type and the rest of variables, to
find which sets of variables are related based on Hits
and Significance plots.
A subset of the clusters that yielded from the
analysis are depicted in Figures 4 and 5. The “SOM
Neighbour Weight Distances” depicts the distances
between the neighbouring neurons. Grey dots
represent the neurons (clusters), while red lines
connecting neighbouring neurons and the colours that
surrounds the red lines represent how similar a neuron
is to its neighbour. Dark colours represent large
distances between neurons which indicate
dissimilarity and lighter colours represent closer
distances which indicate similarity. Continuous lines
with dark colours (borders) indicate that the network
has segmented inputs into groups of clusters where
each group has different features. The “SOM Hits
plot” indicates how many instances (vectors) of the
input data are associated with each neuron (cluster
centre), as well as the neuron location. Specifically
for the Accident Type and Day variables, SOM
created 21 distinct clusters and for Accident Type and
Time variables, SOM created 24 clusters. The ‘SOM
Hits plot’ show the various number of hits per cluster
for each SOM. Matlab provided an output array list
for the cluster ID for each accident. These lists were
exported in two datasets and then utilised in excel to
find the accidents in each clusters. These were used
as the baseline for the creation of the heat map (Figure
5 & 6) by filtering each cluster according to day and
time and subsequently importing these into Fusion
Tables for the creation of the Maps.
After the creation of the Maps, the application
interface was created to visualise the heat maps. This
was essential for the validation of the results by
experts. The application used the System’s Date and
Time to project the respective heat map according to
the user’s selection. The available options of Heat
Maps from which the user can select. After selecting
a choice from the interface, the relevant heat map is
projected in Google Maps as in Figure 7. The user has
the ability to zoom-in and see in more detail the black
spots.
4.1 Patterns Identification
To identify patterns in each black spot, the associated
records of accidents that belong to the black spot
retrieved from each cluster dataset, and accordingly
an Association rules algorithm was used to identify
the patterns. The association rules algorithm used is
the Apriori algorithm (Bayardo, 1998) since it is
considered mainstream. The Apriori algorithm uses
the support and confidence measures to generated
valid association rules. Support is the percentage of
instances of records in the dataset for which a pattern
(rule) is true. For example the support for the
association rule A->B is the total number of instances
containing both A and B divided by the number of
total instances of the dataset. Confidence is the level
of certainty that describes each discover pattern. For
example the confidence for the rule A->B is the
number of instances containing both A and B divided
by the number of instances containing A.
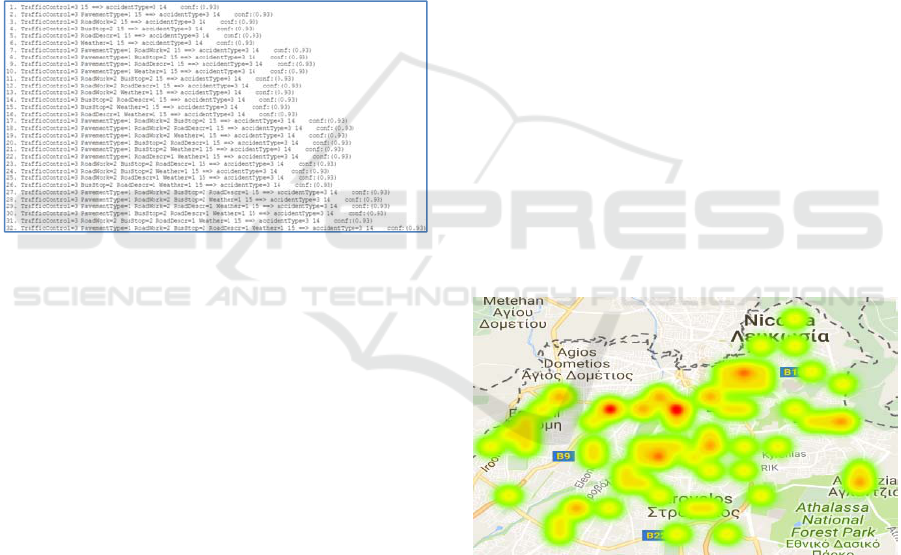
The patterns that emerge from the analysis of one
black spot are depicted in Fig 7. Essentially, the rules
highlight the importance of gender, age, day of the
week, time, traffic control, and distractions such as
road works, bus stops and bad weather. Hence, most
accident occur by younger male drivers, at signalised
intersections in the particular black spot area. The
effect of bad weather, bus stopping or having to
diverse due to road works has also a negative effect
on accident risk. Therefore, tourists that use the
application will be warned of the type of accidents
that are more likely to have, given their characteristics
Traffic Accidents Analysis using Self-Organizing Maps and Association Rules for Improved Tourist Safety
457
and properties of the environment at each given point
in time and space. At first instance the application
does not utilise the driver’s speed. This can be easily
retrieved by the application from the mobile’s build
in sensors.
To enhance the validity of the study, mined rules
have been confirmed by 2 traffic safety experts that
verified their rationality. These rules are used as the
basis for the development of a prototype prediction
engine of the mobile accident warning system for
tourists in. Essentially, given the characteristics of the
tourist driver, such as :age and gender, and in
combination with information regarding the day,
time, weather conditions and gps coordinates, the
application fishes out of its database the rules that
apply to that situation and accordingly warns the
driver.
Figure 7: Association rules that emerged for the analysis of
a specific black spot.
5 APPLICATION FOR
IMPROVED TOURISM SAFETY
The main usage of the application is to warn tourist
drivers of imminent risk on the road network of
Nicosia. The application utilised the build-in
capabilities of mobile phones to recognise
geolocation and travelling speed, and accordingly in
combination with information regarding time and day
of the week, analyses the risk and present the user
with possible warnings. For the system to be able to
warn drivers it was essential to create a
spatiotemporal analysis of the black spots on the road
network of Nicosia. This prerequisite the
development of a temporal heat-map using the
historical data as described previously.
For the generation of the accident black spots
heat-maps, we utilised the Fusion-Tables tool
provided by Google. The pre-processed data was
analysed using SOM and the output for each input set
was imported into the tool to create a series of heat
maps for all combination of variables, for the Nicosia
network. Geolocation data was used as input, along
with accident related information. The black spots on
heat maps are identified using the neighbouring
distances matrix and hits plot. These designate
geographical locations with large number of hits
(counts) compared to other locations. The clusters
identified with SOM, for all combinations of input
datasets, were imported in fusion-tables to create a
series of heat maps. Each map was associated with a
set of features that describe the situations i.e., age of
driver, day, time etc. These associations were used in
the developed Matlab application, to visualise the
results according to user properties. Specifically, the
Matlab Graphical User Interface Design Environment
(GUIDE) was utilised to create the application
interface. The applications was created in the form of
a package and an installation wizard, which enables a
third party user to download and install a free Matlab
Runtime Environment (MRE), to run the application.
An illustration of the interface of the developed
application is depicted in Fig 8, which shows the heat
map for young drivers associated with light crashes.
Different SOMs, and their associated heat maps are
utilised by the application depending on the features
entered by the user, regarding the driver age, gender
etc. Properties that refer to the environment are
dynamically inferred from the situation such as: the
day, time and weather conditions (from web
services).
Figure 8: Heat map for light accidents occurring in Nicosia
in the years 2004-2014.
6 CONCLUSIONS
In this study, we demonstrated the use of SOM for the
analysis on traffic accident data, which were then
used to identify the black spot for the city of Nicosia,
Cyprus. These were subsequently analysed using
association rules to identify patterns that were used to
specify heuristic rules for an application that warns
ICEIS 2017 - 19th International Conference on Enterprise Information Systems
458

tourist drivers of potential accident risks. For this
goal, various tools were used: Matlab’s, Weka,
ArcGIS, Google earth and Fusion. The output of this
analysis was used to develop a prototype application
to warn tourist of potential accident risks based on
contextual information that could be obtained from
gps coordinates and user’s characteristics.
Our future work aims to fully realise the mobile
application and integrate its functionality with web
services such as weather and temperature, to enhance
the contextual information that describe driver’s
situation. This in combination with the knowledge
distilled from this study will provide the means to
dynamically calculate the risk of accident occurrence.
An evaluation study will follow to assess the
effectiveness of the system on tourism safety, plus the
distractive effect on drivers.
REFERENCES
Anderberg M. Cluster analysis for applications, 1973,
Academic Press.
Gregoriades A, Mouskos K, 2013. Black spots
identification through a Bayesian Networks
quantification of accident risk index. Transportation
Research Part C 28, 28-43.
Bayardo Jr, Roberto J. (1998). Efficiently mining long
patterns from databases. ACM SIGMOD, 27 (2).
Bentley et al., 2001, Recreational tourism injuries among
visitors to New Zealand: an exploratory analysis using
hospital discharge data, Tourism Management, 22
(2001), pp. 373–381.
Berry MJA, Linoff G. Data Mining Techniques: For
Marketing, Sales, and Customer Support. New York,
NY, USA: Wiley, 1997. 2135 DOGRU and
SUBAS¸I/Turk J Elec Eng & Comp Sci.
Chen, W. and Jovanis P. (2002) Method for identifying
factors contributing to driver-injury severity in traffic
crashes, Transportation Research Record 1717 1-9.
Depaire B, Wets G, Vanhoof K. Traffic accident
segmentation by means of latent class clustering.
Accident Anal Prev 2008; 40: 1257–1266.
Frawley, W. J., Piatetsky-Shapiro, G., Matheus, C. J.,
Knowledge Discovery in Databases, AAAI/MIT Press,
1-27(1991).
Howard, 2009, Risky business? Asking tourists what
hazards they actually encountered in Thailand, Tourism
Management, 30 (2009), pp. 359–365.
Sun J, Jian Sun, 2015. A dynamic Bayesian network model
for real-time crash prediction using traffic speed
conditions data. Transportation Research Part C 54,
176-186.
Kassawat S., Sunya S, Vatanavongs R, 2015. Integration of
Spatial Models for Web-based Risk Assessment of
Road Accident. Engineering and Physical Sciences 8,
671.
Lee, C., Saccomanno, F. and Hellinga B. (2002). Analysis
of Crash Precursors on Instrumented Freeways,
Proceedings of the Transportation Research Board,
Washington D.C.
Liu, Y, Kiang, M., Brusco, M. (2012). A unified framework
for market segmentation and its applications, Expert
Systems with Applications, 39, (11), 1 September,
10292–10302.
Mahdi A., Ali N, 2013. Presentation of clustering-
classification heuristic method for improvement
accuracy in classification of severity of road accidents
in Iran. Safety Science 60, 142-150.
Miao Chong, Ajith Abraham and Marcin Paprzycki, 2005.
Traffic Accident Data Mining Using Machine Learning
Paradigms. Informatica 29, 89–98.
Kwon H, Wonjong Rheeb, Yoonjin Yoona, 2015.
Application of classification algorithms for analysis of
road safety risk factor dependencies. Accident Analysis
and Prevention 75, 1-15.
Page, Meyer, 1996, Tourist accidents an exploratory
analysis, Annals of Tourism Research, 23 (3) (1996),
pp. 666–690.
Liu P, 2009. A self-organizing feature maps and data
mining based decision support system for liability
authentications of traffic crashes. Neurocomputing 72,
2902-2908.
Rossello, Jaume, Saenz-de-Miera, 2011, Road accidents
and tourism: The case of the Balearic Islands (Spain),
Accident Analysis and Prevention. 43(3),675-683.
Smith, W. R. (1956). Product differentiation and market
segmentation as alternative marketing strategies. The
Journal of Marketing, 21(1), 3-8.
Tambouratzis T, Souliou D, Chalikias M and Gregoriades
A., Combining probabilistic neural networks and
decision trees for maximally accurate and efficient
accident prediction, IJCNN, Barcelona, 2010, pp. 1-8.
WHO. Global Status Report on Road Safety 2015.
Yiannis G, , Golias J, Eleonora Papadimitriou, 2007,
Accident risk of foreign drivers in various road
environments, Journal of Safety Research, Vol 38,4,
pp471–480.
Traffic Accidents Analysis using Self-Organizing Maps and Association Rules for Improved Tourist Safety
459
