
Jupyter Notebook as the Physics Experimental Laboratory’s Logbook
First Approach
Irene Urcelay-Olabarria
1
, Ruth Lazkoz
2
, Jon Urrestilla
2
, Aritz Leonardo
3
and Josu M. Igartua
3
1
Fisika Aplikatua I Saila, Bilboko Ingenieritza Eskola, Euskal Herriko Unibertsitatea (UPV/EHU),
Urkixo Zumarkalea z/g., Bilbo, Spain
2
Department of Theoretical Physics and History of Science, University of the Basque Country (UPV-EHU),
48040 Bilbao, Spain
3
Applied Physics II Department, Science and Technology Faculty, University of the Basque Country (UPV/EHU),
B. Sarriena s/n, Leioa (Bizkaia), Spain
Keywords:
Jupyter Notebook, Virtual Laboratory, Python.
Abstract:
In the Physics Degree it is of fundamental importance to practice in an Experimental Laboratory. The standard
Laboratory Sessions consist of two main parts: data handling and data processing. The session should also
have a prologue, where students get to know the underlaying theory of the practical session and an epilogue,
where students present the results obtained and the difficulties encountered. The prologue and the epilogue
naturally decouple from the work in the laboratory. Data processing, in most cases, is effectively decoupled
from the work in the laboratory, as well. In this short paper we present a tool, the Jupyter Notebook, an
electronic laboratory logbook, which conveniently facilitates the decoupling of the data handling and process-
ing, but which merges almost completely into an electronic notebook the four parts of the laboratory practical
session: theory, data, processing and presentation. But, interestingly, the notebook goes beyond that: it allows
the students to explore the data in an interactive way (simulating variants), to acquire a deeper knowledge of
the data (by digitally altering the experiment or simulating new ones), to propose new experiments, etcetera.
We strongly believe that this tool can also motivate the students: the results are obtained interactively, imme-
diately, visually, and they can be shared and even improved. Moreover, the laboratory sessions get optimized:
simulations make the sessions be focused on obtaining data and in its variants.
1 INTRODUCTION
1.1 Laboratory in the Physics Degree
In essence, physics is an experimental discipline. In a
very broad sense, it deals with observing Nature to try
to describe it through theoretical models with which
one has to experiment in order to know if they ac-
tually conform to reality. The experimental compo-
nent in Physics is extremely important (Wilcox and
Lewandowski, 2017), it is basic, even for theoreti-
cal physicists. That is why degrees in Physics around
the world have included experimental subjects, more
specifically, laboratory experiments; in fact, this has
been a subject of thorough study (Bernhard, 2003;
Harms, 2003; Sassi, 2001; Vicentini, 2008; Wilcox
and Lewandowski, 2016; Stanley and Lewandowski,
2016). These laboratory experiments are included
in an ”experimental module” within the degree of
physics, and they share the same general compe-
tences. But there are individual laboratory experiment
subjects in all different years of the degree, since each
set of experiments has associated some specific com-
petences to them. Common sense dictates that those
specific competences are to vary so as to follow the
higher degree of skilfulness and maturity the students
display after the leaning process in that very same and
previous academic years.
One of the typical general competences of the ex-
perimental module is to be able to perform a linear
regression with the experimental data obtained in the
laboratory (Hmurcik et al., 1989; Orear, 1991), as
well as to properly interpret the parameters obtained
from the fit. However, many physical quantities do
not vary linearly and, therefore, students have to learn
progressively that linear regression will not always be
helpful. Let us give a specific example of this: there
are some quantum variables, whose values can be ac-
cessed indirectly in the laboratory, which do not be-
have linearly. Students should then learn that for those
458
Urcelay-Olabarria, I., Lazkoz, R., Urrestilla, J., Leonardo, A. and Igartua, J.
Jupyter Notebook as the Physics Experimental Laborator y’s Logbook - First Approach.
DOI: 10.5220/0006352104580463
In Proceedings of the 9th International Conference on Computer Supported Education (CSEDU 2017) - Volume 1, pages 458-463
ISBN: 978-989-758-239-4
Copyright © 2017 by SCITEPRESS – Science and Technology Publications, Lda. All rights reserved

instances it is not a good approach to use linear re-
gression. But, of course, in order for the students to
understand those quantum variables and their context,
they have to have gathered the necessary knowledge
about quantum theory. Moreover, they will also have
to have achieved an appropriate skill level to deftly
use an oscilloscope or a ”Lock-in” (see (Collins et al.,
1974; Ricci et al., 2007; Damyanov et al., 2015) for
a few examples of the use of an oscilloscope for the
acquisition of quantum variables in the undergraduate
physics laboratory).
Another general competence of any standard ex-
perimental module is to be able to graphically show
both the experimental data and their fit via theoreti-
cal models. The specific competence of the particular
subject of the laboratory experiments of that specific
course would be to be able to to properly perform the
specific visualization; for example, to use the correct
variable in the correct context.
1.2 Laboratory in Theory
Laboratory Experiments consist of two fundamental
parts: 2 data collection (second stage) and 3 data pro-
cessing (third stage). It is clear that it should also have
a 1 prologue (first stage), the theory on which the ex-
periment is based; and an 4 epilogue (fourth stage),
which includes the presentation of the results obtained
and the difficulties encountered. The prologue and the
epilogue are clearly not performed at the laboratory,
are therefore naturally decoupled from the work done
in the laboratory. See figure 1.
All stages have their own general competences as-
sociated to them: knowledge of the theory, capac-
ity to collect data, ability to process them, ability to
communicate the results obtained. But also specific
competences according to the level (academic year)
in which the experiment is performed: the theory gets
more involved; the data collection and its treatment
gets more complicated; the presentation gets more so-
phisticated, because, for example, the audience’s sci-
entific level has increased. This development hap-
pens as the students progress in the degree. How-
ever, not all types of competences have to be acquired
in the laboratory. Normally, those associated with
the prologue and the epilogue are acquired outside:
that is why they are said to be naturally decoupled
from those associated with data collection and data
processing. Of these last two (data collection and
data processing), the only one that must necessarily
be carried out in the laboratory is the data collection.
There is a variant of the traditional experiment for-
mat in which the data are not acquired in the labora-
tory, but instead, data are supplied to the students. In
this format, the students do not acquire competences
related to data collection, but the rest of the compe-
tences are identical to the traditional procedure. This
format is validly used in certain circumstances: in dis-
tance learning courses, for example. Nevertheless,
we should note that in the classical format in which
the students collect the data, the competences involv-
ing data collection are given the status of importance
they deserve since they are related to the gathering of
expertise in routinary laboratory work and to the ac-
quisition of dexterity in the handling of experimental
equipment. In fact, much of the time of the lab ses-
sion is spent collecting data.Hence, why not turn the
lab session into a mere data acquisition session? In
this way the students could be convinced of the great
importance of this stage: Data collection. In“real life”
the acquisition of experimental data is an art: it re-
quires a great knowledge of what is being done (theo-
retical knowledge on which the experiment is based;
theoretical knowledge in which the measuring instru-
ment is based; skills on how the instrument is used;
the different working modes; the data it provides and
if data have to be treated previously to do any other
type of calculations; etc.); it requires detailed atten-
tion to it and, usually, a lot of patience and time.
We would not want to lose sight of the fact that
the data collection includes, from our point of view
at least, data visualization. Collecting data, without
seeing them, without showing them, does not make
sense. Even more, data visualization must ideally be
done at the same time, as they are being collected.
In this way it will be possible to realize if the exper-
iment makes sense, if errors are being made, if the
instrument being used is calibrated, if it works cor-
rectly, if the data obtained are coherent, if they follow
the expected trend or if they are in accordance with
the theory presented in the prologue.
If every time data are collected they are displayed
and they behave as expected, it naturally produces sat-
isfaction. On the contrary, when unexpected behav-
ior is faced, the natural reaction is to think about the
possible reasons why the behavior does not fit the ex-
pected trend: this is the interesting point, this reaction
is the one that sets in motion all the acquired com-
petences and causes others to be acquired (Dounas-
Frazer and Lewandowski, 2016). The anomalous be-
havior may find its roots, for instance, in randomness,
deficient measurement, poor equipment adjustment,
bad calibration, misunderstandings, the experiment it-
self could be poorly designed... Then it is natural to
repeat the acquisition of that datum or series of data,
after having changed the conditions in a way dictated
by prior reflection, to re-visualize the new data and to
repeat the process of reflection if necessary. This pro-
Jupyter Notebook as the Physics Experimental Laboratory’s Logbook - First Approach
459

cess in successive approximations based on the mea-
surement, visualization, correction of the necessary
parameters and, if necessary, repetition of the mea-
surement, is what leads to the correct realization of
the experiment. On the one hand, the processing of
the data is going to produce a totally satisfactory re-
sults. On the other hand, and undoubtedly also, it will
allow the students to actually acquire the associated
competences in a natural way.
It is interesting to compare the procedure with the
action of only producing a table containing just the
necessary information to do some calculations and to
obtain the requested values. Clearly, such a table con-
tributes nothing to the competences of the student. If
anything, it creates boredom and apathy about the lab
sessions. Apathy that increases as the students take
part in more and more lab sessions, which in turn
causes the competences associated with the experi-
ments not to be acquired and, also, causes “going to
the laboratory” to be just an easy and necessary for-
mality: it is enough to show up and collect the data in
order to pass the subject; taking data turns the process
into a mere data collection process, without any other
consideration or reflection on their quality, meaning
or usefulness.
Data processing, is traditionally carried out in the
laboratory. In fact, in the first year of the Physics de-
gree in our university, in the subject called Experi-
mental Techniques I, the students must perform the
data processing in the same session in which the data
are collected; and the session report has to be sub-
mitted before leaving the lab. Data processing (2) is
very important, since it leads to the cognitive develop-
ment of a large number of concepts (error estimation,
propagation of errors, importance of measuring some
variables instead of others, possible design of experi-
ments ...) and it helps acquire or refine a large number
of skills (differentiation, integration, qualitative cal-
culations, approximations, graphical representations
...). These competences are very useful not only for
lab sessions, but also for the rest of the subjects in the
degree. The data processing stage consists, in turn,
of two sub-stages; namely: 1) the knowledge and the
use of the tools necessary to carry out the treatment,
and 2) the treatment of the actual data themselves.
One must know whether a linear regression must be
made and how it is done, and how the results of the
fitting must be presented: with its errors, which have
been propagated or not, with their significant figures;
making the necessary tables, with the variables indi-
cated, accompanied by their units; constructing the
appropriate graphical representations, with the indi-
cated variables, accompanied by their errors, in the
appropriate scale and with the indicated and adequate
precision of the experiment. It is necessary to know
how the final results are interpreted: if the experiment
makes sense, if the variable measured behaves as ex-
pected; if the statistics is adequate; if it is necessary to
repeat some measurement or series of measurements,
and why; if there are several trends, what happens if
some points or series of points are removed, how the
behavior changes and why, whether or not to remove
them; what would happen if it were measured in an-
other interval, or in other measurement conditions (if
possible).
The first sub-stage, 3.1, consists itself of another
two levels. First, the knowledge of how to carry out
the task: how a linear regression is done; how the
propagated errors are calculated; how and why the
significant figures are assigned and what they mean;
how the representation window, the appropriate scale
and precision are chosen; which is the dependent vari-
able and which is independent. Second, the action
level: calculations have to be done to obtain the inter-
cept and slope, and their corresponding errors, results
have to be truncated and graphical representations fol-
lowing the criteria dictated by the knowledge of the
first level have to be performed. Nowadays the sec-
ond level has typically an automatic character (and
our university is no exception), in the sense that al-
most all calculations are made in a fast, reproducible
and reliable way using computers and more or less
sophisticated computer packages. It is important to
do this in this way because, among other things, the
students are being trained for the real world in which
people do not work with graph-paper to make graphi-
cal representations, nor are the calculations or regres-
sions done by hand.
Obviously this second sub-stage has much to do
not only with the data treatment itself, but with their
visualization, analysis and interpretation, or, in other
words, with the (previous) data collection stage of the
session. As mentioned above, in the second sub-stage,
in the data collection stage, the data obtained are in-
terpreted and decisions about the experiment itself are
made: whether to continue, to stop, to repeat, or to
consider other venues such as other measuring inter-
val... In short, the experiment is being completed, al-
ternatives are being considered, others are being dis-
carded and, some others, simulated. All this allows
students not only to actually learn in-situ, with the
possibility of rectifying, but to do it absolutely mo-
tivated, since they realize that the experiment devel-
ops, either positively (because one gets what was ex-
pected) or negatively (when one knowns what and
why something does not work), all of which allow
competences to be acquired more naturally and eas-
ily.
CSEDU 2017 - 9th International Conference on Computer Supported Education
460

1.3 Laboratory in Practice
Our experience shows that laboratory experiments
have always been considered by the students as “easy
subjects”; subjects that one passes easily and that with
little effort provide a good grade. Students do not take
into account the potential of the subject, all the bene-
fits they can get out of it. Even lately, where consider-
able effort has been put into stressing its benefits and
increasing its difficulty, the same thinking continues.
Students of latter academic years are not exception,
they pass the subject without realizing its importance
and without noticing all that can be learned in a lab-
oratory, in general, and with regards to the specific
concepts that are being developed in the laboratory,
in particular
The manuals for the experiments to be performed
in Experimental Techniques III are very thorough,
clear and concise. They present a theoretical intro-
duction, in which the session is contextualised and
its theoretical basis is explained, the specific objec-
tives of the session and the material to be used. The
manuals also describe the steps to be followed, and
the tables and graphical representations necessary to
obtain the objectives requested. The manuals are self-
contained. However, instead of using the (in our view)
wonderful tool that the manual actually is, students
use it as a recipe to know what and how to measure
and what and how to represent it, without giving it
any thought, without understanding the reason behind
each step, in order to provide a result fast, and get a
grade. The lack of commitment in the students is ap-
parent: they copy the measured data in random sheets
of paper (that get lost more often than it would be
desirable), leave the lab in a rush with the faintest ex-
cuse, have no shame in leaving just a member of the
group performing the experiment since they will all
share the data.In a nutshell: the experiments are never
performed right, never with the necessary depth, and
the students hardly ever acquire any of the relevant
skills or competences.
Team-work is important, and, arguably, even more
in a laboratory. It is one of the competences associ-
ated to the experimental module. Actually, in all the
laboratory sessions, we aim at having students work-
ing in pairs. However, this strategy makes the atti-
tude of the students in the laboratory inappropriate.
In many cases, only one person in the couple actually
works and, in turn, is the only one that goes through a
learning process. In most cases the work is split into
team members, and it ceases to be a team effort. In
summary, this working system does not achieve pro-
moting team-work, and does not ensure that all mem-
bers of a team acquire the associated competences.
This is aggravated, since the division of labor leads
to specialization (which in some context could even
be interesting): the same students are in charge of the
same type of task in every single session, there is no
rotation of tasks (which, if happened, would help stu-
dents acquire all different competences). It is even
worse, since the specialization is inherited to other
laboratory subjects, of the same and other academic
years, precisely for the same reason: (misunderstood)
efficiency. Students seek to work as quickly as possi-
ble, finish the task and get the grade, without having
the time or the willingness to integrate the knowledge
that each session aims to provide.
All the above arguments prove that there is a dan-
gerous difference between what the lab sessions were
designed and implemented for in the curriculum, and
what they actually achieve: laboratory experiments
do not meet any of the objectives, neither general nor
particular; they do not succeed in providing many of
the competences associated to the module of Exper-
imental Techniques, nor those associated to the spe-
cific subject in question.
2 PROPOSAL
Therefore, we believe that it is very important that
the 3.1 (Knowledge phase in Data Processing) is ex-
ecuted outside the laboratory and that 3.2 (Treatments
in Data Processing) is integrated into the data collec-
tion stage. The Data Collection stage would then be
formed of the following substages: pure data acqui-
sition/collection (2.1), visualization (2.2), being inte-
grated as a (3.2).
This new re-arrangement highlights that acquir-
ing experimental competences involves taking data
in the laboratory as well as visualizing the data as
they are being taken. In any case, specific com-
petences related to the theory part of the specific
session can be acquired “outside” the laboratory, as
well as specific skills related to the communication
of the results. One of the sub-stages of the data
processing, namely 3.1, can also be executed out-
side the laboratory. In fact, performing those tasks
outside the lab turns the acquired competences into
more general ones, making them more versatile and,
probably, more useful. The other sub-stage of the
data treatment (3.2) is integrated into the data col-
lection (2). Data treatment is almost always decou-
pled from the work in the laboratory. In this pro-
posal we present a tool, the electronic lab notebook
(Jupyter Notebook(Jupyter, 2017)), which naturally
decouples the processing of data (pure data process-
ing, what has been called sub-stage I of this stage)
from pure data collection (collected only without vi-
Jupyter Notebook as the Physics Experimental Laboratory’s Logbook - First Approach
461
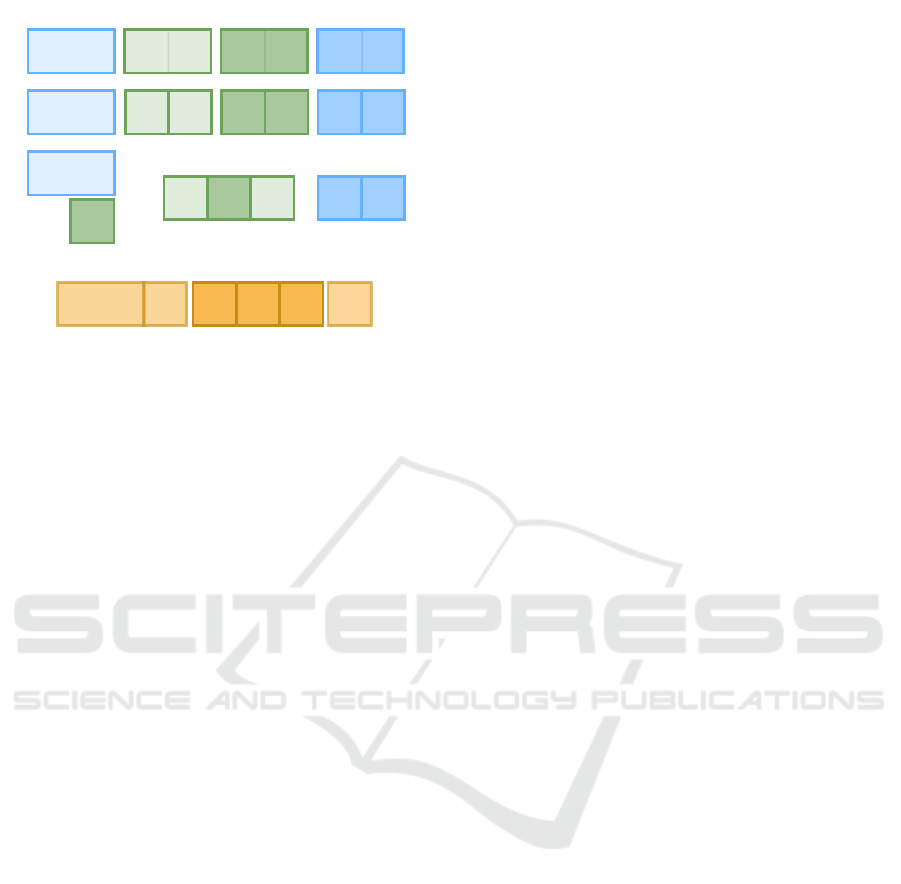
Prologue EpilogueData Collection Data Processing
Collect Visualize Knowledge Treatment Preparation Presentation
Collect Visualize Knowledge Treatment Preparation Presentation
Collect Visualize
Knowledge
Treatment Preparation Presentation
Knowledge Collect VisualizeTreatment PresentationPrologue
stage 1
stage 2 stage 3 stage 4
Proposal: Jupyter Notebook
Outside the laboratory In the laboratory
sub-stage I sub-stage II
sub-stage I sub-stage II
sub-stage I sub-stage II
sub-stage I sub-stage II
sub-stage I sub-stage II sub-stage II
sub-stage I
sub-stage I sub-stage II sub-stage III
Figure 1: Scheme for the Stages of Laboratory Experi-
ments. First and second rows, classical distribution of
stages and sub-stages (in parenthesis): 1-prologue , 2-data
collection (2.1-collect, 2.2-visualize), 3-data treatment (3.1-
knowledge, 3.2-treatment), 4-epilogue (4.1-preparation,
4.2-presentation). Second row, the sub-stages of stage 1
and 2 have clearly separated. Third row rearrangement of
the second row, just for establishing the proposal. Finally,
fourth row our proposal: merging the knowledge of data
treatment (4.1) with prologue (1) and this new section can
be achieved outside the laboratory. The laboratory work
consists on a bucle: the old 2.1-collection, 3.2-treatment
and 2.2-visualization of data get together into collection-
treatment-visualization. Finally, outside the laboratory, or
not, the presentation of the experiment takes place.
sualization), but at the same time integrates in an elec-
tronic notebook (ENB), almost totally, the four stages
of an experiment: theory, data (collection, visualiza-
tion), processing (calculations/representation and
re-calculations re-representation) and presentation.
Furthermore, it allows concepts to be explored in an
interactive way (simulating variants) deepening the
knowledge about those concepts (digitally altering
the experiment or simulating new ones), proposing
new experiments... The results are achieved interac-
tively, immediately, visually, and can be shared and
improved. In addition, the work in the laboratory is
optimized: it is focused on data collection and its vari-
ants.
We would like to highlight the improvements brought
into the actual realization of laboratory sessions by
the use of a Jupyter Notebook as a laboratory note-
book.
1. It is a real notebook: can be saved, shared, edited
simultaneously by the members of the team, re-
viewed, corrected and evaluated digitally.
2. The manual of the experiment becomes the note-
book of each member.Each member has its own
notebook: revisable, correctable and evaluable in-
dependently (more precise in the assessment pro-
cess).
3. There will be more precision in the acquisition of
the competences, as well, and work will be inde-
pendent and autonomous. Each partner has the
opportunity to make their own simulations, and
then discuss them to finally admit or discard them.
Each one can record in their notes, in a contin-
uum or in turns, the difficulties they have encoun-
tered (individually or as a team) and how to rem-
edy them.
4. The data are automatically checked by the inter-
face itself, thus maximizing a good use of time.
Calculations are executable in each moment; par-
tial data can be saved; it can be re-run with dif-
ferent input data and the results can be compared,
reproducibly and reliably, before the decision to
move to the next stage is taken.
5. The graphic representations are automated, and
can always be modified according to the user’s
preferences, exported in many formats and saved,
shared and inserted in any technical document ...
We propose two levels of implementation: level 1,
for students enrolled in the Physics degree, and level
0, for all other students. The level 0 is subdivided into
two sub-levels, depending on the studies undertaken
by the students: one sub-level for students of the De-
gree in Chemistry (Faculty of Science and Technol-
ogy) and another sub-level for students of Industrial
Engineering (School of Engineering).
Both, the concept and the goal, of an ENB on the
two levels considered is the same. We have estab-
lished these two levels because we want to measure
the impact on physics laboratory sessions, indepen-
dent of the degree the students are enrolled in, and
which Center they are studying at. We want to cre-
ate a tool for general use in laboratory sessions, with
small variants, depending on the a priori attitude of
the students towards learning Physics, and on their the
computational competences. At level 0, the students
will collect data, enter them in the ENB and the note-
book will be responsible for depicting the data (see
(Eshach and Kukliansky, 2016) for insight on difficul-
ties students encounter on this type of analysis). The
elements of interaction with the visual data needed to
do the analysis properly will be provided: simulat-
ing experiments, seeing the effect of removing points,
exploring how settings change etc. At level 1, the in-
troduction of the data and the analysis of the data will
be different concerning the students’ computing com-
petences. The difference is based on the fact that the
students of the Degree of Physics attend a course in
which they acquire the necessary competences to be
able to interact in a conscious and efficient way with
the ENB. Thus, they are forced/expected to use the
CSEDU 2017 - 9th International Conference on Computer Supported Education
462

skills they have acquired in the previous course by re-
fining the NB themselves.
3 CONCLUSIONS
The using of Jupyter Notebook as the lab-log-
notebook, facilitates the decoupling of the data han-
dling and processing and merges almost completely
into it the four parts of the laboratory practical ses-
sion: theory, data, processing and presentation. Re-
sults are obtained interactively, immediately, visually,
and they can be shared and even improved. The lab-
oratory sessions get optimized: simulations make the
sessions be focused on obtaining data and in its vari-
ants. Moreover, the notebook goes beyond that: it al-
lows the students to explore the data in an interactive
way (simulating variants), to acquire a deeper knowl-
edge of the data (by digitally altering the experiment
or simulating new ones), to propose new experiments.
In our view, the new re-arrangement implied by
the proposal highlights that acquiring experimental
competences involves taking data in the laboratory as
well as visualizing the data as they are being taken;
the specific competences related to the theory part of
the specific session can be acquired “outside” the lab-
oratory, as well as specific skills related to the com-
munication of the results; as part of data processing
executed outside the laboratory, which turns the ac-
quired competences into more general ones, making
them more versatile and more useful.
REFERENCES
Bernhard, J. (2003). Physics learning and microcomputer
based laboratory (mbl): Learning effects of using mbl
as a technological and as a cognitive tool, science ed-
ucation research in the knowledge based society. Dor-
drecht: Kluwer, 313-321.
Collins, L. A., Morrison, M. A., and Donoho, P. L.
(1974). Advanced undergraduate-laboratory experi-
ment on electron spin resonance in single-crystal ruby.
American Journal of Physics 42, 560 (1974).
Damyanov, D. S., Pavlova, I. N., Ilieva, S. I., Gourev,
V. N., Yordanov, V. G., and Mishonov, T. M. (2015).
Planck’s constant measurement by landauer quanti-
zation for student laboratories. European Journal of
Physics, Volume 36, Issue 5, article id. 055047.
Dounas-Frazer, D. and Lewandowski, H. (2016). Nothing
works the first time: An expert experimental physics
epistemology. ArXiv e-prints.
Eshach, H. and Kukliansky, I. (2016). Developing of an in-
strument for assessing students? data analysis skills in
the undergraduate physics laboratory. Canadian Jour-
nal of Physics, 94(11):1205–1215.
Harms, U. (2003). Virtual and remote labs in physics educa-
tion. Proceedings of the Second European Conference
on Physics Teaching in Engineering Education, 14–17
June (Budapest).
Hmurcik, L., Slacik, A., Miller, H., and Samoncik, S.
(1989). Linear regresion analysis in a first physics lab.
Journal of Physics 57, 135 (1989).
Jupyter (2017). The jupyter notebook. http://jupyter-
notebook.readthedocs.io/en/latest/notebook.html.
Orear, J. (1991). Comment on “linear regression analysis
in a first physics lab,” by l. hmurcik et al. American
Journal of Physics 59(1):87-88.
Ricci, M. M., Mazzaferri, J., Bragas, A., and Martinez, O.
(2007). Photon counting statistics using a digital os-
cilloscope. Am. J. Phys. 75(8), pp. 707-712.
Sassi, E. (2001). Lab-work in physics education and in-
formatic tools: advantages and problems. pinto, r. &
surinach, s. (eds), physics teacher education beyond,
57– 64. elsevier, paris. Pinto, R. & Surinach, S. (Eds),
Physics Teacher Education Beyond, 57– 64. Elsevier,
Paris.
Stanley, J. T. and Lewandowski, H. J. (2016). Recom-
mendations for the use of notebooks in upper-division
physics lab courses. ArXiv e-prints.
Vicentini, E. S. E. . M. (2008). Aims and strategies of lab-
oratory work. M. Vicentini, & E. Sassi, Connecting
Research in Physics Education with Teacher Educa-
tion (pp. 1-12). International Commision on Physics
Education.
Wilcox, B. R. and Lewandowski, H. J. (2016). Open-
ended versus guided laboratory activities:impact on
students’ beliefs about experimental physics. Phys.
Rev. Phys. Educ. Res., 12:020132.
Wilcox, B. R. and Lewandowski, H. J. (2017). Students’
views about the nature of experimental physics (arti-
cle). under review Phys. Rev. X.
Jupyter Notebook as the Physics Experimental Laboratory’s Logbook - First Approach
463
