
Extraction of Conservative Rules for Translation Initiation Site
Prediction using Formal Concept Analysis
Leandro M. Ferreira
2
, Cristiano L. N. Pinto
1,3
, S´ergio M. Dias
2,4
, Cristiane N. Nobre
2
,
and Luis E. Z´arate
1,2
1
UNA University Center, Belo Horizonte, Brazil
2
Pontifical Catholic University of Minas Gerais (PUC Minas), Belo Horizonte, Brazil
3
School of Engeneering of Minas Gerais (EMGE), Belo Horizonte, Brazil
4
Federal Service of Data Processing (SERPRO), Belo Horizonte, Brazil
Keywords:
Data Mining, Bioinformatics, Formal Concept Analysis, Machine Learning, Translation Initiation Site.
Abstract:
The search for conservative features that define the translation and transcription processes used by cells to
interpret and express their genetic information is one of the great challenges in the molecular biology. Each
transcribed mRNA sequence has only one part translated into proteins, called Coding Sequence. The detec-
tion of this region is what motivates the search for conservative characteristics in an mRNA sequence. In
eukaryotes, this region usually begins with the first occurrence of the sequence of three nucleotides, being
Adenine, Uracil and Guanine, the nucleotide set that it is called Translation Initiation Site. One way to look
for conservative rules that define this region is to use the formal concept analysis that can have implications
that indicate a coexistence between the positions of the sequence with the presence of the translation start site.
This paper analyze the use of this technique to extract conservative rules to predict the translation initiation
site in eukaryotes.
1 INTRODUCTION
The use of computational techniques for the molecu-
lar biology analysis information has contributed sig-
nificantly to the area of bioinformatics. Among the
main processes that have received attention are those
of translation and transcription, which are mecha-
nisms used by cells to interpret and express their ge-
netic information (Tzanis et al., 2007). The entire
mRNA sequence transcribed only a part called Cod-
ing Sequence (CDS) is translated into proteins. One
of the main problems of molecular biology corre-
sponds to the search for conservative characteristics
in an mRNA sequence that allows the detection of a
CDS region. In eukaryotes, this region usually starts
at a AUG (sequence of 3 nucleotides Adenine (A),
Uracil (U) and Guanine (G)), with a nucleotide set
that we call Translation Initiation Site (TIS).
The extraction of conservative characteristics can
be done by exploiting dependencies in sequences con-
taining TIS. In this paper, it will be considered the
Formal Concept Analysis (FCA), which is a mathe-
matical technique introduced in the early 1980s by
Rudolf Wille (Wille, 1982). The FCA has been ap-
plied in different areas of knowledge (Poelmans et al.,
2010; Poelmans et al., 2013; Kuznetsov and Poel-
mans, 2013). The application of the FCA depends
on the construction of the formal context to represent
a specific problem. From this context, it is possible to
apply a specific algorithm for the extraction of knowl-
edge from formal concepts it is possible to obtain
rules of implication (commonly called implications
), which are rules indicative of a relation between
subsets of attributes related to objects. In this work,
the formal context is constructed from the mRNA se-
quences, where the objects are the sequences them-
selves and each position is transformed into a multi-
valued attribute of 4 positions: Adenine (A), Uracil
(U), Cytosine (C) or Guanine (G). The extracted im-
plication rules are given in the form Y → Z, where Y
and Z attribute subsets, when its found the subset Y it
has Z with confidence of 100%. In this way, could
achieve new conservative characteristics that deter-
mine the TIS, besides those found by (Kozak, 1984).
The purpose of this article is to verify if the con-
servative characteristics obtained from implications
extracted using FCA can improve the prediction of
TIS using the Support Vector Machine (SVM) classi-
Ferreira, L., Pinto, C., Dias, S., Nobre, C. and Zárate, L.
Extraction of Conservative Rules for Translation Initiation Site Prediction using Formal Concept Analysis.
DOI: 10.5220/0006326202650271
In Proceedings of the 19th International Conference on Enterprise Information Systems (ICEIS 2017) - Volume 1, pages 265-271
ISBN: 978-989-758-247-9
Copyright © 2017 by SCITEPRESS – Science and Technology Publications, Lda. All rights reserved
265
fier.
This paper is organized as follows: Section 2 gives
a brief introduction to the formal concept analysis. In
section 3 a review about related work is presented.
Section 4 presents the description of the methodology
and the experiments carried out. Finally, discussion
of results obtained is showed.
2 FORMAL CONCEPT ANALYSIS
This section presents the main concepts of formal
concept analysis (FCA). The notation and terminol-
ogy are based on the formulations of Ganter and Wille
(Ganter and Wille, 1999).
2.1 Formal Context
Definition 1. A formal context consists of two sets
and a binary relation between them. Generally speak-
ing, a formal context is a triple (G,M,I) where I ⊆
G × M, the elements of the set G are called objects,
the elements of the set M calls for attributes and I
called incidence relation. In other words (g,m) ∈ I
or simply gIm should be read as ”object g contains
attribute m”.
Table 1 shows an example of formal context. Each
row of the table represents a sequence (TIS or non-
TIS), the columns represent the positions of the se-
quence, and each position can assume one of the four
nucleotides (A, C, G or U), each marking (X) in-
dicates if there is a nucleotide in that position. To
demonstrate the nucleotide present in a multivalued
position is used the notation P. N, where P is se-
quence’s position and N is the nucleotide’s identifier.
Definition 2. Given a set B ⊆ G, of objects of a for-
mal context (G,M, I), we can identify which attributes
of M are common to all objects of B. Similarly, that
can be identified for a set D ⊆ M, which are the ob-
jects of G that have the attributes of D. These ques-
tions are answered by the derivation operators, de-
fined by Equations 1 and 2.
B
′
= {m ∈ M|gIm ∀g ∈ B} (1)
D
′
= {g ∈ G|gIm ∀m ∈ D} (2)
2.2 Formal Concepts
The formal concepts obtainable from a formal context
(G,M,I) are ordered pairs (B,D), where B ⊆ G and
D ⊂ M, Each object in B has all the attributes in D
and each attribute in D is the attribute of all objects
in B. In other words, (B, D) is a formal concept if
and only if B
′
= D and D
′
= B. The sets B and D are
denominated extension and intention of the concept,
respectively.
Exemple 1. Following the formal context of Table 1,
it can be made the formal concept (2, 3, 4, -9.G, -
8.C) where the elements of the subset D are {-9.G,
-8.C }. Hence, by derivation (Equation 2), B = 2,3,4
represents the subset of the sequences having as char-
acteristics the nucleotide G in the position 9 and the
nucleotide C in the position -8. It should be noted that
the formal concept corresponds to any aspect within
the domain of the problem, represented by attributes
and objects, where there may be an understanding or
a comprehension.
2.3 Concept Lattice
When the set of all formal concepts of a formal con-
text is hierarchically ordered, it receives the denom-
ination of concept lattice. Its formal concepts are
related as (A1,B1) ≤ (B2,D2), when B1 ⊆ B2 and
D2 ⊆ D1, where (B1, D1) is called subconcept and
(B2, D2) is called superconcept.
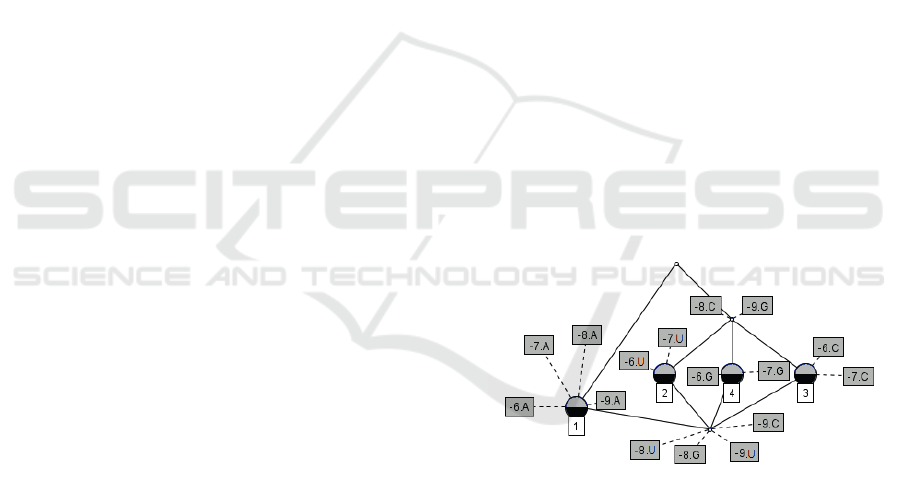
Figure 1 shows the diagram of the concept lattice
obtained from the TIS prediction problem (presented
in a simplified way in the table 1). We can observe
that all object that has the attributes -7.G and -6.G
also has -8.C and -9.G.
Figure 1: Example of concept lattice in the TIS prediction
context.
While a formal context is represented by a table,
such as the Table 1, a concept lattice is represented
by a diagram shown as a graph, where each vertex
is a formal concept and the edge shows its relations
(B1,D1) ≤ (B2, D2). When two concepts relate as
subconcept and superconcept without any other for-
mal concept between them, their vertices must be con-
nected by an edge in the diagram. The highest vertex
of the diagram represents the formal concept whose
extension contains all objects, while the lowest vertex
contains all the attributes in its intention.
ICEIS 2017 - 19th International Conference on Enterprise Information Systems
266

Table 1: Example of an formal context.
Position of nucleotides in sequence
Sequences -9 -8 ... TIS ... 1083
A U C G A U C G ... ... A U C G
1 X . . . X . . . ... X ... X . . .
2
. . . X . . X . ... X ... . X . .
3
. . . X . . X . ... X ... . . X .
4
. . . X . . X . ... ... . . . X
2.4 Implication Rules
Definition 3. In a formal context whose set of at-
tributes is M, one implication is an expression P → Q,
where P,Q ⊆ M.
An implication P → Q, extracted from a formal
context, must be such that P
′
⊆ Q
′
. In other words,
every object that has the attributes of P has the at-
tributes of Q.
Exemple 2. An example of an implication rule
is given by {−4.C, −3.A,4.G} → {1.A,2.U,3.G},
whose premise is formed by the set of attributes
{−4.C, −3.A,4.G} indicating that in positions −4,
−3 and 4 we have the nucleotides C, A and G, re-
spectively. The conclusion is represented by the set
of attributes {1.A,2.U,3.G} indicating the TIS. From
the example we can infer that when this premise is
found in the mRNA sequence we have the TIS, with a
confidence rate of 100%.
3 RELATED WORKS
In (Cur´e et al., 2015), the authors used an approach
based on FCA and on semantic query expansion to
determine diseases from their symptoms. The ap-
proach proved to be efficient for the detection of dis-
eases with greater sensitivity and support especially
for cases of presence or absence of obesity.
The use of FCA was also addressed by (Hris-
toskova et al., 2014) as a cluster analysis technique,
derived from several sets of genetic microarrays.
These data sets were initially divided into groups that
have characteristics related to a predefined criterion.
As result, the FCA proved to be a robust data inte-
gration technique capable of producing a good and
representative grouping solution for the entire set of
genetic expression matrices. In addition, the use of
FCA enabled a subsequent analysis of the data, pro-
viding useful information about the biological role of
genes contained in the same concepts of the FCA.
The biggest problem of mining of numeric data
using FCA is caused by binarization of data. This can
cause a loss of information or produce a large volume
of data, difficult to process. In (Kaytoue et al., 2011),
the authors studied two methods based on FCA for
the mining of numerical data in contexts of genetic
data expressions. The first uses interordial scaling,
encoding all possible attribute ranges in a formal con-
text without losing information, but ends up produc-
ing a large and dense volume of data. The second
constructs a concept lattice directly from the origi-
nal data.The author shown that the two methods are
equivalent, but the second method was shown to be
computationally more efficient.
After an exhaustive search, it was not possible to
find papers using FCA in the biological domain con-
sidered in this work. Thus, we intend to show that
this theory can be used to improve the performance of
methods and techniques in the context of TIS predic-
tion.
4 MATERIALS AND METHODS
4.1 Materials
The used databases in our experiments were ex-
tracted from the NCBI RefSeq (Pruitt and Ma-
glott, 2001) repository on April 22, 2014. The ex-
tracted data refer to four organisms Rattus Novergicus
(1383 molecules), Mus musculus (1097 molecules),
Homo sapiens (21528 molecules) and Drosophila
melanogaster (27764 molecules).
In this work, each molecule is identified according
to the level of inspection, and classified as: Model,
Inferred, Predicted, Provisional, Reviewed, Validated
and WGSk. In this work only mRNA molecules
with inspection level reviewed were used. Table 2
shows the sequence amount for each species. Posi-
tive sequences are those that synthesize proteins (TIS)
and the negative sequences do not synthesize proteins
(Non-TIS).
Table 2: Number of sequences for each database.
Positives Negatives Total
Rattus Novergicus 66 101 167
Mus musculos 398 632 1030
Homo sapiens 9716 16085 25801
Drosophila melanogaster 10122 25725 35847
Extraction of Conservative Rules for Translation Initiation Site Prediction using Formal Concept Analysis
267

4.2 Window Size Definition
The size of the nucleotide sequence used in training
has a direct influence on the quality of the prediction
model (Silva et al., 2011; LIU and WONG, 2003).
Extraction windows can be symmetric, with the same
number of nucleotides in the upstream regions ( re-
gion of the sequence before TIS ) and downstream
(region after of TIS), or asymmetric, with a number
other than nucleotides for each region. Preliminary
studies indicate that asymmetric-sized windows pro-
vide greater accuracy (Silva et al., 2011). We will
adopt asymmetric windows in this work being the re-
gion upstream with the lowest number of nucleotides.
For the definition of the nucleotide number of
the upstream region, we use the ribosome scan-
ning model and the Kozak’s consensus (Kozak,
1984), that identifies a conservative pattern at the
−6,−5, −4,−3,−2,−1, 1, 2, 3, 4 positions with the
sequence (GCC[A or G]CCAUGG), where predom-
inance of the nucleotides [A/G] and [G] in the posi-
tions of −3 and 4, respectively. A greater number of
nucleotides in the upstream region was used by (Tza-
nis et al., 2007), where the conservation of the −7
position was also identified. For the experiments of
this work, we adopted a window with 9 nucleotides in
the upstream region, since the mRNA scanning model
is done by codon and, besides that, we guarantee the
conservative positions identified in other works.
For the downstream region, it was found in (Pinto
et al., 2017) that the larger is the region the greater
is the accuracy achieved by the SVM classifier, thus
adopting the size of 1081 nucleotides in the down-
stream region, so that we can have a better fit in the
classifier. For the extraction of the conservative rules,
we used the 20 nucleotide downstream size to ease
the computational time of extraction, due to the high
computational cost of the algorithm used in rule ex-
traction.
4.3 Extraction of Conservative
Characteristics
In this work, we used the ’Find Implications’ algo-
rithm, proposed by (Carpineto et al., 1999). This al-
gorithm allows to extract implications using formal
concept analysis for the extraction of all rules. Given
a formal concept (X,Y), and a concept lattice, the al-
gorithm looks for implications of (X,Y) where there
are implications P → Q, with P
T
Q =
/
0, R ⊂ Y,=
Y − P, so that this implication can not be obtained
from the concept (W,Z). This algorithm requires a
large computational effort due to its complexity that
is proportional to O(|C|k
2
|M|q), where C is the con-
cept number, k is the largest number of attributes in
the premise, M is the number of attributes and q is
the largest number of relation per concept. Since the
database was very large, causing a great computa-
tional effort, we divided the base into groups of 500
sequences and, in the end, we made an intersection
between the implications generated for each analyzed
organism.
Since the TIS attribute is common to all positive
sequences, it was possible to observe rules where TIS
is the conclusion of a certain premise as exempli-
fied in the 2.4 section. After obtaining the impli-
cations of each organism, the common rules among
all organisms were collected. This extraction was
made through the intersection between the sets of
rules acquired from each organism. We also con-
sider that rules with support greater than or equal to
30%, within all bases, should be used as conserva-
tive characteristics to increase classifier performance
(25% would be considered random since they are four
nucleotides).
It were added characteristics as supporting vector
G in our base as binary values demonstrating the ex-
istence of that rule in the sequence. The vector G is
formed by Equation 3.
G(n) =
(
1 if V (n) == N (n)
0 Otherwise
(3)
where V is a vector with the values of the sequence in
the positions of the conservative characteristics found
and N is the vector with the values that each position
must have according to the implications found.
4.4 Support Vector Machines Classifier
SVM is a machine learning technique capable of solv-
ing linear and non-linear classification problems. It
separates examples using a linear decision surface and
increasing the distance between training points (Silva
et al., 2011).
The efficiency of SVM classifier depends on the
proper selection of the parameters of the kernel func-
tion used and the smoothing parameter of the optimal
hyperplane separation margin, represented by sym-
bol C. In this work, the Gaussian RBF (Radial Basis
Function) kernel function was used, which acts as a
structural regulator. The RBF function is defined by
the Equation 4 and its parameter is represented by the
symbol gamma (γ)
K(x
i
,x
j
) = exp(−γkx− x
′
k
2
) (4)
To define the parameters C and γ, was used the
’Grid Search’ method, implemented for the class lib-
ICEIS 2017 - 19th International Conference on Enterprise Information Systems
268
SVM
1
. This method defines the best set of parame-
ters through an exhaustive search within a predefined
range of values for each of the parameters. The execu-
tion time of this tool can be prohibitive. To decrease
this time, the grid search method was executed in a
cluster, consisting of 12 machines
2
.
4.5 Evaluation Methods
The evaluation of the results was performed from the
precision, sensitivity, and F-measure metrics. Preci-
sion evaluates among all the sequences classified as
TIS those that are truly TIS (Equation 5).
Precision = 100·
TP
TP+ FP
(5)
The sensibility is relative to the hit rate in the pos-
itive class (TIS). It is also called rate of true positives
(Equation 6).
Sensitivity = 100·
TP
TP+ FN
(6)
where TP, TN, FP and FN denote the number of True
Positives, True Negatives, False Positives and False
Negatives, respectively.
F-measure considers the precision and sensitivity
metrics to evaluate the model, performing a harmonic
average between the two metrics (Equation 7).
F − measure = 2 ·
Precision· Sensitivity
Precision+ Sensitivity
(7)
For the validation of the proposed model, it was
used the cross-validation (10-fold cross-validation)
technique, which guarantees a statistical validation of
the model. The procedure consists in subdividing the
available dataset into ten folds of the same size, 9 of
which folds are used for training and one fold for val-
idation.
5 RESULTS
After determining the subset of implications of the in-
tersection between the set of rules of each organism,
the main rules for TIS prediction, in the range stipu-
lated, were obtained (Table 3), while still retaining the
characteristics demonstrated by Kozak. For example,
the first line of Table 3 represents −8.C → TIS. This
indicates that whenever there is a nucleotide C at the
1
Available in https://www.csie.ntu.edu.tw/cjlin/Libsvm/
2
Intel Core2 duo 2.2 GHz x2, 4 GB of RAM memory
Ubuntu 14.04 64 bits
-8 position, the AUG begins the traduction. This oc-
curs with a support of 34.3% of the base Rattus nover-
gicus and 31.1% support when considering all species
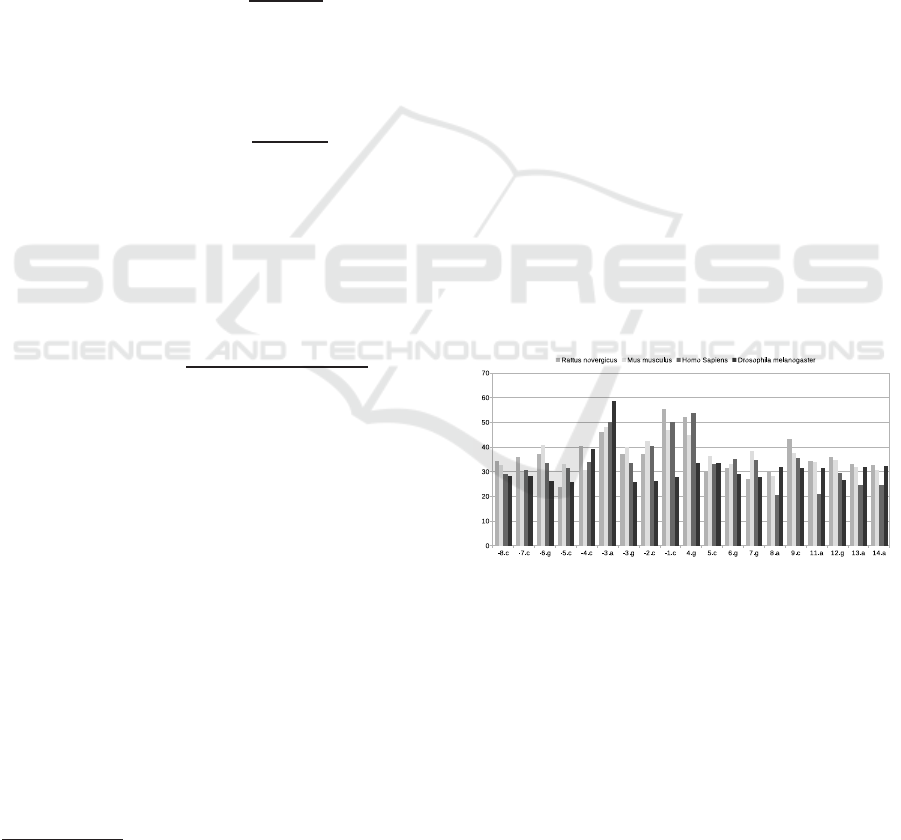
bases. The values of the brackets for each rule found
in the positives sequences can be visualized in Figure
2.
It can be noted the predominance of the conser-
vative Kozak characteristics in the −3 positions, con-
taining A or G and 4 containing G, and T with the val-
ues of greater support among the bases analyzed. It
is also observed 11 new conservative characteristics,
besides those indicated by Kozak, among which the 9
position is a C nucleotide (with a support of 37%).
As for the negative sequences (Non-TIS), two
conservative positions were identified: positions -2
and 4 with the presence of nucleotide A, with a sup-
port of 30.6% and 31.3%, respectively. This shows
how negative sequences can be random and not fol-
low a pattern, unlike positive sequences (TIS).
In preliminary tests, it was decided to add features
with greater support within all the bases, positives
and negatives, to value its main characteristics. Thus,
the -3.A, -3.G, 4.G and 9.C, 1.C characteristics were
added in the positives sequences and the -2.C and 4.C
characteristics were added in the negatives sequences.
However, in doing so, it was noted that there was an
increase in noise in the data and an increase in clas-
sification error. Thus it was decided to add only the
features that value the positive characteristics, shown
in the Table 3.
Figure 2: Values of the brackets for each rule found in the
positives sequences.
Table 4 presents the parameters used for the SVM,
obtained by ’Grid search’ method.
The use of the implication rules found allowed
a small increase in the metrics evaluated in this
work (see Table 5). The biggest difference between
the results with and without the characteristics hap-
pens in the organisms Mus muscules and Drosophila
melanogaster, where we see an increase around 1 %.
This is due to the fact that in none of the rules found,
the appearance of them in the negative sequence is
greater than in the positive ones while this happens
twice in the other bases. Even so, the organism Homo
Extraction of Conservative Rules for Translation Initiation Site Prediction using Formal Concept Analysis
269

Table 3: Implications rules extracted and their support.
Premisse Rattus novergicus Mus musculus Homo Sapiens Drosophila melanogaster General
Position Nucleotides Pos Neg Pos Neg Pos Neg Pos Neg Pos Neg
-8 C 34.3% 21.6% 32.8% 22.3% 29.1% 26.7% 28.1% 21.7% 31.1% 23.0%
-7 C
35.8% 27.5% 29.7% 21.1% 30.6% 25.7% 28.3% 21.6% 31.1% 24.0%
-6 G
37.3% 17.6% 40.8% 31.3% 33.6% 28.7% 26.1% 21.2% 34.5% 24.7%
-5 C
23.9% 28.4% 33.0% 28.5% 31.3% 25.4% 25.9% 19.9% 28.5% 25.6%
-4 C
40.3% 18.6% 30.5% 25.4% 34.0% 24.8% 39.1% 18.5% 35.9% 21.8%
-3 A
46.3% 23.5% 48.2% 26.9% 50.2% 25.4% 58.6% 26.5% 50.8% 25.5%
-3 G
37.3% 27.5% 40.1% 25.7% 33.3% 28.3% 26.0% 18.5% 34.1% 25.0%
-2 C
37.3% 16.6% 42.5% 22.3% 40.5% 21.9% 26.3% 20.0% 36.7% 20.2%
-1 C
55.2% 25.5% 46.9% 23.5% 50.2% 27.7% 27.7% 17.3% 45.0% 23.3%
4 G
52.2% 33.3% 45.0% 24.6% 53.7% 28.5% 33.6% 17.4% 46.1% 25.9%
5 C
29.8% 20.6% 36.5% 25.4% 33.0% 24.6% 33.7% 19.2% 33.2% 22.5%
6 G
31.3% 26.5% 33.2% 21.9% 35.3% 30.7% 28.9% 19.9% 32.2% 24.7%
7 G
26.9% 26.5% 38.2% 27.7% 34.5% 28.2% 27.6% 20.7% 31.8% 25.8%
8 A
29.8% 39.2% 28.2% 27.3% 20.6% 24.1% 31.7% 30.2% 27.6% 30.2%
9 C
43.2% 19.6% 37.5% 21.8% 35.6% 23.8% 31.6% 20.0% 37.0% 21.3%
11 A
34.3% 18.6% 33.9% 23.8% 20.9% 23.9% 31.7% 31.6% 30.2% 24.5%
12 G
35.8% 22.5% 34.7% 31.2% 29.3% 28.7% 26.6% 22.2% 31.6% 26.2%
13 A
32.9% 24.5% 31.7% 21.1% 24.6% 24.1% 31.8% 30.6% 30.2% 25.0%
14 A
32.8% 28.4% 30.6% 22.3% 24.6% 23.1% 32.2% 30.1% 30.1% 26.0%
Table 4: Parameters obtained using the ’Grid Search’ method.
Without characteristics With characteristics
C Gamma C Gamma
Rattus norvegicus 128 3.051757812× 10
−5
32 3.0517578125× 10
−5
Mus musculus
8 1.220703125× 10
−4
8 4.8828125× 10
−4
Homo sapiens
2 4.8828125× 10
−4
128 4.8828125×10
−4
Drosophila melanogaster
32 4.8828125× 10
−4
8 4.8828125× 10
−4
Table 5: Results of SVM classifier.
Without characteristics With characteristics
Precision Sensitivity F-measure Precision Sensitivity F-measure
Rattus norvegicus 89.4% 89.2% 89.1% 89.4% 89.2% 89.1%
Mus musculus 97.9% 97.9% 97.8%
98.8% 98.7% 98.8%
Homo sapiens 98.0% 97.7% 97.9%
98.2% 98.2% 98.2%
Drosophila melanogaster 96.9% 96.8% 96.8%
98.2% 98.2% 98.2%
sapiens had a small increase, while the Rattus nover-
gicus organism they continued with the same values,
because of its low amount of data.
6 CONCLUSIONS
In this work it was proposed the extraction of conser-
vative mRNA characteristics from eukaryotes organ-
isms to improve the prediction of TIS, using formal
concept analysis. Using a downstream region of 20
nucleotides and 9 nucleotides upstream, it was possi-
ble to find a total of 19 rules of implication, including
the rules of Kozak. The results show shows that the
addition of conservative characteristics, even using a
small window, improves SVM results, although the
increase is little in this work.
In future works, it would be important to test
larger windows, both in the upstream and downstream
regions for rule extraction. In this work, by compu-
tational limitation, we use only 20 nucleotides in the
downstream region. But for this, it is necessary to im-
plement more optimized versions of the algorithm in
order to consider more characteristics.
ACKNOWLEDGEMENTS
The authors acknowledge the financial support re-
ceived from the Foundation for Research Support of
Minas Gerais state, FAPEMIG; the National Council
for Scientific and TechnologicalDevelopment, CNPq;
Coordination for the Improvement of Higher Educa-
tion Personnel, CAPES. We would also express grati-
tude to the Federal Service of Data Processing, SER-
PRO.
ICEIS 2017 - 19th International Conference on Enterprise Information Systems
270

REFERENCES
Carpineto, C., Romano, G., and d’Adamo, P. (1999). In-
ferring dependencies from relations: a conceptual
clustering approach. Computational Intelligence,
15(4):415–441.
Cur´e, O. C., Maurer, H., and Shah, Nigam H.and LeP-
endu, P. (2015). A formal concept analysis and se-
mantic query expansion cooperation to refine health
outcomes of interest. BMC Medical Informatics and
Decision Making, 15(1):1–6.
Ganter, B. and Wille, R. (1999). Formal Concept Analy-
sis: Mathematical Foundations. Springer-Verlag, Ger-
many.
Hristoskova, A., Boeva, V., and Tsiporkova, E. (2014). A
formal concept analysis approach to consensus clus-
tering of multi-experiment expression data. BMC
Bioinformatics, 15(1):1–16.
Kaytoue, M., Kuznetsov, S. O., Napoli, A., and Duplessis,
S. (2011). Mining gene expression data with pattern
structures in formal concept analysis. Information Sci-
ences, 181(10):1989 – 2001. Special Issue on Infor-
mation Engineering Applications Based on Lattices.
Kozak, M. (1984). Compilation and analysis of sequences
upstream from the translational start site in eukaryotic
mrnas. Nucleic Acids Research, 12(2):857–872.
Kuznetsov, S. O. and Poelmans, J. (2013). Knowledge rep-
resentation and processing with formal concept anal-
ysis. Wiley Interdisciplinary Reviews: Data Mining
and Knowledge Discovery, 3(3):200–215.
LIU, H. and WONG, L. (2003). Data mining tools for bi-
ological sequences. Journal of Bioinformatics and
Computational Biology, 01(01):139–167.
Pinto, C. L. N., Nobre, C. N., and Z´arate, L. E. (2017).
Transductive learning as an alternative to translation
initiation site identification. BMC Bioinformatics,
18(1):81.
Poelmans, J., Elzinga, P., Viaene, S., and Dedene, G.
(2010). Formal Concept Analysis in Knowledge Dis-
covery: A Survey. Springer Berlin Heidelberg, Berlin,
Heidelberg.
Poelmans, J., Ignatov, D. I., Kuznetsov, S. O., and Dedene,
G. (2013). Formal concept analysis in knowledge pro-
cessing: A survey on applications. Expert Systems
with Applications, 40(16):6538 – 6560.
Pruitt, K. D. and Maglott, D. R. (2001). Refseq and lo-
cuslink: Ncbi gene-centered resources. Nucleic Acids
Research, 29(1):137–140.
Silva, L. M., de Souza Teixeira, F. C., Ortega, J. M., Z´arate,
L. E., and Nobre, C. N. (2011). Improvement in the
prediction of the translation initiation site through bal-
ancing methods, inclusion of acquired knowledge and
addition of features to sequences of mrna. BMC Ge-
nomics, 12(4):1–20.
Tzanis, G., Berberidis, C., and Vlahavas, I. (2007). Mantis:
a data mining methodology for effective translation
initiation site prediction. In Engineering in Medicine
and Biology Society, 2007. EMBS 2007. 29th Annual
International Conference of the IEEE, pages 6343–
6347. IEEE.
Wille, R. (1982). Restructuring lattice theory: an approach
based on hierarchies of concepts. I. Rival (Ed.): Or-
dered Sets, pages 445–470.
Extraction of Conservative Rules for Translation Initiation Site Prediction using Formal Concept Analysis
271
