
Towards a Data-oriented Optimization of Manufacturing Processes
A Real-Time Architecture for the Order Processing as a Basis for Data Analytics
Methods
Matthias Blum and Guenther Schuh
Institute of Industrial Management(FIR) at RWTH Aachen University, Campus Boulevard 55, 52074 Aachen, Germany
Keywords: Industrie 4.0, Data Analytics, Digital Twin, Digital Shadow, Real-Time Architecture.
Abstract: Real-time data analytics methods are key elements to overcome the currently rigid planning and improve
manufacturing processes by analysing historical data, detecting patterns and deriving measures to counteract
the issues. The key element to improve, assist and optimize the process flow builds a virtual representation of
a product on the shop-floor - called the digital twin or digital shadow. Using the collected data requires a high
data quality, therefore measures to verify the correctness of the data are needed. Based on the described issues
the paper presents a real-time reference architecture for the order processing. This reference architecture
consists of different layers and integrates real-time data from different sources as well as measures to improve
the data quality. Based on this reference architecture, deviations between plan data and feedback data can be
measured in real-time and countermeasures to reschedule operations can be applied.
1 INTRODUCTION
Dynamic environment conditions, shorter product life
cycles and the increasing complexity in the
manufacturing environment are just some of the
problems companies are facing today. Examples are
turbulences in supply chains, shifts in customer
demands’ or quality problems (ElMaraghy et al.
2012). To counteract these issues, companies need to
adapt their processes to these changing conditions
(Christopher 2016). Success factors are a high
process efficiency and real-time information about
processes and objects. Industrie 4.0 is the driving
force to secure the competitiveness of high-wage
countries such as Germany and to expand their
leading position in production technology
(Kagermann et al. 2013; Groten et al. 2015). The
fourth industrial revolution is mainly driven by the
internet of the things and services (Gröger et al.
2016). Industry 4.0 leads to a more resource-efficient
and energy-efficient production through the use of
intelligent production systems (Monostori 2014;
Bauer et al. 2013). Thus, the collection and optimized
usage of data within the manufacturing environment
is essential to develop intelligent production systems
(Gröger et al. 2016; Jeschke et al. 2017). Many
example show that the usage of data analytics
methods has a high potential to increase the efficiency
of value-adding processes (Blue Yonder; IBM;
Terradata; Clear Story Data)
.
The basis for analytics approaches builds a
virtual representation of a product on the shop-floor -
called the digital twin or digital shadow. The digital
twin or digital shadow illustrates the virtual
representation of the production through the
manufacturing data. Similar to a flight data recorder
the relevant data is stored in a time series format
(Blum and Schuh 2016). Although, existing IT
systems provide feedback data from the shop-floor,
they lack a data structure which provides a virtual
representation of a product in real-time. Furthermore,
the data quality is an important issue that is not
addressed in current publications (Abraham et al.
2016). The current state of planning systems can be
summarized to:
• insufficient real-time image of the current
situation of the production in terms of
feedback data
• unstructured data in the variety of IT-
systems
• rigid structures and a lack of adaptability of
planning systems
• no continuous check of the data and their
quality
Blum, M. and Schuh, G.
Towards a Data-oriented Optimization of Manufacturing Processes - A Real-Time Architecture for the Order Processing as a Basis for Data Analytics Methods.
DOI: 10.5220/0006326002570264
In Proceedings of the 19th International Conference on Enterprise Information Systems (ICEIS 2017) - Volume 1, pages 257-264
ISBN: 978-989-758-247-9
Copyright © 2017 by SCITEPRESS – Science and Technology Publications, Lda. All rights reserved
257

• no counter-measures to address the poor
data quality
Considering these problems predictions about the
future state of the production and reliable statements
about the current situation of an order are not
possible. In order to overcome the described issue and
successfully implement methods of data analytics
inside the manufacturing environment this paper
presents a reference architecture that overcomes the
described issue and provides a virtual representation
of a product. Section two addresses basic principles
towards a data-oriented optimization of processes.
The state of the art regarding real-time reference-
architectures is presented in section three and
analyzed in section four. Section five introduces the
concept for a real-time architecture for the order
processing and specifies the different layers. For a
prototypical implementation we present and discuss
an application scenario in a real production
environment. Finally, we discuss und propose further
research directions.
2 MOTIVATION
In this paper, the term analytics in association with
business intelligence is defined as follows: It is
understood as a scientific process of mathematical-
logical transformation of data to improve decision
making. The maturity level of analytical capabilities
can be classified in four stages: descriptive,
diagnostic, predictive and prescriptive analytics
(Sherman 2015; FAIR ISAAC Cooperation 2013).
To differentiate the four stages, the level of data
analysis and human input is analyzed. The descriptive
analytics, the first stage, aims at analyzing large
amounts of data to get an insight of what happened in
the past. It answers the question “What happened?”.
By analyzing the interactions within the data with the
purpose of getting a conclusion of why it happened in
the past. Thus, diagnostic analytics answers the
question “Why did it happen?”. The question “What
will happen?” is covered by predictive analytics.
Predictive and prescriptive analytics support
proactive optimization. Future behavior is predicted
by methods of pattern recognition and the use of other
statistical methods. The last stage, called prescriptive
analytics, answers the question “What should be
done?” by using simulation and optimization
algorithms to suggest or directly implement a
concrete measures. (Stich and Hering 2015).
3 STATE OF THE ART
Although, several publications focus on approaches
regarding real-time architectures which assist in
planning and controlling the manufacturing process,
a scientific investigation of a real-time representation
of a product is only performed in very few research
activities and not dealt with in detail. Furthermore,
measures to improve data quality are not mentioned.
In the following chapter these approaches will be
outlined.
Z
HANG ET AL. 2014 develop a framework for a
real-time data acquisition in production and the
integration of the internet of manufacturing things
(IoMT) into business information systems. The
AutoID-system based IoMT provides real-time
information and status for a dynamic decision
making. Supplied by RFID tags and machine data the
sensor network enables real-time tracking of the
resources and forms an interface between the
production and the superior management information
systems. The data structure of the processing layer
was developed according to the international standard
ISA95 and operates with the B2MML for data
exchange. (Zhang et al. 2014)
G
UO ET AL. 2015 develop and implement a
RFID-based system architecture for the decision-
making process in the production monitoring and
planning of a decentral manufacturing. It is developed
for the application of production planning in the
decentral textile industry, which is characterized by
highly fluctuating order processes, to generate more
transparency about capacities of the locations. It uses
RFID-technologies to collect data, which is analyzed
and reconditioned in a module for a business wide
access. This data is presented in a task-specific way
and every incoming order will be assigned by a
production model to fabrics and production. (Guo et
al. 2015)
L
UO ET AL. 2015 develop a real-time capable
production planning for a hybrid flow shop using a
RFID technology linked production environment.
Luo et al. aim at optimizing the production planning
considering the current progress of an order. To create
a distributed and linked production within the
meaning of ubiquitous computing active RFID reader
and passive RFID tags are used as parts of smart
objects. The shopfloor gateway connects every
working cell gateway, which combine and represent
all RFID objects, with the equivalent production and
it also connects the production with the superior
information system. In addition, the shopfloor
gateway processes the production data by means of
the workflow management module, a MS-UDDI
ICEIS 2017 - 19th International Conference on Enterprise Information Systems
258

server for data distribution and module for monitoring
the working cells. For the schedule of the hybrid flow
shop a multiple periodical hierarchical production
planning algorithm is used. (Luo et al. 2015)
ZHANG ET AL. 2015 develop a method for
controlling a non-clocked material flow based on
real-time information. Based on the real-time
information from the assembly line, exceptions in
order sequence as well as the reaction to failures
should be better controllable, since information about
disturbances is recorded directly at the place of origin.
To collect and distribute real-time information, Zhang
et al. desig an RFID-based system to support the flow
through the use of recorded data. The recorded data is
processed by the developed method in the three
service processes, who track and support the
workflows on the shop floor. Besides the three service
task a second core task handles the data exchange
with the upstream and downstream workstations. The
information can be used to adjust the order scheduling
process based on real-time information. (Zhang et al.
2015)
Z
HONG ET AL 2015 design a model for an
advanced production planning and control based on
RFID technology. In addition to improve production
planning and control via a second-level hierarchical
approach, the goal is to develop and disseminate
guidelines for the implementation and use of a linked
production based on a RFID system. Therefore, the
production is equipped with smart manufacturing
objects and the production planning and control is
dimensioned for a multi layered hybrid flow shop.
The first level of PPS sets the sequence of orders
considering its priorities. The second level determines
the production plan, where orders are divided into
small tasks and added to a job pool. The RFID
network provides real-time data for the planning and
the evaluation of the planning and control regarding
the usability and benefit. (Zhong et al. 2015)
K
ASSNER ET AL. 2015 present a platform and
reference architecture for the integration and analysis
of structured and unstructured data. The presented
platform ApPLAUDING consists of three layers to
integrate, analyze and present the structured and
unstructured data form different sources. To integrate
the data, a mechanism similar to the ETL-Process
extracts and provides it to the second layer. The
second layer is divided into core analytics and value-
added analytics. The last one provides fully-fledged
analytics. The presentation layer provides a user
interface where the analyzed data is presented.
(Kassner et al. 2015)
Y
ANG ET AL. 2016 provide an RFID-enabled
indoor positioning method for a real-time
manufacturing execution system using an extreme
learning machine (ELM). For the localization the
signal levels of RFID tags are analyzed by an adaptive
regression algorithm. The ELM is an algorithm with
just one layer of hidden neurons, which is
characterized by a high adaptability and ability to
generalize. The algorithm for localization is
imbedded into a RT-MES layer and transfers position
data to superior layers. The ELM needs the data and
various activation functions for training and
validation. (Yang et al. 2016)
G
RÖGER ET AL. 2016 provide with Stuttgart IT
Architecture for Manufacturing (SITAM) conceptual
IT architecture for a data driven factory. The
architecture consists of three layers that process the
data of the digital factory and provide it to the user.
In the first layer the data will be collected and a
flexible integration of heterogeneous IT systems is
guaranteed. The second layer of the SITAM analyzes
the data and provides it to the third layer, where the
data is send to manufacturing-specific mobile apps.
Gröger et al. give an overview of possible
implementation scenarios and the benefits of the
SITAM. (Gröger et al. 2016)
S
CHUH AND BLUM design a data structure for the
order processing which aims at providing a virtual
representation of a product during manufacturing,
called the digital twin or digital shadow. This data
structure provides a real-time feedback data in a time
series format and overcomes the lack of current IT-
systems. Therewith, conclusions about past incidents
and a real-time status of an order contribute to
improve manufacturing processes. (Blum and Schuh
2016).
4 REFERENCE ARCHITECTURE
AS A BASIS FOR DATA
ANALYTICS
In this paper we present a real-time reference
architecture for the order processing as a basis for
data analytics. The reference architecture consists of
three layers. A data layer, an integration layer and a
presentation layer (see Figure 1). Based on the
derived requirements for a real-time architecture we
will detail the different layers in the section.
Towards a Data-oriented Optimization of Manufacturing Processes - A Real-Time Architecture for the Order Processing as a Basis for Data
Analytics Methods
259
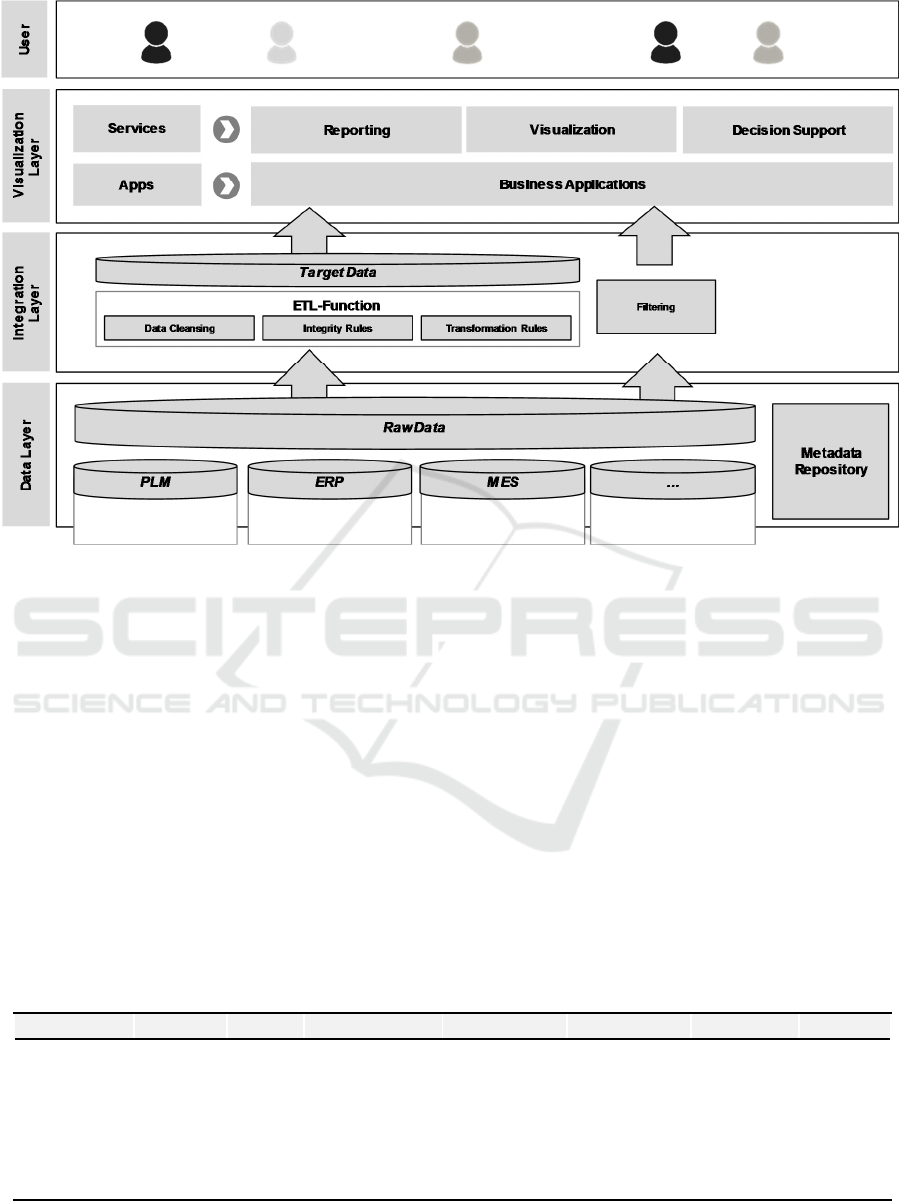
Figure 1: Reference Architecture as a basis for data analytics.
4.1 Data Layer
The data level integrates data from different sources
into a database. For a holistic image of a product on
the shop floor tangible aspects (e.g. the product, the
workstation, etc.) as well as intangible aspects (e.g.
process plans, the geolocation, the status, etc.) are
required. A detailed description of the data structure
can be found in (Blum and Schuh 2016). The
identification of the required data can be determined
by with regard to the following aspects:
Relevance of the data to the production
control
Automatic data acquisition based on sensors
without manual data input
Real-time acquisition of the data
The primary application for the developed data
structure will be single or small batch production.
Thus, a special focus will be on linear and divergent
production structures, the use of alternative resources
and different operations and a semi-automated
production with a high degree of manual process
steps. Based on the production structure transport and
temporary inventories will be considered. The
derived data structure is presented in Figure 2.
To meet the different needs for a real time image
of an order in the form of a digital shadow time
related data is required to specify the time and date
when the data is recorded. Herewith, an entire data
record from the release until the completion of an
order on the shop-floor is made possible. This concept
is comparable to an airplane’s flight data recorder
where data is collected in a time series format and
Figure 2: Data structure for a real-time image of an order. (Blum and Schuh 2016).
Date Time Order Product Geolocation Workstation Process Status
10.01.2016 10:00:01 4711 A1234546788 90, 40 140 -- waiting
10.01.2016 10:00:02 4711 A1234546788 90, 40 140 -- waiting
10.01.2016 10:00:03 4711 A1234546788 90, 40 140 10 set-up
10.01.2016 10:00:04 4711 A1234546788 90, 40 140 10 set-up
10.01.2016 10:00:04 4711 A1234546788 90, 40 140 10 failure
………… … … ……
ICEIS 2017 - 19th International Conference on Enterprise Information Systems
260

stored. The database keeps time-related features by
storing sequences of each value that change with
time. In contrast, a relational database usually stores
just the most recent value. The time-series format
allows to find unique patterns in the data, which are
usually related to trends of changes. In the case of an
airplane trends related to velocity or oil pressure can
be revealed. Transferred to the order processing
deviations from the schedule (e.g. geolocation,
workstation and set-up time) may occur and can be
detected in real-time. Time data represents the
leading characteristic of the data structure. Therefore,
other items of the data structure must refer to it.
Overall aim of a production system is the
manufacturing of the right products in the right way
and quantity, in the correct quality to a specified date
and acceptable costs (Westkämper and Decker 2006).
With the use of operational resources, a
transformation process of raw materials or semi-
finished products into finished parts or products takes
place (Westkämper and Decker 2006). Initial object
of each product is an order from a customer. In a
manufacturing environment, we assume there exist
different orders and products which belong to these
orders, thus each order is a unique identification
number assigned. Furthermore, order data
incorporates different product identification numbers
to determine between different products of an order.
Based on the integration of new sensor
technologies (e.g. real-time location system (RTLS)
and radio frequency identification (RFID)) a live
tracking of an order is possible. RTLS tags are
applied to the product or the container and transmit
the geolocation. Tracking the geolocation is
necessary in order to ensure the routing of the order
between two points. This enables to determine the
current location of the order. Featured by the use of
sensor technologies and a real-time routing, the status
of an order between different steps in the working
plan can be obtained.
A production process consists of different process
steps which are needed to produce a product. Items
are tracked in relation to the working plan, e.g., the
workstation and the process. These processes can be
distinguished according to N
YHUIS A. WIENDAHL into
the following process steps:
laytime before and after processing,
transport time
set-up time and
processing time.
Furthermore, the resources on which the
operations are performed need to be specified. VDI-
Norm 2815 specifies the different resources in a
manufacturing environment. These include machines
as well as means of transport (VDI 2815).
Based on the current process step carried out the
status can be derived and logged. The attributes are
defined by the different timestamps in the database.
To calculate time related data (e.g. absolute
production time, set-up time, transition time) the
status is needed. With these information conclusions
about the current state of an order as well as ex post
analysis are conducted. Based on the data record
orders with the same production processes can be
compared and reasons for deviations can be revealed.
This enables the user to determine on which
workstations operations have been performed to
complete the order as well as the current operation
status.
4.2 Integration Layer
The integration layer includes functionalities for
securing the data quality. From a product point of
view, quality is defined as the processing of a set of
characteristics (9000:2015, 2015-11-00). In statistical
process control quality has a long history where it is
used to ensure product conformity as well as for the
optimization of processes. When it comes to data,
quality is more difficult to define. Compared to
products, data do not have physical properties which
allow to assess the quality. According to Wang and
Strong the dimensions of data quality can be
differentiated in four dimensions and 15
characteristics. For the derived data structure only
characteristics are considered which contribute to an
improvement of the identified influencing factors and
can be measured quantitatively. Therefore, only
characteristics like completeness and accuracy are
considered in detail. Deviations are defined as the
difference between an acquired parameter and its true
value. For the derived data structure deviations can
occur due to signal losses of the sensors or magnetic
interferences. The data is extracted from the different
sources using ETL-functions from the integration
layer. The ETL-process consists of three different
steps. Extraction includes extraction of the data out of
the core system and external sources. The
transformation step applies a set of rules to clean and
transform the data. The last step, loading, ensures that
the data is loaded to a target database.
Within Figure 3 the feedback data of a product in
a time series format is shown. Although, data was
recorded for the date, time, order, product and status
without any errors or wrong data, the geolocation
contains wrong and missing data. As already
explained, these wrong or missing data can occur due
Towards a Data-oriented Optimization of Manufacturing Processes - A Real-Time Architecture for the Order Processing as a Basis for Data
Analytics Methods
261
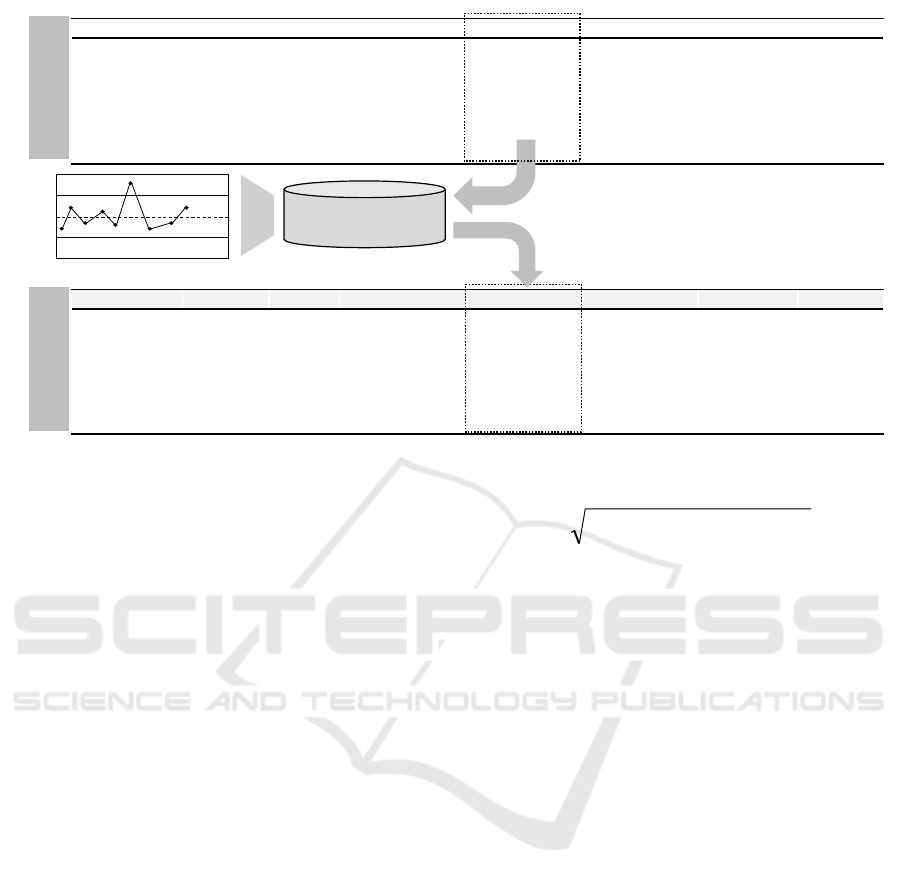
Figure 3: Changing the data by the application of integrity rules.
to magnetic interferences or signal losses. To detect
wrong or missing data and to be able to improve data
quality a set of rules is applied to the data structure.
These rules are known as integrity rules. For example,
a given value is only allowed in a specified range or
must contain defined symbols. In the following, we
explain how integrity rules are applied to the derived
data structure (see Figure 3).
Missing data can be restored by the application of
mathematical models. In the area of statistics
imputation processes can substitute missing data by
estimating the missing values based on other
available data in the data structure. Based on hot deck
imputation, each of the time stamps is examined and
the most similar value is substituted for the missing
data value. In the example above, the timestamps
before and after the missing data remain at the same
values. Based on the most similar timestamps, hot
deck imputation can be used to substitute the missing
data. In the case of varying geolocation values,
mathematical models can be used to estimate and
substitute missing values (e.g. linear and non-linear
models).
The identification of wrong data inside the data
structure takes place by the application of integrity
rules. For that, the following rules can be applied. To
detect wrong values inside the Geolocation data sets
the Pythagorean theorem is used. The Pythagorean
theorem is suitable for the distance computation in the
two-dimensional space. In this case the theorem is
used to calculate the deviation l of Geolocations
between two time steps (1).
2
1
2
1
)()(
−−
−+−=
iiii
yyxxl
(1)
For the example shown in Figure 3, the deviation
between the first and second time step is to 41.23
units. If the deviation between two time steps exceeds
a predefined range, e.g. more than 10 units, integrity
checks will mark the data as wrong. The predefined
value could be defined by the distance a production
object could be transported by a pallet transporter or
automated guided vehicle.
In the data structure, the error may occur that a
value of the Geolocation with a deviation occurs
between two equal values. This can result in a
deviation of status, process or machine.
To check for wrong data in the process order, a
state transition model could be used. This model
describes the states (e.g. process steps) and the
actions that lead to state changes. With such a model
a production process order could be described. The
integration rules can use the state transitions model to
check the process step sequence and, if necessary,
enter the correct process step.
After checking the data for incorrect and missing
values, the data are cleansed and transformed in the
corrected target data. There are various methods to
clean up the data. To replace missing or wrong
Geolocation data of a moving production object the
method of linear interpolation could be used. The hot
deck imputation can be used to replace missing or
wrong data in other columns of the data structure. The
hot deck imputation uses data values of the actual data
set to fill the or correct the wrong data. If there is no
Date Time Order Product Geolocation Workstation Process Status
10.01.2016 10:00:01 4711 A1234546788 90, 40 -- -- waiting
10.01.2016 10:00:02 4711 A1234546788 50, 30 -- -- waiting
10.01.2016 10:00:03 4711 A1234546788 90, 40 -- -- waiting
10.01.2016 10:00:04 4711 A1234546788 NULL -- -- waiting
10.01.2016 10:00:05 4711 A1234546788 90, 40 --
--
waiting
………… … … ……
Date Time Order Product Geolocation Workstation Process Status
10.01.2016 10:00:01 4711 A1234546788 90, 40 -- -- waiting
10.01.2016 10:00:02 4711 A1234546788 90, 40 -- -- waiting
10.01.2016 10:00:03 4711 A1234546788 90, 40 -- -- waiting
10.01.2016 10:00:04 4711 A1234546788 90, 40 -- -- waiting
10.01.2016 10:00:05 4711 A1234546788 90, 40 --
--
waiting
………… … … ……
Raw DataTarget Data
Integrity
rules
Deviation
Time
ICEIS 2017 - 19th International Conference on Enterprise Information Systems
262

data for an imputation or a linear interpolation cannot
be applied the data record of this time step must be
deleted.
4.3 Visualization Layer
In order to make proper decisions, users are usually
required to scan and integrate various data sets. Since
users mostly act as final decision makers, the
complexity of the displayed information can have a
substantial impact on the decision quality. To support
the user in the decision process, a visualization layer
is implemented in the reference model to reduce the
complexity of the compared data. The dashboard
visualizes the data and especially deviations between
the real-time feedback data and the plan data found in
the underlying layer of the model. In addition, the
dashboard notifies the user about deviations of the
order processes on the shop floor. This notifications
and visualizations are combined with the upper and
lower limits of the allowed deviations.
Furthermore, the visualization layer’s dashboard
represents both an aggregated view that summarizes
all orders, as well as each order and its deviations.
5 APPLICATION
A prototypical implementation based on the derived
reference model and data structure to a demonstration
factory is ongoing. The Demonstrationsfabrik
Aachen (DFA) within in the Campus Cluster Smart
Logistic will provide an excellent environment to
validate the results of the research in real production
area of 1600 square metres. In the DFA an electric go-
kart is built. During the production, data is generated
and then compared with the plan data to observes
changes in the order process. Based on the real time
data of an order, deviations in the processing can be
uncovered in the moment when the location or the
process step differ from the planned ones. Therefore,
feedback and plan data are compared with maximum
and minimum limit.
6 CONCLUSION AND FURTHER
RESEARCH
In this research paper a real-time reference
architecture for the order processing as a basis for
data analytics is developed which aims at providing a
design aid towards a data oriented optimization of
manufacturing processes. After introducing the
preconditions of the model the structural framework
of a reference architecture for the order processing
was derived. The reference architecture consists of
different layers: a data layer, an integration layer and
a virtualization layer. The data layer provides a real-
time image in the form of a virtual representation of a
product, called the digital twin or digital shadow.
Therefore, different data sources (e.g., order,
geolocation and status) have to be integrated to derive
a holistic image of the order processing. In order to
determine the quality of the data, relevant dimensions
of data quality for the data structure are derived and
integrity rules are formulated. By doing this, wrong
and missing data can be identified and data can be
restored. The virtualization layer provides the user
with the relevant information. Therewith, users can
assess the current status of a product in real-time or
derive counter measures if deviations between
planned and feedback data occur. For enabling the
implementation of the model, practical implications
have been carried out. The reference architecture
builds a framework towards a data-oriented
optimization and a basis for the use of data analytics
methods. Therewith, conclusions about past incidents
and a real-time status of an order contribute to
improve manufacturing processes. Further research is
needed to substantiate the presented solution
principles. Directions of further work include the use
of redundant information provided by sensors, the
handling of the geolocation and the transfer of the
solution principles to other domains (e.g. supply
chain and service).
ACKNOWLEDGMENT
The presented research is result of the Cluster of
Excellence (CoE) on “Integrative Production
Technology for High-Wage Countries” funded by
Deutsche Forschungsgemeinschaft (DFG). The
authors would like to thank the German Research
Foundation DFG for the kind support within the
Cluster of Excellence „Integrative Production
Technology for High-Wage Countries.
REFERENCES
Abraham A, Kovalev S, Tarassov V, Snášel V (eds) (2016)
Proceedings of the First International Scientific
Conference “Intelligent Information Technologies for
Industry” (IITI’16). Advances in Intelligent Systems
and Computing. Springer International Publishing,
Cham
Towards a Data-oriented Optimization of Manufacturing Processes - A Real-Time Architecture for the Order Processing as a Basis for Data
Analytics Methods
263

Bauer K, Diegener B, Herfs W, Löwen U, Stumpf V (2013)
Umsetzungsempfehlungen für das
ZukunftsprojektIndustrie 4.0: Abschlussbericht des
Arbeitskreises Industrie 4.0. Accessed 22 September
2016
Blue Yonder Platform as a service. https://www.blue-
yonder.com/de/loesungen/replenishment-optimization.
Accessed 12 December 2016
Blum M, Schuh G (2016) Design of a Data Structure for the
Order Processing as a Basis for Data Analytics
Methods. In: Proceedings of Portland International
Conference on Management of Engineering
& Technology (PICMET), Honolulu, Hawaii
Christopher M (2016) Logistics & supply chain
management, Fifth Edition. Always learning. Pearson
Education, Harlow, England, New York
Clear Story Data Manufacturing: Turn your agile supply
chain into a competitive advantage.
http://www.clearstorydata.com/manufacturing/
9000:2015 (2015-11-00) Quality management systems.
DIN Deutsches Institut für Normung e. V, Berlin
ElMaraghy W, ElMaraghy H, Tomiyama T, Monostori L
(2012) Complexity in engineering design and
manufacturing. CIRP Annals - Manufacturing
Technology 61(2):793–814. doi:
10.1016/j.cirp.2012.05.001
FAIR ISAAC Cooperation (2013) Business Intelligence
and Big Data Analystics: Speeding the Cycle from
Insights to Action Four Steps to More Profitable
Customer Engangement. http://docplayer.net/3343658-
Business-intelligence-and-big-data-analytics-speeding-
the-cycle-from-insights-to-action-foursteps-to-more-
profitable-customer-engagement.html
Gröger C, Kassner L, Hoos E, Königsberger J, Kiefer C,
Silcher S, Mitschang B (2016) The Data-driven Factory
- Leveraging Big Industrial Data for Agile, Learning
and Human-centric Manufacturing. In: 18th
International Conference on Enterprise Information
Systems, pp 40–52
Groten M, Kraut A, Pause D, Starick C, Ihne M, Enriquez
M (2015) Digitalisierung der Supply-Chain. Zeitschrift
für wirtschaftlichen Fabrikbetrieb 110(12):2–4
Guo ZX, Ngai E, Yang C, Liang X (2015) An RFID-based
intelligent decision support system architecture for
production monitoring and scheduling in a distributed
manufacturing environment. International Journal of
Production Economics 159:16–28. doi:
10.1016/j.ijpe.2014.09.004
IBM Descriptive, predictive, prescriptive: Transforming
asset and facilities management with analytics.
https://static.ibmserviceengage.com/TIW14162USEN.
PDF. Accessed 12 December 2016
Jeschke S, Brecher C, Song H, Rawat DB (eds) (2017)
Industrial Internet of Things. Springer Series in
Wireless Technology. Springer International
Publishing, Cham
Kagermann H, Wahlster W, Helbig J (2013)
Recommendations for Recommmendations for
implementing the strategic initiative INDUSTRIE 4.0:
Securing the future of German manufacturing industry
Kassner L, Gröger C, Mitschang B, Westkämper E (2015)
Product Life Cycle Analytics – Next Generation Data
Analytics on Structured and Unstructured Data.
Procedia CIRP 33:35–40. doi:
10.1016/j.procir.2015.06.008
Luo H, Fang J, Huang GQ (2015) Real-time scheduling for
hybrid flowshop in ubiquitous manufacturing
environment. Computers & Industrial Engineering
84:12–23. doi: 10.1016/j.cie.2014.09.019
Monostori L (2014) Cyber-physical Production Systems:
Roots, Expectations and R&D Challenges. Procedia
CIRP 17:9–13. doi: 10.1016/j.procir.2014.03.115
Sherman R (2015) Business intelligence guidebook: From
data integration to analytics. Elsevier, Amsterdam
Stich V, Hering N (2015) Daten und Software als
entscheidender Wettbewerbsfaktor. industrie 4.0
magazin 1:9–13
Terradata Business Analytics Challenges: Solved.
http://www.teradata.de/business-analytics-
solutions/?LangType=1031&LangSelect=true.
Accessed 12 December 2016
VDI 2815 Terms of production engineering and control.
VDI Verein Deutscher Ingenieure, Berlin
Westkämper E, Decker M (2006) Einführung in die
Organisation der Produktion. Springer-Lehrbuch.
Springer-Verlag Berlin Heidelberg, Berlin, Heidelberg
Yang Z, Zhang P, Chen L (2016) RFID-enabled indoor
positioning method for a real-time manufacturing
execution system using OS-ELM. Neurocomputing
174:121–133. doi: 10.1016/j.neucom.2015.05.120
Zhang Y, Xu J, Sun S, Yang T (2015) Real-time
information driven intelligent navigation method of
assembly station in unpaced lines. Computers &
Industrial Engineering 84:91–100. doi:
10.1016/j.cie.2014.09.007
Zhang Y, Zhang G, Wang J, Sun S, Si S, Yang T (2014)
Real-time information capturing and integration
framework of the internet of manufacturing things.
International Journal of Computer Integrated
Manufacturing 28(8):811–822. doi:
10.1080/0951192X.2014.900874
Zhong RY, Huang GQ, Lan S, Dai QY, Zhang T, Xu C
(2015) A two-level advanced production planning and
scheduling model for RFID-enabled ubiquitous
manufacturing. Advanced Engineering Informatics
29(4):799–812. doi: 10.1016/j.aei.2015.01.002
ICEIS 2017 - 19th International Conference on Enterprise Information Systems
264
