
Moodle Predicta: A Data Mining Tool for Student Follow Up
Igor Moreira F
´
elix
1
, Ana Paula Ambr
´
osio
1
, Priscila Silva Neves
1
,
Joyce Siqueira
1
and Jacques Duilio Brancher
2
1
Instituto de Inform
´
atica, Universidade Federal de Goi
´
as, Goi
ˆ
ania, Brazil
2
Departamento de Computac¸
˜
ao, Universidade Estadual de Londrina, Paran
´
a, Brazil
Keywords:
Educational Data Mining, Moodle, Prediction, Tool, Virtual Learning Environment.
Abstract:
Educational data mining (EDM) aims to find useful patterns in large volumes of data from teaching/learning
environments, increasing academic results. However, EDM requires previous and deep knowledge of data
mining methods and techniques, involving several computing paradigms, preprocessing and results’ interpre-
tation. In this paper, Moodle Predicta, an educational data mining desktop tool is presented. This software is
developed in Java and enables non-expert data mining users to enjoy benefits from EDM, within the Moodle
system. Divided in two modules, Moodle Predicta allows: (i) visualization of Moodle courses data; and (ii)
predict students’ performance.
1 INTRODUCTION
With the advances in information and communica-
tion technologies (ICT), distance learning has grown,
allowing people in remote locations to access cour-
ses with better educational content, where students
can make their own agenda, schedules and define the
time spent studying (Zacharis, 2015). Furthermore,
distance education has allowed institutions to incre-
ase the number of students (Garc
´
ıa-Saiz and Zorrilla,
2012), (Olama et al., 2014).
In Brazil, distance learning registered 1.2 mil-
lion enrollments in 2006. By 2015 this number
had tripled, presenting more than 3.8 million enrol-
lments, distributed in 25,000 courses, taught semi or
totally at a distance (ABED – Associac¸
˜
ao Brasileira
de Educac¸
˜
ao a Dist
ˆ
ancia, 2015). This is a global mo-
vement. According to a 2013 report of the Online
Learning Consortium’s Survey of Online Learning, in
the USA, over 7.1 million students were taking at le-
ast one online course, and the number of students ta-
king at least one online course has continued to grow
at a rate far in excess of overall enrollments (Allen
and Seaman, 2014). These courses range from clas-
ses in free programs and from face to face programs,
to complete graduation and professionals master de-
grees (Marquez-Vera et al., 2013).
However, in distance learning there is a huge gap
between the number of new students and the num-
ber of graduates. In Brazil, in 2014, online courses
presented a 25% dropout rate (ABED – Associac¸
˜
ao
Brasileira de Educac¸
˜
ao a Dist
ˆ
ancia, 2015). Roughly,
950,000 students did not finish the course they star-
ted. This generates losses to public and private insti-
tutions, because the costs to conduct the course is not
reduced with the decrease in the number of partici-
pants.
Students have pointed out that the main cause for
dropout is the lack of time to study and to participate
in activities (Pierrakeas et al., 2004). Considering that
students often have a job or do domestic activities, it
is hard to keep up their routine of learning. Further-
more, students have justified that dropout is related to
the difficulty to adapt to the distance learning metho-
dology and to the tools used, such as the virtual le-
arning environment (VLE) used (ABED – Associac¸
˜
ao
Brasileira de Educac¸
˜
ao a Dist
ˆ
ancia, 2015), (Pierra-
keas et al., 2004).
VLE is a software used in the distribution of on-
line courses available in the internet, offering sup-
port to several teaching activities that may go from
the delivery of pedagogical content to monitoring stu-
dents’ progress. To do that, VLE has many tools,
including: forums, chats, pedagogical resources and
quizzes (Romero et al., 2013). Among the available
VLEs, there are some that are free and open source
software (Moodle and Canvas) and others that are
private (Blackboard and Desire2Learn) (EDUCAUSE
Center for Analysis and Research, 2014).
While offering support, these VLEs register many
Félix, I., Ambrósio, A., Neves, P., Siqueira, J. and Brancher, J.
Moodle Predicta: A Data Mining Tool for Student Follow Up.
DOI: 10.5220/0006318403390346
In Proceedings of the 9th International Conference on Computer Supported Education (CSEDU 2017) - Volume 1, pages 339-346
ISBN: 978-989-758-239-4
Copyright © 2017 by SCITEPRESS – Science and Technology Publications, Lda. All rights reserved
339

details of student’s behavior inside the platform, for
example: activities visualized, answered and their
grades. A part of this information is available for ana-
lysis inside the virtual environment, through summary
statistics and reports of student’s participation in: fo-
rums, chats and other available resources, allowing
the analysis of the cohort or of a given student (Ro-
mero and Ventura, 2010).
Activity tracking allows teachers and tutors to fol-
low up and monitor student’s performance and even-
tually detect who is risking dropout, failing the course
or has some learning difficulty (Bogar
´
ın et al., 2014).
However, many cohorts contain a large number of stu-
dents, so teachers have difficulty in dealing with all
the data properly. Although some information is avai-
lable in several system generated reports, teachers of-
ten have difficulty interpreting them. Furthermore,
these reports state facts but do not interpret the re-
sults, trying to identify students in danger of failure,
leaving this analysis to the teachers.
With the goal of analyzing this data automati-
cally, different techniques have been used. A promi-
sing approach is the use of data mining (DM) (Da-
nubianu, 2015) (Sharma and Mavani, 2011), (e Ri-
cardo Araujo e Douglas Detoni, 2015), (Moradi et al.,
2014). DM allows the abstraction of relevant infor-
mation stored in databases. By being relieved of the
task of analysis and prediction, teachers can focus on
the pedagogical aspects of teaching, leaving the iden-
tification of at-risk students to data mining.
This paper presents a Java desktop tool for stu-
dent follow up, called Moodle Predicta. The system
connects to Moodle databases, selecting tables accor-
ding to user requirements, and prepares the data to be
analyzed in WEKA data mining software (Hall et al.,
2009), that is integrated with the tool. After data pre-
processing, Moodle Predicta presents a summary of
the results in a visualization module. A second com-
ponent of the system is used to predict students’ final
performance. Based on selected data the tool indica-
tes if a student may be at risk of failure or dropout.
This paper presents the research associated to the
definition of Moodle Predicta and its implementation,
and is organized as follows. Section 2 introduces the
Moodle virtual environment; section 3 presents rela-
ted work and the main topics in Educational Data Mi-
ning associated to the project; section 4 introduces the
Moodle Predicta tool; section 5 represent conclusion
and future work.
2 Moodle
Moodle (Modular Object-Oriented Dynamic Lear-
ning Environment) has more than 93 million users
distributed in 71,000 registered environments in 231
countries (Moodle.org, 2016b). Today it is the most
widely used open source virtual learning environ-
ment for distance education around the world (EDU-
CAUSE Center for Analysis and Research, 2014).
Moodle enables educators and institutions to cre-
ate and manage effective online learning communi-
ties, development flexible and comprehensive online
courses and experiences. Moodle’s modular design
makes it easy to create new courses, adding con-
tent that will engage learners. Moodle was designed
and developed oriented by the social constructionist
pedagogical methodology, where new knowledge is
constructed when students interact with the content
(Moodle.org, 2016a).
Moodle logs record and keep track of what resour-
ces students have accessed, modified, created and re-
moved, logging every click that students and teachers
make in navigation. However, it offers a limited log
viewing module that is built into the system. Logs
can be filtered by course, participant, period and re-
source. If interested, teachers can use these logs to
determine who has been active in the course, what
they did, and when they did it. For quizzes and acti-
vities, the score and elapsed time are available, and a
comparative analysis of each student with the others
(Bapu et al., 2015).
The Moodle virtual learning environment registers
three different user interactions associated to distance
learning (Moore, 1989):
• Student-student interactions: are related to the
exchanges between the students enrolled in the
course. For example: chats and massages in
forums or workgroups (Agudo-Peregrina et al.,
2012).
• Student-teacher interactions: are related to the
participation of teachers in which students per-
ceive a teacher’s proximity through online pre-
sence. Example: messages from teachers to stu-
dents answering questions about course topics
(Agudo-Peregrina et al., 2012).
• Student-content interactions: these occur when
students make use of many of the content resour-
ces, such as textbooks, documents, research ma-
terials, videos and other learning contents. In
Moodle, they are usually associated to brow-
sing and accessing different resources, tasks, etc.
(Agudo-Peregrina et al., 2012).
Moodle environment does not store logs as a sim-
CSEDU 2017 - 9th International Conference on Computer Supported Education
340

ple text files. It registers the logs, and all information
in a relational database. It is possible to use different
management systems, like MySQL, Oracle, Access
and others (Moodle.org, 2016b).
Moodle allows teachers to get full reports on the
activities of a unique student, or of all students for a
specific activity or resource. This is useful to check if
everyone has done a certain task or spent time online
within some specific resource.
However, all this data is usually raw, without any
form of intelligent processing, so users have used dif-
ferent tools for Moodle data analysis. For example
(Danubianu, 2015):
• GISMO – tool for data visualization, that uses log
data from Moodle, allows its edition and produces
graphical information that can be used by teachers
to understand social, cognitive and behavioral stu-
dent interactions;
• MocLog – includes a set of tools, built based on
GISMO, that can be used for the analysis and pre-
sentation of data within Moodle;
• Analytics and recommendation – plug-in avai-
lable in a supplement component to be instal-
led within Moodle, that can be used by teachers
and students for visualization of students’ invol-
vement and to recommend activities.
3 EDUCATIONAL DATA MINING
Educational Data Mining (EDM) is a relatively re-
cent research field, that emerges from two converging
trends: the increasing use of VLE in educational in-
stitutions, and the application of data mining techni-
ques to business intelligence processes in organizati-
onal information (Agudo-Peregrina et al., 2012).
Data mining (DM) represents automated disco-
very of implicit and interesting patterns from large
amount of data. DM is an interdisciplinary scien-
tific area which involves several computing para-
digms: rule induction, decision tree, Bayesian lear-
ning, Neural networks, etc. Largely used data mining
techniques include classification, clustering, associa-
tion rule mining, visualization and statistics (Avlija
ˇ
s,
2016). Developed tools that automatize this process
help teachers analyze and visualize learning data in
order to recognize useful patterns and evaluate the ef-
fectiveness of the course and students’ participation.
Researches have been conducted with data mining
to analyze Moodle data and logs. Some of them are
summarized in Table 1, presenting the data mining al-
gorithms and techniques used, as well as the attributes
considered for students’ prediction.
As in data mining, the educational data mining
process in VLE follows four steps (Avlija
ˇ
s, 2016),
(Romero et al., 2008b):
• Data collection: while the students use the system,
information is collected and stored in the data-
base. In Moodle, the data is collected in system
logs.
• Preprocessing: after data collection, the data is
transformed into suitable formats for analysis.
Usually software is used for data preprocessing.
• Data mining: with the aim of developing a model
and discovering useful patterns, the appropriate
data mining algorithms are applied at this stage.
• Results evaluation: in this last step, educators
interpret the obtained results and use discovered
knowledge to improve the learning and decision
making process.
Several surveys give a general overview of EDM
research being conducted and DM in VLE is of-
ten mentioned. Romero and Ventura (Romero and
Ventura, 2007), covers researches published between
1995 and 2005, being extended in 2010 (Romero and
Ventura, 2010), Baker and Yacef (Baker and Yacef,
2009), was published in 2009, Jindal and Borah (Jin-
dal and Borah, 2013), covers research published bet-
ween 1998 and 2012, Pe
˜
na-Ayala (Pe
˜
na-Ayala, 2014),
papers published between 2010 and 2013, and Thakar
(Thakar, 2015) (2002-2014), present a state of the art
review in EDM and research trends in this domain.
Luan (Luan, 2002) discusses potential applications of
EDM in higher education.
(Romero et al., 2008b), gives a broad overview of
the use of data mining in the Moodle learning ma-
nagement system. They argue that data mining in
virtual learning environments represents an iterative
process, that allows improvement of the overall lear-
ning and decision making process. In this paper, they
apply educational data mining and give suggestions
to instructors and e-learning administrators on how to
conduct their own research.
(Kotsiantis et al., 2010) proposed a combination
of three algorithms: Naive Bayes, the 1-NN and the
WINNOW, using the voting methodology. (Avlija
ˇ
s,
2016), after rigorous data preprocessing and discre-
tization, applies Apriori algorithm to generate asso-
ciation rules to predict student performance outco-
mes and identify students who require special atten-
tion from teachers to increase the overall success ra-
tio. Results present 99% accuracy rate.
In (Yoshida et al., 2013), an algorithm was deve-
loped to determine failure of learning, using quiz ans-
wers as input. The result is a class used to determine
if a student is at risk or not. The algorithm is based
Moodle Predicta: A Data Mining Tool for Student Follow Up
341
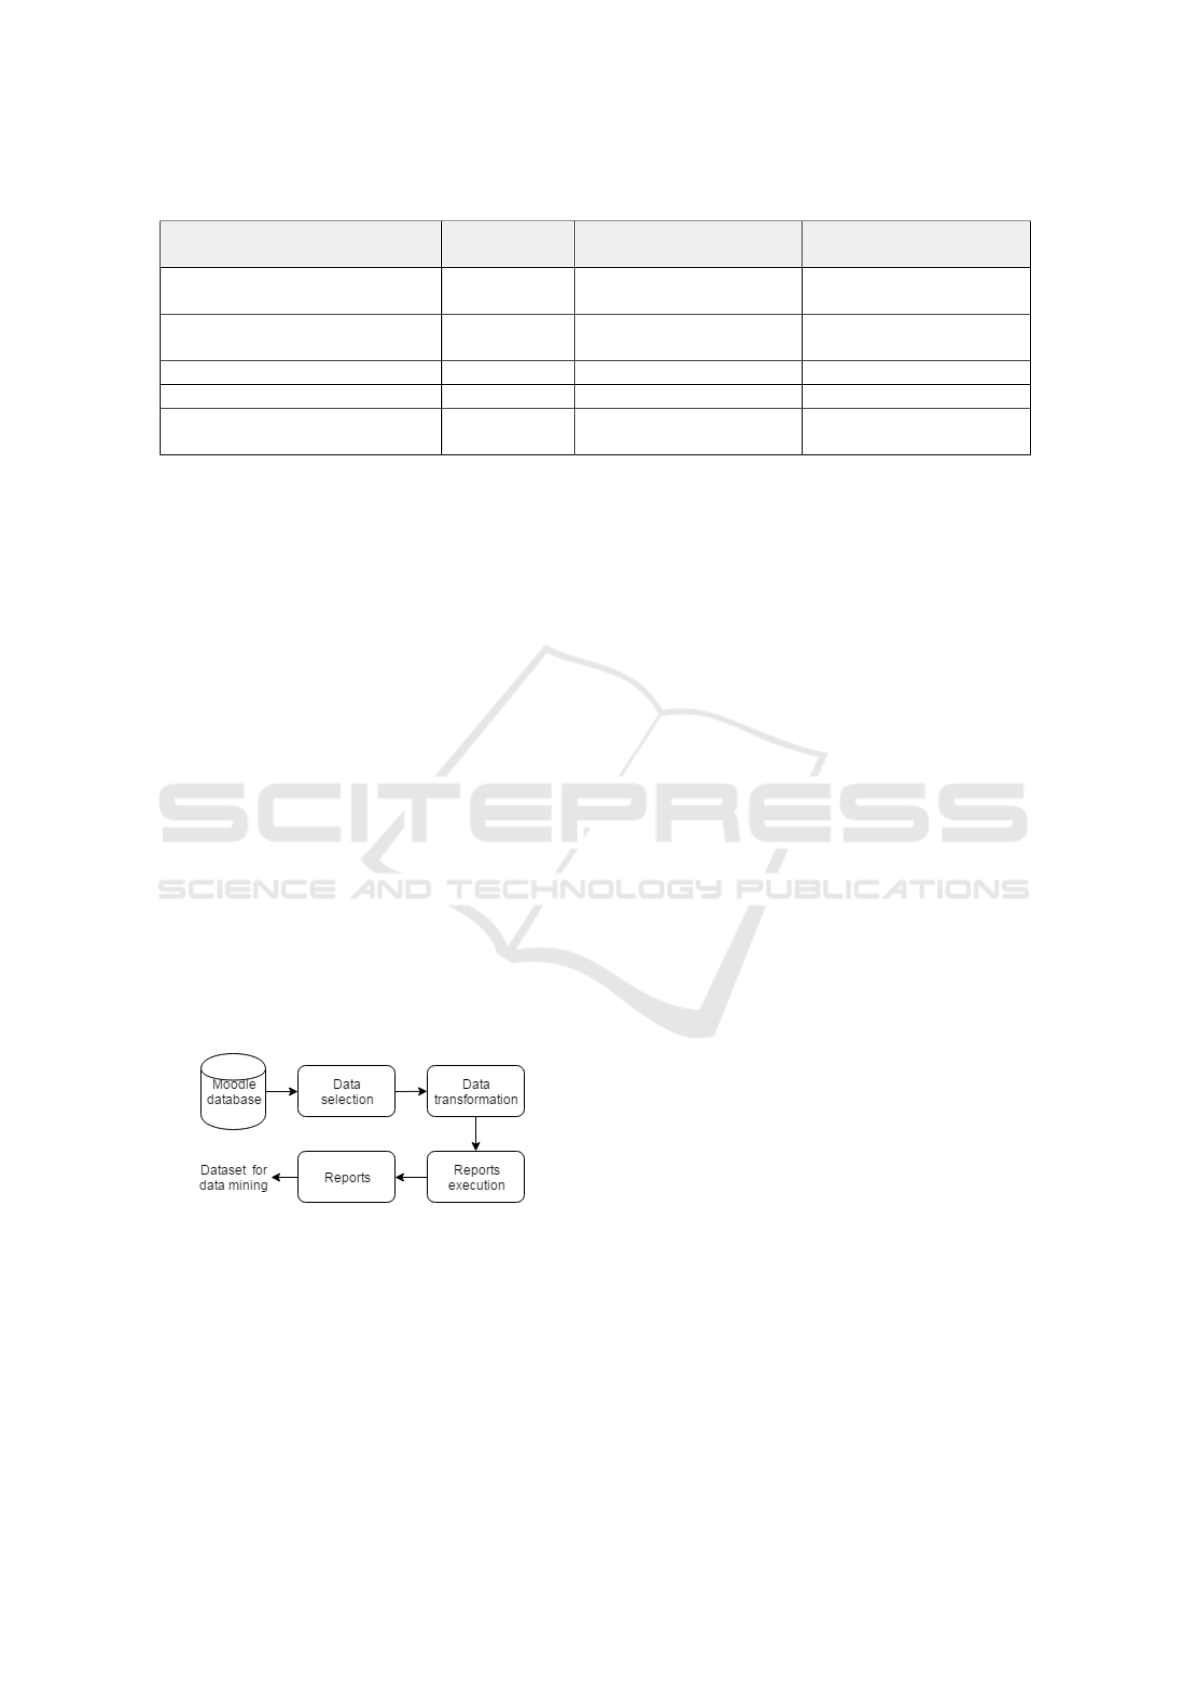
Table 1: Related work.
Research
Data mining
tecnhique
Data mining algorithms
Attributes
(Neto and Castro, 2015) Association Apriori
Accesses and forum logs,
chats and tasks
(Gu
´
ercio et al., 2014) Classification
Decision trees
(RandomTree and J48)
Interaction logs
and forums
(Sisovic et al., 2016) Clustering K-Means Resources logs
(Sorour et al., 2015) Classification Support Vector Machine Students’ comments
(Zorrilla and Garcia-Saiz, 2014) Classification
NearestNeighbours, Jrip,
J48 and NaiveBayes
Interaction logs
on statistics analysis, reaching a maximum accuracy
of 88.9%. (Romero et al., 2008a) compared different
data mining methods and techniques to classify stu-
dents based on their Moodle usage data and the final
marks obtained in their courses.
4 Moodle PREDICTA
Moodle Predicta is a tool developed in Java that al-
lows users to connect into any version of the Moodle
database, as well as different management systems,
such as MySQL, Oracle, PostgreSQL and others.
Moodle Predicta is divided in two parts: visualization
and prediction modules.
4.1 Visualization Module
The visualization module allows users to have an
overview of student and teacher behavior, interacti-
ons, personal data, and academic performance. By
means of reports containing relevant information, the
module enables teachers to evaluate the course struc-
ture, content and its effectiveness.
Figure 1: Diagram of visualization module.
To bring the processed data to the user, the visu-
alization module is composed of four main steps, in-
volving data preprocessing, algorithms execution and
formatting (Figure 1):
i Data selection – in this step, the data is selected,
according to user requirements.
ii Data transformation – after selection, the data is
gathered and transformed/discretized.
iii Reports execution – in this stage, the reports are
generated.
iv Reports – the reports are presented to the user.
The software was developed for non-expert data
mining users. The configuration requires few inputs
in an easy to use interface. The options selected by the
user are stored in a CSV (Comma Separated Values)
local file. This allows the software to load the same
configuration in the next execution.
The first step in the visualization module execu-
tion is the connection to database. The connection
is established into local or remote servers, according
to users’ requirements. The connection is guided
by Java Database Connectivity (JDBC). Therefore,
any database that implements JDBC API (Application
Programming Interface) should connect successfully.
After the connection is established, all database
schemas in the node are listed. This list is constructed
by a Java method in the JDBC API. The list is presen-
ted to the user, so he can choose the Moodle installa-
tion to be analyzed.
Once the user has selected the desired Moodle da-
tabase, he is asked for a specific course on next screen
(Figure 3). To make the selection, Moodle Predicta
creates a hierarchical structure of courses, according
to categories and subcategories that are stored in the
selected Moodle database. This structure is the same
presented in the Moodle database schema.
When the course is selected, a new screen is pre-
sented to the user, so he can choose the attributes, as
seen in Figure 4. The selected attributes will compose
the reports, and include: forums, chats, quizzes, logs,
grades, and tasks. Once the user makes the selection,
Moodle Predicta generates a file as the final result.
This file can be in three different formats:
i HTML (HyperText Markup Language) – format
indicated for data visualization. The file is gene-
rated according to standard characters encode and
definitions, and can be opened in any web brow-
ser.
CSEDU 2017 - 9th International Conference on Computer Supported Education
342
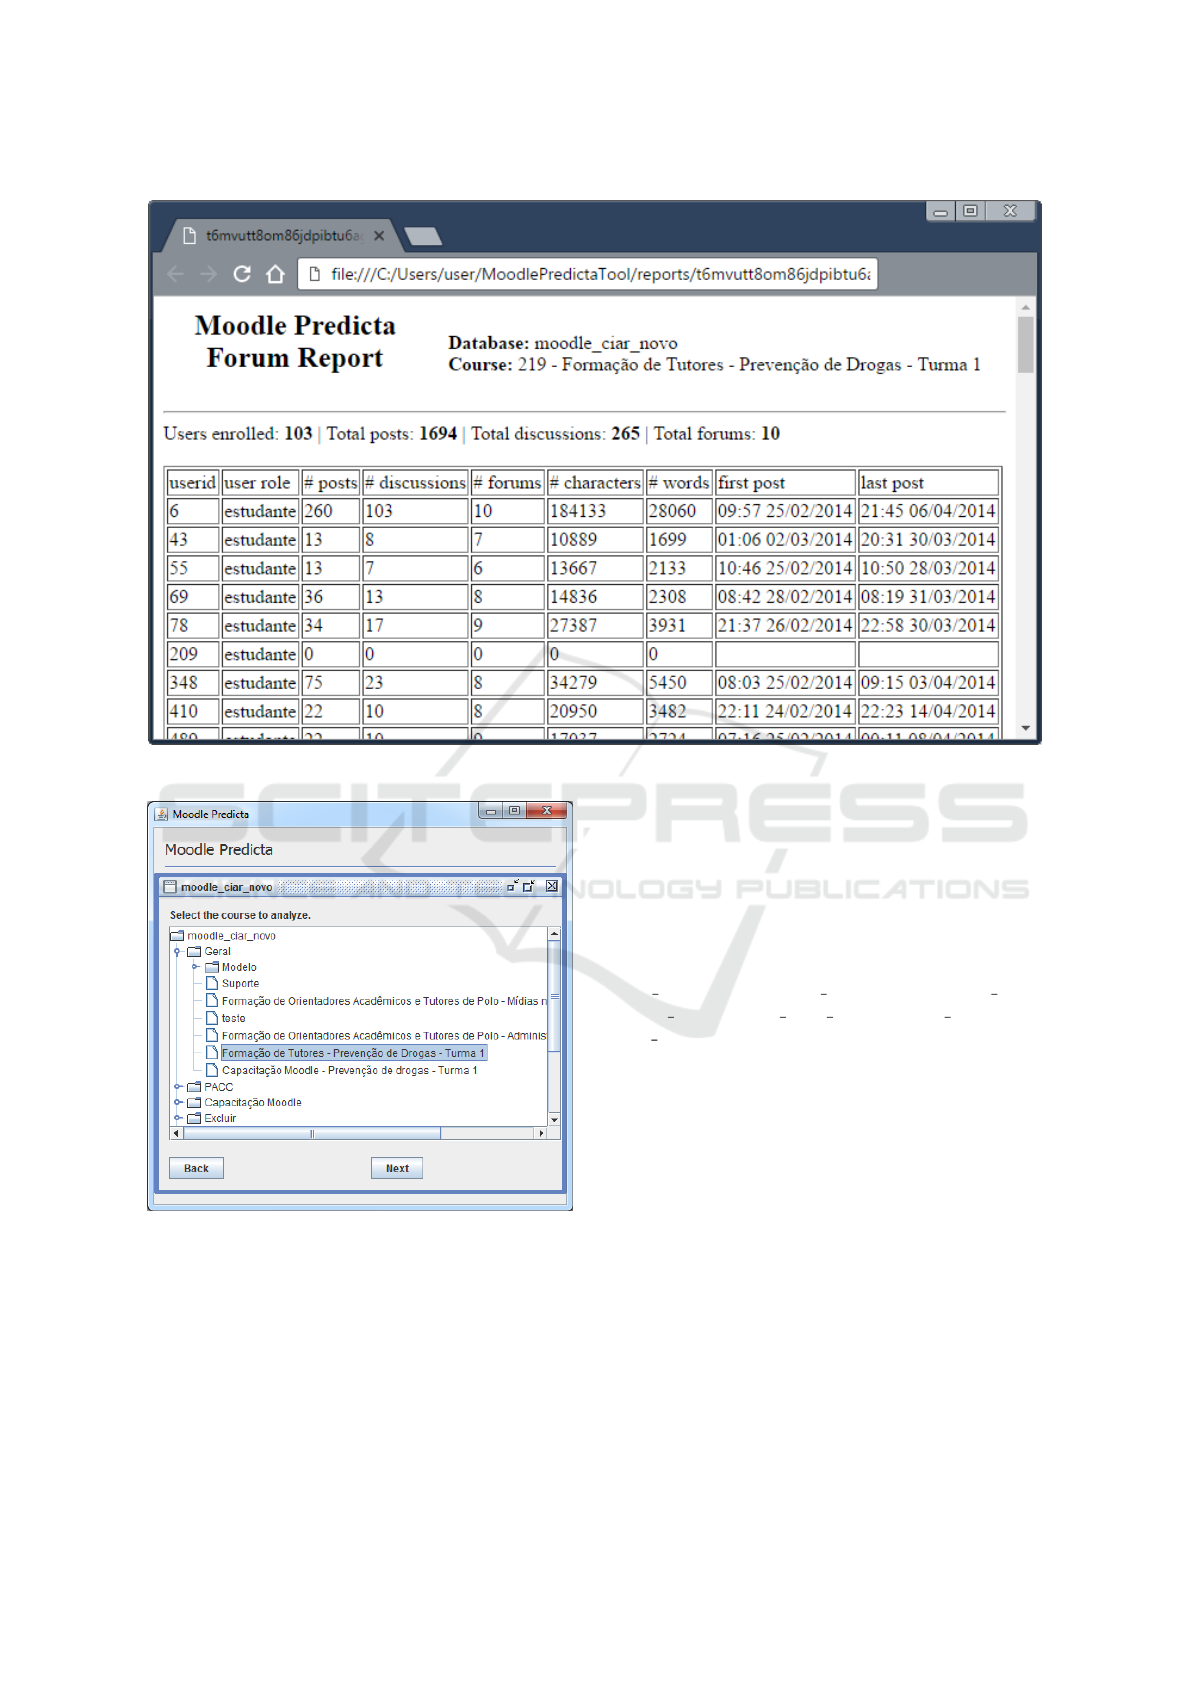
Figure 2: Forum data analysis report, in HTML format.
Figure 3: Selection of Moodle course.
ii CSV (Comma Separated Values) – this format is
indicated for data import and export, such as spre-
adsheets and databases.
iii ARFF (Attribute-Relation File Format) – this for-
mat is used by WEKA and KEEL, two widely
used open source data mining software.
The data is gathered by means of several SQL
(Structured Query Language) commands, crossing
different tables, joining scattered information, accor-
ding to the type of report and data to be analyzed.
Then, it is processed and presented in the selected for-
mat.
For example, when the data to be analyzed are
course’s forum, eleven different tables are inclu-
ded in the data collection: course, user, forum,
user enrolments, forum discussions, forum posts,
forum read, forum track prefs, forum queue, fo-
rum subscriptions, and role.
Joining all these tables and gathering their data,
it’s possible with the application of data mining pre-
processing techniques (cleaning, integration, transfor-
mation and reduction), to have a report that can be
understandable by non-expert data mining users, as
shown in Figure 2.
4.2 Prediction Module
The prediction module allows teachers and tutors to
identify students that are not following classes and
may abandon the course before the end, making it
possible to take some preventive action, and bring the
student back into the course. Prediction is based on
behavior, interactions, and performance of students
inside the Moodle environment.
To undertake the students’ prediction perfor-
Moodle Predicta: A Data Mining Tool for Student Follow Up
343
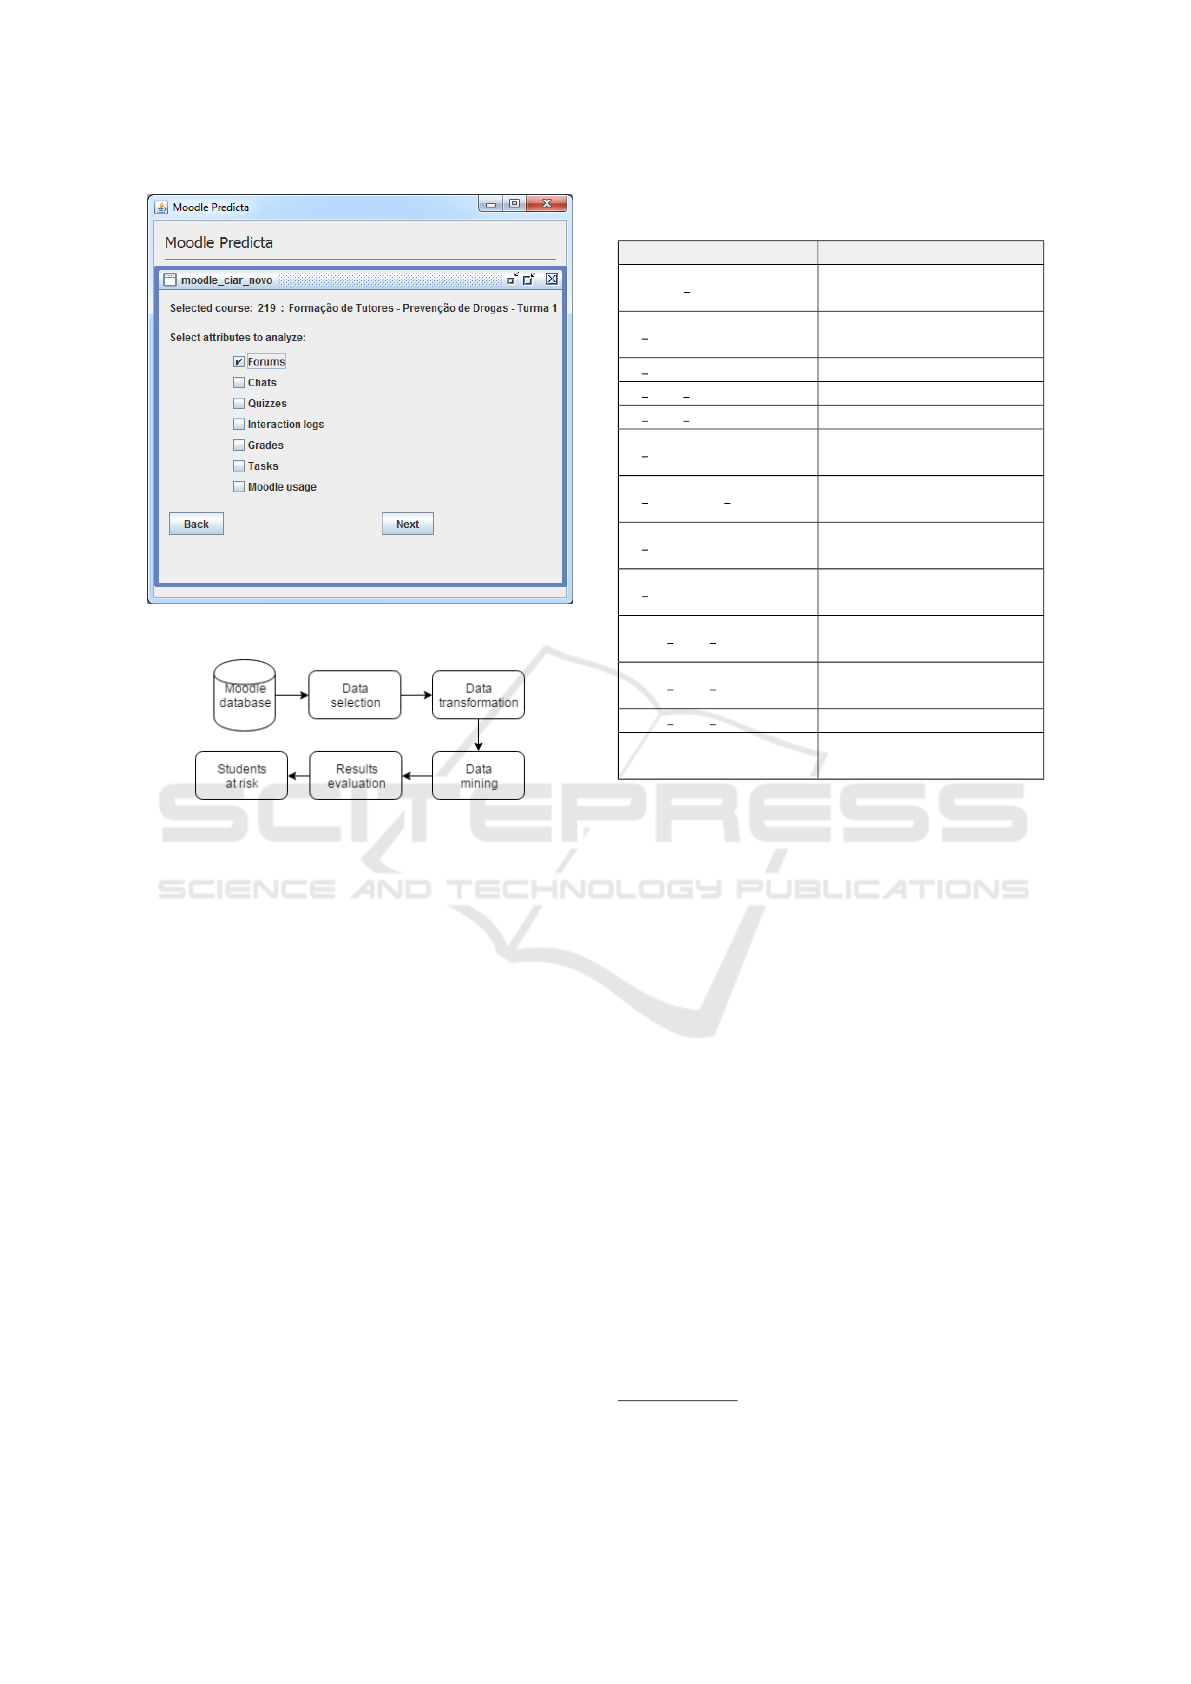
Figure 4: Selection of attributes for analysis.
Figure 5: Diagram of prediction module.
mance, the module is composed by five main steps,
involving data preprocessing, data mining techniques
and formatting (Figure 5):
i Data selection – in this step, the data is selected,
from attributes data describe students’ behavior,
interactions and grades.
ii Data transformation – the data is gathered and
transformed/discretized for data mining.
iii Data mining – in this stage, the data is used in
decision tree models.
iv Results evaluation – the results presented by data
mining are interpreted and evaluated automati-
cally.
v Students at risk – Students at risk are listed to user.
As proposed by (Romero et al., 2008b), and follo-
wed by other researches, as (Chayanukro et al., 2014),
the relevant attributes from students’ behavior for data
mining in Moodle and used by Moodle Predicta, are
presented in Table 2.
Once the course is selected, as seen in Figure 3,
Moodle Predicta prepares the data, in a preproces-
sing phase (cleaning, integration, transformation and
reduction), and generates an ARFF file. After con-
necting to the WEKA data mining API, the decision
Table 2: Predictors attributes used in Moodle Predicta.
Adapted from (Romero et al., 2008b).
Name Description
course id
Identification of
the course
n assignment
# of assignments
submitted
n quiz # of quizzes solved
n quiz a # of quizzes passed
n quiz s # of quizzes failed
n messages
# of messages
sent by chat
n messages ap
# of messages
sent to the teacher
n posts
# of messages
sent to the forum
n read
# of messages
read on the forum
total time assignment
Total time spent
in assignment
total time quiz
Total time spent
on quizzes
total time forum Total time used on forum
mark
Final mark obtained
by student in the course
tree algorithms are executed with standard parameters
for listing of students at risk of failing, presented in
Figure 6.
The WEKA (Waikato Environment for Know-
ledge Analysis) allows researchers access to updated
techniques in machine learning, being recognized as a
landmark system in data mining. With an widespread
acceptance so in academia and business contexts, has
becoming a widely tool for data mining research (Hall
et al., 2009).
Integration with WEKA is done through the API
library. The decision tree algorithms can be called
through specific classes and methods available in the
“weka.classifiers.trees” package
1
.
Prediction requires that models be built based on
prior data. This means that each context will have to
build and test their models before prediction is pos-
sible. The decision tree models we used were gene-
rated using training data from biology undergraduate
students from an online course, using predictors attri-
butes presented in Table 2.
The list of students at risk (Figure 6) is defined
by the algorithm using the model generated by the
training data. Students whose behavior, interactions,
and performance, is similar to those students from the
1
Available at http://weka.sourceforge.net/doc.stable/
Accessed in 12/06/2016.
CSEDU 2017 - 9th International Conference on Computer Supported Education
344
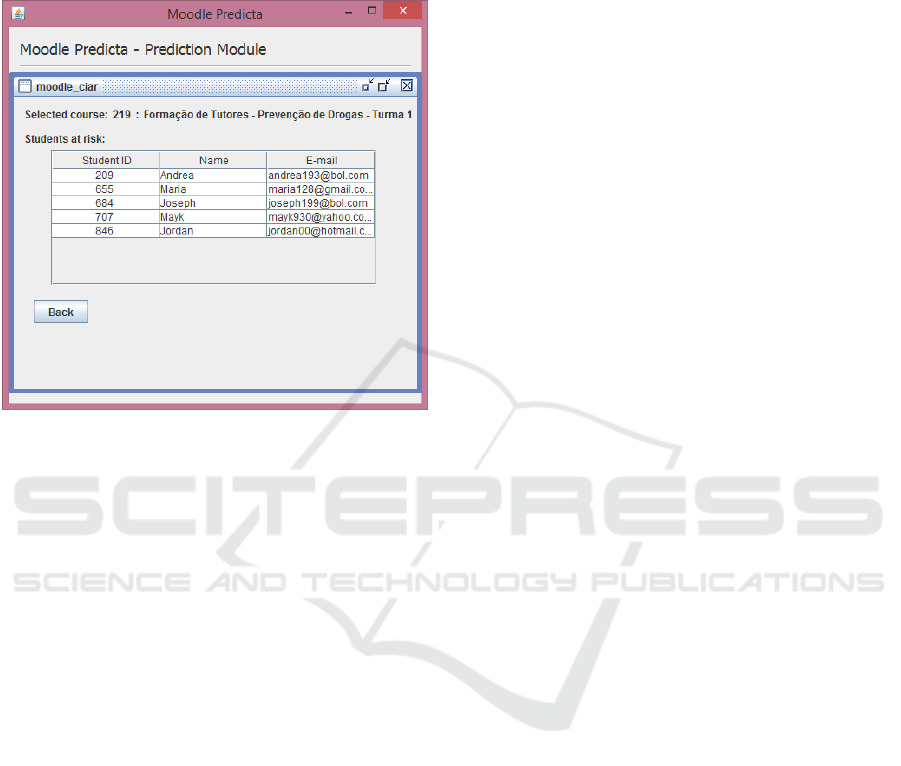
training dataset that have failed will be difined as “at
risk”. Teachers can then follow up on these students
to confirm their situation and take some preventive
measure to bring back the student to the course.
Figure 6: Students at risk (Fictitious personal data for pri-
vacy reasons).
5 CONCLUSION AND FUTURE
WORK
With the advances of information and communica-
tion technologies, new and major challenges are being
created, mainly because of the large amounts of data
about students’ activities, academic results and users’
interactions being stored. However, this data has can
be explored and analyzed by known data mining met-
hods and techniques. These two facts are the basis of
the recent area of research, educational data mining,
that consists of application of data mining technolo-
gies to data collected from educational contexts, with
the aim of discover patterns and useful information.
The data mining processes are difficult and need
previous knowledge to be applied successfully. Mo-
reover, the data needs to be correctly selected, prepa-
red and the result of process requires evaluation and
interpretation. These are barriers that must be over-
come so a greater number of users can benefit from
educational data mining.
In this paper, Moodle Predicta, an easy-to-use tool
was presented. This software enables students follow
up, selecting and preparing the Moodle data for two
modules: (i) the visualization module, that generates
reports for analysis purposes; and (ii) the prediction
module, that integrated to WEKA data mining soft-
ware, uses decision tree models to identify and list
students at risk of dropout or failure.
The tool is implemented in Java, connecting to da-
tabases by means of JDBC API. The data collection is
implemented in SQL queries, taking benefit from the
commands offered by database management systems.
While the data processing is done inside the tool.
Future work will be undertaken in the direction of
using the resulting datasets from the visualization mo-
dule to build effective models their validation. More-
over, other Moodle tables can be joined in the same
reports for more complex analysis.
REFERENCES
ABED – Associac¸
˜
ao Brasileira de Educac¸
˜
ao a Dist
ˆ
ancia
(2015). Censo EAD.BR: Relat
´
orio Anal
´
ıtico da
Aprendizagem a Dist
ˆ
ancia no Brasil 2014. Accessado
em 27/07/2016.
Agudo-Peregrina,
´
A. F., Hern
´
andez-Garc
´
ıa,
´
A., and
Iglesias-Pradas, S. (2012). Predicting academic per-
formance with learning analytics in virtual learning
environments: A comparative study of three inte-
raction classifications. In 2012 International Sympo-
sium on Computers in Education (SIIE), pages 1–6.
Allen, I. E. and Seaman, J. (2014). Grade change. Tracking
Online Education in the United States. Babson Survey
Research Group and Quahog Research Group, LLC.
Avlija
ˇ
s, G., H.-M. A. R. (2016). A guide for association rule
mining in moodle course management system. Sinteza
2016 - International Scientific Conference on ICT and
E-Business Related Research, pages 56–61.
Baker, R. S. and Yacef, K. (2009). The state of educatio-
nal data mining in 2009: A review and future visions.
JEDM-Journal of Educational Data Mining, 1(1):3–
17.
Bapu, G. K., Deshmukh, M. P. R., Ashok, M. B., Shamrao,
S. P., and Tanaji, S. G. (2015). Clustering moodle data
as a tool for profiling students. International Jour-
nal of Advanced Research in Computer Engineering
& Technology (IJARCET), 4.
Bogar
´
ın, A., Romero, C., Cerezo, R., and S
´
anchez-
Santill
´
an, M. (2014). Clustering for improving edu-
cational process mining. In Proceedings of the Fourth
International Conference on Learning Analytics And
Knowledge, LAK ’14, pages 11–15, New York, NY,
USA. ACM.
Chayanukro, S., Mahmuddin, M., and Husni, H. (2014). A
generalized e-learning usage behaviour model by data
mining technique. Journal of Information and Com-
munication Technology, 13(1):37–53. cited By 0.
Danubianu, M. (2015). A data preprocessing framework for
students’ outcome prediction by data mining techni-
ques. In System Theory, Control and Computing
(ICSTCC), 2015 19th International Conference on,
pages 836–841.
Moodle Predicta: A Data Mining Tool for Student Follow Up
345

e Ricardo Araujo e Douglas Detoni, C. C. (2015). Mo-
delagem e predic¸
˜
ao de reprovac¸
˜
ao de acad
ˆ
emicos de
cursos de educac¸
˜
ao a dist
ˆ
ancia a partir da contagem
de interac¸
˜
oes. Revista Brasileira de Inform
´
atica na
Educac¸
˜
ao, 23(03):1.
EDUCAUSE Center for Analysis and Research (2014). The
Current Ecosystem of Learning Management Systems
in Higher Education: Student, Faculty, and IT Per-
spectives. Accessado em 27/07/2016.
Garc
´
ıa-Saiz, D. and Zorrilla, M. (2012). A promising classi-
fication method for predicting distance students’ per-
formance. In Educational Data Mining 2012.
Gu
´
ercio, H., P., M., V., S., P., K., and E., B. (2014). An
´
alise
do desempenho estudantil na educac¸
˜
ao a dist
ˆ
ancia ap-
licando t
´
ecnicas de minerac¸
˜
ao de dados. Workshop de
Minerac¸
˜
ao de Dados em Ambientes Virtuais do En-
sino e Aprendizagem, 3.
Hall, M., Frank, E., Holmes, G., Pfahringer, B., Reute-
mann, P., and Witten, I. H. (2009). The weka data
mining software: An update. SIGKDD Explor. Newsl.,
11(1):10–18.
Jindal, R. and Borah, M. D. (2013). A survey on educa-
tional data mining and research trends. International
Journal of Database Management Systems, 5(3):53.
Kotsiantis, S., Patriarcheas, K., and Xenos, M. (2010).
A combinational incremental ensemble of classifiers
as a technique for predicting students’ performance
in distance education. Knowledge-Based Systems,
23(6):529 – 535.
Luan, J. (2002). Data mining and its applications in higher
education. New Directions for Institutional Research,
2002(113):17–36.
Marquez-Vera, C., Morales, C. R., and Soto, S. V. (2013).
Predicting school failure and dropout by using data
mining techniques. IEEE Revista Iberoamericana de
Tecnologias del Aprendizaje, 8(1):7–14.
Moodle.org (2016a). Moodle Philosophy.
https://docs.moodle.org/24/en/Philosophy. Accessed:
2016-10-05.
Moodle.org (2016b). Moodle Statistics.
https://moodle.net/stats/. Accessed: 2016-10-05.
Moore, M. G. (1989). Editorial: Three types of interaction.
American Journal of Distance Education, 3(2):1–7.
Moradi, H., Moradi, S. A., and Kashani, L. (2014). Stu-
dents’ Performance Prediction Using Multi-Channel
Decision Fusion, pages 151–174. Springer Internati-
onal Publishing, Cham.
Neto, F. A. A. and Castro, A. (2015). Elicited and mined
rules for dropout prevention in online courses. In 2015
IEEE Frontiers in Education Conference (FIE), pages
1–7.
Olama, M. M., Thakur, G., McNair, A. W., and Sukumar,
S. R. (2014). Predicting student success using ana-
lytics in course learning management systems. Proc.
SPIE, 9122:91220M–91220M–9.
Pe
˜
na-Ayala, A. (2014). Educational data mining: A survey
and a data mining-based analysis of recent works. Ex-
pert Systems with Applications, 41(4, Part 1):1432 –
1462.
Pierrakeas, C., Xeno, M., Panagiotakopoulos, C., and Ver-
gidis, D. (2004). A comparative study of dropout rates
and causes for two different distance education cour-
ses. The International Review of Research in Open
and Distributed Learning, 5(2).
Romero, C., L
´
opez, M.-I., Luna, J.-M., and Ventura, S.
(2013). Predicting students’ final performance from
participation in on-line discussion forums. Computers
& Education, 68:458 – 472.
Romero, C. and Ventura, S. (2007). Educational data mi-
ning: A survey from 1995 to 2005. Expert Systems
with Applications, 33(1):135 – 146.
Romero, C. and Ventura, S. (2010). Educational data mi-
ning: A review of the state of the art. IEEE Tran-
sactions on Systems, Man, and Cybernetics, Part C
(Applications and Reviews), 40(6):601–618.
Romero, C., Ventura, S., Espejo, P. G., and Herv
´
as, C.
(2008a). Data mining algorithms to classify students.
In Educational Data Mining 2008.
Romero, C., Ventura, S., and Garc
´
ıa, E. (2008b). Data
mining in course management systems: Moodle case
study and tutorial. Computers & Education, 51(1):368
– 384.
Sharma, M. and Mavani, M. (2011). Accuracy comparison
of predictive algorithms of data mining: Application
in education sector. Communications in Computer and
Information Science, 125 CCIS:189–194. cited By 0.
Sisovic, S., Matetic, M., and Bakaric, M. B. (2016). Cluste-
ring of imbalanced moodle data for early alert of stu-
dent failure. In 2016 IEEE 14th International Sympo-
sium on Applied Machine Intelligence and Informatics
(SAMI), pages 165–170.
Sorour, S. E., Goda, K., and Mine, T. (2015). Estimation of
student performance by considering consecutive les-
sons. In 2015 IIAI 4th International Congress on Ad-
vanced Applied Informatics, pages 121–126.
Thakar, P. (2015). Performance analysis and prediction
in educational data mining: A research travelogue.
CoRR, abs/1509.05176.
Yoshida, T., Kou, G., Skowron, A., Cao, J., Hacid, H., and
Zhong, N. (2013). Detection and Presentation of Fai-
lure of Learning from Quiz Responses in Course Ma-
nagement Systems, pages 64–73. Springer Internatio-
nal Publishing, Cham.
Zacharis, N. Z. (2015). A multivariate approach to pre-
dicting student outcomes in web-enabled blended le-
arning courses. The Internet and Higher Education,
27:44 – 53.
Zorrilla, M. and Garcia-Saiz, D. (2014). Meta-learning:
Can it be suitable to automatise the kdd process for
the educational domain? Lecture Notes in Computer
Science (including subseries Lecture Notes in Artifi-
cial Intelligence and Lecture Notes in Bioinformatics),
8537 LNAI:285–292. cited By 0.
CSEDU 2017 - 9th International Conference on Computer Supported Education
346
