
Entropy-based Framework Dealing with Error in Software
Development Effort Estimation
Salma El Koutbi and Ali Idri
Software Projects Management Research Team, ENSIAS, University Mohammed V, Rabat, Morocco
Keywords: Error Software Effort Estimation, Entropy, Fuzzy C-Means Algorithm, Fuzzy Analogy.
Abstract: Software engineering community often investigates the error concerning software development effort
estimation as a part, and sometimes, as an improvement of an effort estimation technique. The aim of this
paper is to propose an approach dealing with both model and attributes measurement error sources whatever
the effort estimation technique used. To do that, we explore the concepts of entropy and fuzzy clustering to
propose a new framework to cope with both error sources. The proposed framework has been evaluated
with the COCOMO’81 dataset and the Fuzzy Analogy effort estimation technique. The results are
promising since the actual confidence interval percentages are closer to those proposed by the framework.
1 INTRODUCTION
Efficient and effective control of software
development investment is crucial through the
software development lifecycle. Indeed, the effort
estimation activity is important and crucial for a
successful and financially profitable delivery
(Kirsopp, 2002) (MacDonell, 1997). Over the last
decades, Software Development Effort Estimation
(SDEE) has gained increasing attention. As a
consequence, many techniques and models have
been proposed in order to provide project managers
with accurate effort estimates (Jorgensen, 2007).
Unfortunately, the proposed techniques are not
always accurate and the software industry is still
plagued with unreliable estimates. In this context,
error control helps improving projects running
performances by capturing uncertainty and accessing
it more efficiently. Organizations can then better
design adapted financial risk buffers, to ensure a
controlled project running and a successful delivery.
As error and uncertainty sources are various,
error assessment becomes a challenging and
complex task. According to (Kitchenham, 1997),
there are four different sources of error estimates:
(1) attributes measurement error; (2) model error, (3)
assumption error; and (4) scope error. Therefore,
error seems inherent to the effort estimation process.
Based on a systematic mapping study in which 19
selected articles have been analyzed and discussed
(El-Koutbi, 2016), two main approaches when
dealing with effort estimation error have been
identified. While the first category (58% of the
selected studies) proposes to handle error concerning
a specific effort estimation technique, the second
category of approaches (42% of the selected studies)
explores new designs, frameworks or methods
dealing with error components themselves and
handles error for any SDEE technique. In fact,
effort estimation techniques are multiple and
diverse, many studies have compared the
performance of various SDEE techniques and no
clear conclusions were drawn (Idri, 2015). In this
context, it is valuable to develop an error evaluation
approach independently of the effort estimation
technique. The objective is to generate an effort
probability distribution rather than one effort
estimate.
This paper proposes such error approach and
considers two error sources of (Kitchenham, 1997)
to enable estimates adjustment and risk control more
efficiently. To the best of our knowledge, the
concept of entropy has not been investigated in order
to deal with error in SDEE. However,
(Papatheocharous, 2009) used this concept in order
to propose a novel SDEE approach that attempts to
cluster empirical project data samples via an
entropy-based fuzzy k-modes clustering algorithm.
This study proposes an entropy-based approach
dealing with the two sources of uncertainty:
attributes measurement and model errors, for any
Koutbi, S. and Idri, A.
Entropy-based Framework Dealing with Error in Software Development Effort Estimation.
DOI: 10.5220/0006312901950202
In Proceedings of the 12th International Conference on Evaluation of Novel Approaches to Software Engineering (ENASE 2017), pages 195-202
ISBN: 978-989-758-250-9
Copyright © 2017 by SCITEPRESS – Science and Technology Publications, Lda. All rights reserved
195

SDEE technique. This approach consists of two
main steps. First, entropy is computed, over a
historical set of projects, based on the Fuzzy C-
Means (FCM). Over the same historical set, effort
deviation is calculated in order to generate a
relationship function between entropy and effort
deviation. At a second stage, to generate an effort
distribution for a new project, we compute the
corresponding entropy. The new project deviation is
then induced using the relationship inferred over the
historical set. The estimated deviation is finally used
to set up the Gaussian effort distribution parameters.
The proposed approach is evaluated over the
COCOMO’81 dataset under Fuzzy Analogy as an
estimation technique (Idri, 2002), (Amazal, 2014)
and using JackKnife as an evaluation method.
The paper is organized as follows. Section 2
provides insights into the concepts of entropy and
FCM. Section 3 presents the modeling of the
attributes and model error. Section 4 describes the
proposed framework steps. Section 5 focuses on the
experiment design. Section 6 evaluates the proposed
framework on the COCOMO’81 dataset and
discusses the results. Finally, Section 7 presents
conclusions and outlines perspectives and future
work.
2 BACKGROUND
2.1 Shannon Entropy
The concept of entropy of information was first
introduced by Shannon in 1948 (Shannon, 1948). By
defining a mathematical function describing the
statistical nature of information lost over a
transmission line, Shannon sets up a fundamental
base of Information Theory (Gray, 1990). As
entropy is a measure of unpredictability
of information content, it is a key idea for
describing random variables, processes and dynamic
systems (Borda, 2011). For a discrete random
variable X and probability mass
function P(X), Shannon proposed the formal
definition of the entropy Η given in Eq.1.
H
(
X
)
=E
I
(
X
)
(1)
where E is the expected value operator, and I is
the information content of X.
As I(X) is itself a random variable, the entropy can
explicitly be written as given in Eq.2.
H
(
X
)
=−P
(
x
)
logP(x
)
(2)
The Eq.2 can be generalized in the case of a
continuous distribution as given in Eq.3.
H
(
X
)
=−P
(
x
)
logP
(
x
)
dx
(3)
where P(x) represents a probability density function
.
In the case of n variables (X
1
,…, X
n
), entropy is
defined as follows (Han, 2002):
H
(
X
,..,X
)
=H
(
X
)
+H
(
X
|
X
)
+⋯
+H
(
X
|
X
,..X
)
(4)
where l
m
and l
n
are respectively X
i
and X
j
possible
values and H(X
│X
) is the conditional entropy.
It worth notice that for independent variables,
entropy has an additive property:
H
(
X
,..,X
)
=H
(
X
)
+⋯+H(X
)
(5)
2.2 Fuzzy Clustering
Fuzzy logic was introduced by Zadeh in 1965 with
his proposal of fuzzy set theory (Zadeh, 1965).
Since, the fuzzy logic has been applied to many
fields such as clustering and classification. Fuzzy
clustering is a well-known clustering strategy that
used the concept of fuzziness. Based on membership
functions, it proposes an alternative approach of the
hard clustering. As a result, a data point belongs to a
cluster with a membership value between 0 and 1.
Therefore, a data point could belong to different
clusters with different membership values.
In SDEE, fuzzy clustering was investigated in
order to deal with uncertainty of attributes.
Especially: (Liao, 2003) generates convex fuzzy
terms with a variant of the original Fuzzy C-Means
(FCM) Algorithm; and (Idri, 2006) combines FCM
with a Real Coded Genetic Algorithm (RCGA) in
order to generate membership functions from
numerical software project attributes.
This study uses the FCM algorithm which is the
fuzzy version of the hard C-means algorithm that
aims to group elements into clusters so that items in
the same cluster are as similar as possible (Bezdek,
1981). FCM generates cluster centers (centroids)
that minimize the function of Eq.6.
MinJ
(
U,C
)
=u
x
−c
(6)
Subject to:
=1,∀
∈
1,
(7)
where (x
1
,..., x
n
) are points of a data set; c is the
desired number of clusters; m is the control
parameter of fuzziness; U = (u
ij
) is the partition
matrix, containing the membership values of all data
in all clusters; and C = (c
i
) is the set of cluster
centers.
Updating iteratively the cluster centers and the
ENASE 2017 - 12th International Conference on Evaluation of Novel Approaches to Software Engineering
196

membership values improves the cluster centers
location by minimizing the objective function of
Eq.6. The number of clusters might be determined
based on the Xie-Beni validity criterion (Xie, 1991).
A brief description of the FCM algorithm is shown
in Fig.1.
S
tep 0. Randomly initialize the membershi
p
matrix (U) respecting Eq.6.
Step 1. Calculate centroids using the formula:
=
Step 2. Compute dissimilarity between centroids
and data points using Eq.7.
Stop if improvement over previous iteration is
below a threshold.
Step 3. Compute a new U using the formula :
=1
−
‖
−
‖
/()
Go to Step 1.
Figure 1: Fuzzy C-Means algorithm.
3 ATTRIBUTES MEASUREMENT
AND MODEL ERROR IN SDEE
SDEE aims to provide accurate effort estimates
based on project attributes description. To achieve
this objective, the use of a historical projects dataset
with known attributes and actual effort values is
needed. Fig. 2 shows the classical SDEE dataset
form, where E
acti
is the actual effort of a project P
i
,
X
j
s are the attributes describing the projects P
is
, x
ij
are their values, n and k are the number of projects
and attributes respectively. Based on entropy and
FCM concepts, presented in Section 2, we describe
in this section the two approaches to deal with both
attributes measurement and model errors in SDEE.
Actual effort X
1
X
2
… X
k
Project 1 E
act1
x
11
x
12
… x
1k
Project 2 E
act2
x
21
x
22
… x
2k
… … … … … …
Project n E
actn
x
n1
x
n2
… x
nk
New project Unknown x
N1
x
N2
… x
Nk
Figure 2: Software projects dataset form.
3.1 Attributes Measurement Error
Attributes measurement error is caused by accuracy
limitations of input variables. It concerns especially
uncertainty associated to attributes X
j
s (Kitchenham,
1997). As uncertainty is caused by attribute biases, it
seems plausible to consider that it depends of
attribute information rather than the attribute values.
In this context, a mathematical function quantifying
information uncertainty can help managing attributes
measurement error in SDEE. This study proposes to
use the well-known Shannon entropy, presented in
Section 2.1, as a measure of attribute uncertainty.
Since attribute values present an inherent
imprecision, especially categorical data
(Kitchenham, 1997), we use the continuous version
of Shannon entropy (Eq.3). This enables us to take
into account neighbor values while calculating
attributes entropy. The following formalization is an
adaptation of the entropy equation (Eq.3 and Eq.5)
to the SDEE context.
Based on Eq.3, we define the entropy of an attribute
X
j
of a project P
i
, as follows:
H
=−
f
(
x
)
log
f
(
x
)
dx
(8)
where x
ij
are the values of the attribute X
j
of a
project P
i
, r
mj
is an average neighborhood distance
and f
j
s
are
the membership functions generated by
the FCM algorithm for the attribute X
j
.
For a project P
i
, the entropy value H
i
is calculated by
means of Eq.9.
H
=H
=− f
(
x
)
logf
(
x
)
dx
(9)
where k is the number of attributes. For the other
parameters description, refer to Eq.8.
3.2 Model Error
Model error occurs because all empirical SDEE
models are abstractions of reality. Factors that affect
effort but are not included explicitly in the model
contribute to the model error. Model error concerns
then the inherent limitation of the theoretical abstract
approach of effort estimation. Since model error is
related to effort estimation, absolute error is used to
measure the estimates deviation from the actual
effort. Hence, we define for each project P
i
a
deviation ∆
as follows:
∆
=E
−E
(10)
where E
and E
are respectively the actual and
estimated efforts of project P
i
.
Entropy-based Framework Dealing with Error in Software Development Effort Estimation
197

3.3 SDEE Error Formulation
As shown in Fig. 2, the SDEE formulation is
characterized by k+1 elements, where k corresponds
to the number of attributes used to describe projects.
By means of entropy and effort deviation,
respectively described by Eq.9 and Eq.10, it is
possible to reduce the SDEE problem dimension of
Fig. 2 to deal with both attributes measurement and
model error. Fig. 3 illustrates the proposed
transformed dataset form in order to handle both
measurement and model errors. In comparison with
the dataset form of Fig. 3, we note that the k project
attributes are replaced by a single variable that is
their entropy. This dimensional reduction of the
number of variables is due to the fact that attribute
measurements error is an uncertainty concern and
then depends of information uncertainty (measured
here with entropy) rather than attributes values
them-selves (Kitchenham, 1997).
Deviation Entropy
Project 1 ∆
eff1
H
1
Project 2 ∆
eff2
H
2
… … …
Project n ∆
effn
H
n
New project Unknown H
N
Figure 3: Software projects dataset form to deal with
attribute measurement and model errors.
In the rest of this paper, a project P
i
is described by
its entropy H
i
and its deviation ∆
effi
.
4 ENTROPY-BASED APPROACH
FOR ERROR IN SDEE
This paper proposes a novel entropy-based
framework in order to deal with both attributes
measurement and model error whatever the effort
estimation technique used. Based on entropy and
effort deviation, the proposed approach consists of
two main steps. In the following subsections, Steps
1 and 2 are detailed.
4.1 Step 1: Constructing Relationship
of Entropy and Effort Deviation
The objective of this step is to use the learning set
projects in order to generate the function g that
associates entropy and effort deviation. This
function is then used to estimate effort deviation of a
new project knowing its entropy. The function g
construction process is as follow:
(1) Attributes fuzzy clustering consists of applying
the FCM Algorithm to generate fuzzy clusters of
each attribute X
j
. The Xie-Beni validity criterion is
used to decide on the optimal number of these
clusters (Xie, 1991). Thereafter, the membership
functions f
j
s were constructed for each attribute X
j
by means of a Real Coded Genetic Algorithm
(RCGA) (Idri, 2006).
(2) Projects entropy H
i
of each project P
i
is
computed based on f
j
and
r
mj,
of all attributes X
j
(Eq.9).
(3) In order to generate the effort deviation values,
we apply an effort estimation technique on each
project P
i
to obtain its effort estimate
.
Thereafter, we
calculate the P
i
effort deviation ∆
effi
by means of
Eq.10.
(4) We infer the function g modelling the entropy H
i
and the deviation ∆
effi
4.2 Step 2: Generating Error
Distribution
This step aims to generate an estimation error
distribution for a new project P
N
. To achieve this
objective, we use entropy and effort deviation
computed in Step 1 as well as the in function g.
As function g represents a relationship between
entropy and effort deviation, we first compute the
new project entropy H
N
by means of Eq.9. Then, we
interpolate the effort deviation ∆
effN
of P
N
using
function g. Based on the interpolated deviation a
Gaussian error distribution is generated.
The choice of a Gaussian error distribution was
motivated by the fact that: (1) Gaussian function is
the result of Gamma function convergence which
has been suggested by (Kitchenham, 1997); and (2)
Gaussian function is often used to model waiting or
service times in queuing theory and it makes sense
in SDEE context since estimating a project effort
concerns the required time for software development
tasks.
The classical Gaussian formula is given by Eq.11
(Bromiley, 2003).
(
x
)
=
1
σ
√
2π
e
(
)
(11)
where is the distribution expectation and its
standard deviation.
Finally and in order to set up the parameters μ
and σ to determine the error distribution of P
N
, we
consider that:
(1) μ= E
estN
: this implies that the effort
distribution is centered around the estimated effort
of P
N
, E
estN,
and there is neither overestimation nor
underestimation preference.
(2) ∆
effN
≅ σ: this means for example that the
actual deviation which corresponds to absolute
ENASE 2017 - 12th International Conference on Evaluation of Novel Approaches to Software Engineering
198
difference with E
estN
is at 68.3% (Bromiley, 2003) in
the interval of ±∆
effN
that corresponds to ±.
The Gaussian error distribution used is then:
f
(
x
)
=
1
∆
√
2π
e
(
)
∆
(12)
5 EXPERIMENT DESIGN
5.1 Dataset Description
This study uses the COCOMO’81 historical dataset
available in the PRedictOr Models In Software
Engineering (PROMISE) data repository (Menzies,
2012). The original COCOMO’81 contains 63
projects. The version used in this study consists of
252 projects described by 13 attributes (refer to (Idri,
2016) for details). It’s worth precise that
COCOMO’81effort drivers are measured using a
rating scale of six linguistic values (very low, low,
nominal, high, very high and extra-high). In this
experiment, for each couple of project and linguistic
value, four numerical values have been randomly
generated according to the classical interval used to
represent the linguistic value.
5.2 Projects Entropy Computation
For each attribute Xj, we used the FCM Algorithm
to determine the number of clusters which has been
varied between 2 and 7. The Xi-Benni criterion has
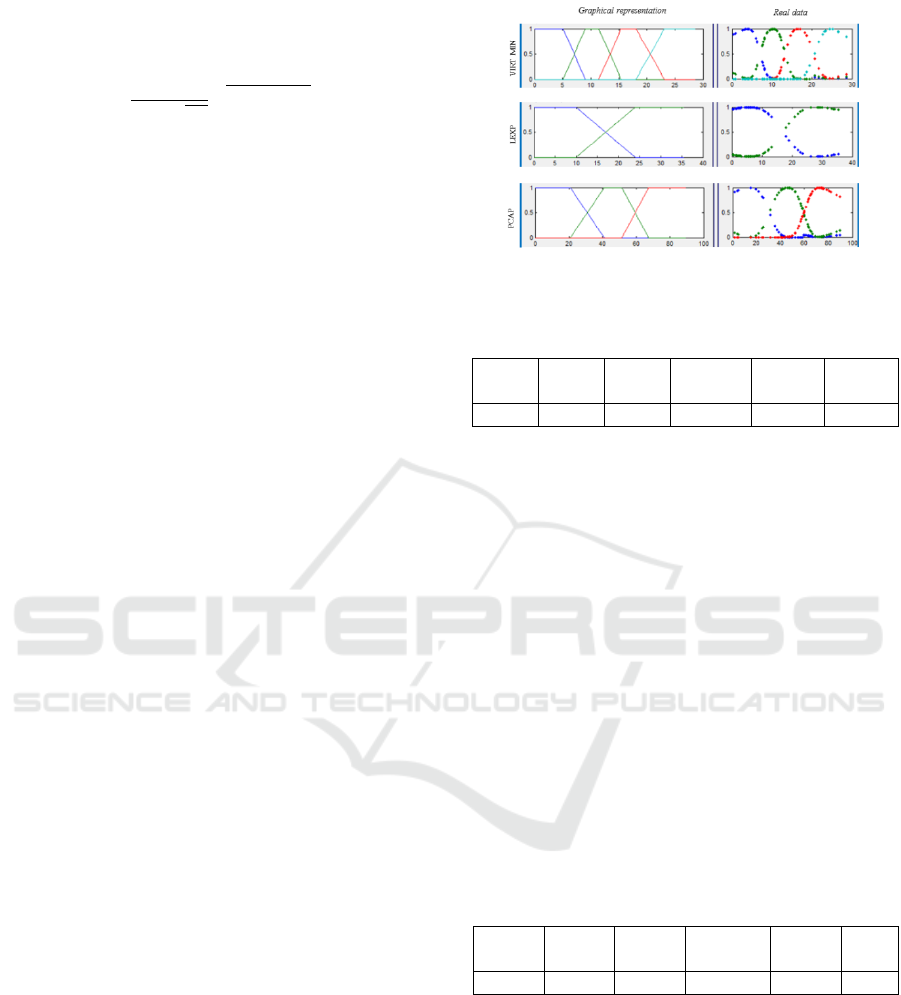
been used to choose the best clustering. Fig. 4
reports the trapezoidal membership functions
defined for three attributes of the COCOMO’81
dataset: PCAP, LEXP and VIRTMIN. In addition to
that and in order to take into account neighbour
values while calculating entropy, we compute the
mean radium rm, defined in Eq.8. In this
experimentation, for attribute X
j
, r
mj
is defined as
2×Min
,∈
,
x
−x
where n is the number of
projects, rm corresponds to two times the minimal
distance between values of attribute X
j
in order to
take into account superior and inferior neighbours.
For each attribute, the selected clusters number
corresponds to the integer minimizing the Xi-Benni
criterion. Based on attribute membership functions
and radii, we compute entropy of each project based
on Eq.9. Table 1 summarizes the descriptive
statistics of entropy distribution over the
COCOMO’81 dataset. We can notice a wide
dispersion of entropy values. Median entropy is
relatively low around 2.25 in comparison with mean
and maximal entropy: 7631.73 and 175997.79
respectively.
Figure 4: Membership functions for VIRTMIN, LEXP
and PCAP attributes.
Table 1: COCOMO’81descriptive statistics of entropy.
Mean
Entropy
Median
Entropy
Minimal
Entropy
Maximal
Entropy
Skewness Kurtosis
7631.73 2.24 0.10 175997.79 4.14 19.74
5.3 Effort Deviation Calculation
The proposed approach to deal with SDEE error is
adapted whatever the effort estimation technique
used. This study uses the Fuzzy Analogy (FA)
SDEE technique which has been developed by Idri
et al. (Idri, 2002). FA has been evaluated and proven
to outperform Classical Analogy in several studies
(Idri, 2016), (Idri, 2015), (Amazal 2014). Fuzzy
Analogy involves three steps: fuzzy identification of
cases, fuzzy retrieval of similar cases, and fuzzy
case adaptation (Idri, 2002). Each step is a
fuzzification of its equivalent in the Classical
Analogy procedure of Shepperd et al. (Shepperd,
1997). Based on the estimate and actual effort
values, effort deviations were computed by means of
Eq.10. Table 2 details COCOMO’81 effort deviation
descriptive statistics under FA.
Table 2: COCOMO’81 descriptive statistics of FA effort
deviation.
Mean
deviation
Median
deviation
Minimal
deviation
Maximal
deviation
Kurtosis
Skewn
ess
138.35 50.29 0 2434.38 36.46 5.09
5.4 JackKnife Evaluation Method
In order to overcome the bias due to the learning set
selection, we adopt the JackKnife evaluation
method. The JackKnife, or “leave one out"
(LOOCV), is a cross-validation technique
(Quenouille, 1956) in which the target project is
excluded from the dataset and estimated by the
remaining projects in the historical dataset. The
main reason behind using this method over n-folds
Entropy-based Framework Dealing with Error in Software Development Effort Estimation
199
cross-validation is that LOOCV generates lower bias
and it produces a higher variance estimate. Also,
LOOCV can generate the same results in a particular
dataset if the evaluation is replicated, which is not
the case for n-folds cross validation (Kocaguneli,
2013).
6 EMPIRICAL RESULTS
6.1 Construction and Evaluation of the
Function g
We computed the entropy and effort deviation data
over COCOMO’81 dataset (Sections 5.2 and 5.3) by
means of LOOCV evaluation method. Thereafter,
four interpolation techniques were applied to
determine the effort deviation of each project:
Linear, Cubic, Spline and Nearest. The distributions
of effort deviation are represented in Fig. 5. Taking
into account median values and outliers spreading,
Cubic, Linear and Nearest interpolations seems more
interesting approximators of actual deviations than
Spline method.
In order to analyze the interpolation technique
accuracy, we adopt the z-score metric as proposed
by Kitchenham et al. in their article about accuracy
statistics (Kitchenham, 2001). The variable z is
defined for a project P
i
as: z
=d
d
⁄
, where d
and
d
i
are the estimated and actual effort deviations of
project P
i
respectively. Fig. 6 represents z variable
boxplots of the distributions of the four interpolation
techniques. In addition to that, Table 3 gives
numerical statistics concerning the z variable
distributions. As can be seen in Fig. 6, the medians
of the z variable of Cubic and Linear interpolations
are closer to 1 (0.88 and 0.89 respectively) instead of
Nearest and Spline ones (0.58 and 2.43
respectively). We recall that a closer value of z to 1
indicates better estimation accuracy.
It can also be
noticed that the distributions of z variable for the
four interpolation techniques indicate a positive
skewness, since the medians are closer to the lower
quartile, in particular for Cubic, Linear and Nearest
methods (4.07; 5.82 and 4.10 respectively). In
addition, z values have high variations for Nearest
and Spline methods since the lower and upper
quartiles are far from one another. Therefore, their
boxes are taller than those of Cubic and Linear
interpolations. In addition, Cubic interpolation has a
bit low mean values than Nearest one (6.55 instead
of 6.61).Moreover, we use Mean Magnitude
Relative Error (MMRE) and Pred(25) of the four
interpolation techniques to measure the accuracy of
their estimated effort deviations since (Kitchenham,
2001) have demonstrated that MMRE and Pred(25)
are, respectively, measures of the spread and the
kurtosis of the variable z.
Figure 5: Boxplots of the four interpolation methods effort
deviation distribution.
MMRE corresponds to Mean Magnitude of
Relative Error where the Magnitude Relative Error
(MRE) is defined as |Actual deviation – Estimated
deviation|/Actual deviation. Pred(25) represents the
percentage of projects with an MRE that is less or
equal to 25%.
Figure 6: Boxplots of the four interpolation methods z
variables.
6.2 Error Distribution Evaluation
Based on (El-Koutbi, 2016), we notice a large
divergence of metrics used for SDEE error measue.
In fact, MRE was the most widely used one (47%),
followed by both Hit Rate and Confidence Intervals
(21%) and Pred (16%). Since this study is interested
in proposing an error probability distribution,
confidence intervals are the most adapted criterion,
in this context, to measure the performance of the
proposed error distribution.
ENASE 2017 - 12th International Conference on Evaluation of Novel Approaches to Software Engineering
200

Table 3: Descriptive statistics of Cubic, Linear, Nearest and Spline z variables.
Mean Median Min Max Skewness Kurtosis MMRE Pred(25)
Spline 343.60 2.43 0 39580.48 11.91 151.27 343.49 0.06
Cubic 6.55 0.88 0 104.30 4.07 17.80 6.30 0.08
Nearest 5.75 0.58 0 170.27 5.82 41.04 5.65 0.12
Linear 6.61 0.89 0 107.68 4.10 18.36 6.30 0.09
In fact, Stamelos and al. used a similar approach for
error management over a portfolio of projects
(Stamelos, 2001).
Based on Gaussian properties (Bromiley, 2003),
we define three confidence intervals:
Ii = [Eact-i.∆eff ,Eact +i.∆eff]
where ∈
1,2,3
, E
act
is project actual effort and
∆
eff
the estimated deviation. Table 4 shows, for each
interval, the achievement percentage that represents
the number of projects for which the actual effort
was within the considered confidence interval.
Table 4: Achievement percentages over I1, I2 and I3.
Achievement percentages
I1 I2 I3
Spline 65.25% 77.46% 83.57%
Cubic 46.95% 60.56% 66,67%
Nearest 40.37% 52.11% 57.74%
Linear 46.48% 61.50% 68.54%
To evaluate the performance of the proposed
Gaussian error distribution, entropy-based
framework actual achievement percentages were
compared to those of Gaussian function over the
predefined confidence intervals. In fact over I1,
Spline interpolation has a close behavior of Gaussian
function (68.30%) with an achievement percentage
of 65.25%. Cubic and Linear interpolation have both
an achievement percentage of almost 50% while
Nearest is around 40%. Over I2 and I3, Spline
outperformed the other interpolation techniques with
77% and 83% respectively. Linear interpolation
outperformed slightly Cubic one with 61% instead
of 60% and 68% instead of 66%; Nearest has
achievement percentages of 52% and 58% over I2
and I3 respectively while Gaussian function is
around 95% and 99%.
Then, we conclude that the achievement
percentages vary depending on the interpolation
method used and that Spline interpolation
outperforms the other interpolation techniques since
its achievement percentages are the closest to those
of a Gaussian distribution. Moreover, even if Spline
interpolation has better achievement percentages
over the three confidence intervals, the other
interpolation techniques provide a better deviation
approximation. In fact, median values of Cubic and
Linear interpolations are around 62 Man/month for
145Man/month for Spline knowing that the actual
median value of effort deviation is 50 Man/Month.
Then, the performance of Spline interpolation in
terms of achievement percentages can be explained
by an overestimation of effort deviation.
Considering the four interpolation methods, the
proposed entropy-based approach gave interesting
results since almost 50% to 65% of COCOMO’81
dataset projects are within interval I1 and 50% to
77% within interval I2. Spline interpolation has a
comparable results with those of Gaussian function
which leads us to consider that the Kitchenham and
Linkman (Kitchenham, 1997) assumption is a
plausible one. It worth notice that outliers removal
before interpolation improves the achievement
percentages of 10% to 18%.
7 CONCLUSION
This paper proposed an entropy-based approach in
order to deal with measurement and model errors for
any SDEE technique. Based on Shannon entropy
concept, the approach consists in two main steps.
The first step aims to construct a relationship of
entropy and effort deviation. Projects entropy is
computed over a learning set, based on the FCM
clustering algorithm which enables constructing
attributes membership functions. Moreover,
deviation is calculated to infer a relationship
between entropy and deviation. The second step
consists on estimating a new project effort deviation
knowing its entropy and using the relationship
function inferred over the learning set. The
estimated deviation is then used to set up the
Gaussian effort distribution parameters.
The proposed approach is evaluated over the
COCOMO’81 dataset with the FA SDEE technique,
the Jackknife evaluation method and with four
different interpolation methods. The obtained results
are interesting. Indeed, almost 50% to 65% of the
projects met the first confidence interval of
estimated effort deviation width. The effort
distribution of the proposed approach had also
comparable achievement percentage to the Gaussian
distribution especially over the first confidence
Entropy-based Framework Dealing with Error in Software Development Effort Estimation
201

interval. These results confirm the relevance of
entropy as an uncertainty measure and Gaussian
function as a plausible effort distribution. Still, the
results presented in this work are only preliminary.
Ongoing work explores other datasets and different
entropy formulas than Shannon one.
ACKNOWLEDGEMENTS
This work was conducted within the research project
MPHR-PPR1-2015-2018. The authors would like to
thank the Moroccan MESRSFC and CNRST for
their support.
REFERENCES
Kirsopp, C., Shepperd, M., Hart, J., 2002. Search
Heuristics, Case-based Reasoning and Software
Project Effort Prediction. In GECCO’02, 2
nd
Genetic
and Evolutionary Computation Conference.
MORGAN KAUFMANN PUBLISHERS INC.
MacDonell, S, G., Gray, A, R., 1997. A comparison of
modeling techniques for software development effort
prediction. In ICONIP’04, 4
th
International
Conference on Neural Information Processing.
SPRINGER.
Jorgensen, M., Shepperd, M., 2007. A systematic review
of software development cost estimation studies. In
IEEE Transactions on Software Engineering, vol 33.
IEEE PRESS.
Kitchenham, B., Linkman, S., 1997. Estimates,
Uncertainty and Risk. In IEEE Software, vol 14. IEEE
PRESS.
El-Koutbi, S., Idri, A., Abran, A., 2016. Systematic
Mapping Study of Dealing with Error in Software
Development Effort Estimation. In SEAA’42 , 42th
Euromicro Conference series on Software Engineering
and Advanced Applications. IEEE PRESS.
Idri, A., Amazal, F, A., Abran, A., 2015. Analogy-based
software development effort estimation: a systematic
mapping and review. In Information and Software
Technology, vol 58. ELSEVIER.
Papatheocharous, E., Andreou, A, S., 2009. Approaching
software cost estimation using an entropy-based Fuzzy
k-Modes clustering algorithm. In AIAI’05 Workshops
Proceedings, 5
th
Conference on Artificial Intelligence
Applications and Innovations.
Idri, A., Abran, A., Khoshgoftaar, T., 2002. Investigating
Soft Computing in Case-Based Reasoning for
Software Cost Estimation. In International Journal of
Engineering Intelligent Systems, vol 159. SPRINGER
Amazal, F, A., Idri, A., Abran, A., 2014. Improving fuzzy
analogy based software development effort estimation.
In APSEC’21, 21
st
Asia-Pacific Software Engineering
Conference. IEEE PRESS.
Shannon, C., 1948. A mathematical theory of
communication.
In Bell System Technical Journal, vol 27.
AMERICAN TELEPHONE AND TELEGRAPH.
Gray, R. 1990. Entropy and Information. SPRINGER.
Berlin, 2
nd
edition.
Borda, M., 2011. Fundamentals in Information Theory
and Coding, SPRINGER. Berlin, 1
st
edition.
Han, T, S., Kobayashi, Ki., 2002. Mathematics of
Information and Coding, American Mathematical
Society. Rhode Island, 1
st
edition.
Zadeh, L, A., 1965. Fuzzy sets. In Information and
Control, vol 8. ELSEVIER.
Liao, T, W., Celmins, A, K., Hammell, R, J., 2003. A
fuzzy c-means variant for the generation of fuzzy term
sets. In Fuzzy sets and Systems, vol 135. ELSEVIER.
Idri, A., Zahi, A., and Abran, A., 2006. Generating Fuzzy
Term Sets for Software Project Attributes using Fuzzy
C-Means and Real Coded Genetic Algorithms. In
ICT4M’06, 6
th
International Conference on
Information and Communication Technology For the
Muslim World. IEEE PRESS.
Bezdek, J., 1981. Pattern Recognition with Fuzzy
Objective Function Algorithms, SPRINGER. New
York, 1
st
edition.
Xie, X, L., Beni, G., 1991. A validity measure for fuzzy
clustering. In IEEE Transactions on Pattern Analysis
Machine Intelligence, vol 13. IEEE PRESS.
Bromiley, P., 2003. Products and convolutions of
gaussian probability density functions, TINA-VISION
MEMO. Manchester, 1
st
edition.
Menzies, T., Caglayan, B., Kocaguneli, E., Krall, J.,
Peters, F., Turhan, B., 2012. The promise repository of
empirical software engineering data. In
http://openscience.us/repo.
Idri, A., Abnane, I., Abran, A., 2016. Missing data
techniques in analogy-based software development
effort estimation. In Journal of Systems and Software,
vol 117. ELSEVIER.
Idri, A., Amazal, F.a., Abran, A., 2015. Accuracy
Comparison of Analogy-Based Software Development
Effort Estimation Techniques. In International
Journal of Intelligent Systems, vol 31. WILEY.
Amazal, F.A., Idri, A., Abran, A., 2014. Software
development effort estimation using classical and
fuzzy analogy: A cross-validation comparative study.
In International Journal of Computational Intelligence
and Applications, vol 13. ELSEVIER.
Shepperd, M., Schofield, C., 1997. Estimating software
project effort using analogies. In IEEE Transactions
on Software Engineering, vol 23. IEEE PRESS.
Quenouille, A, M, H., 1956. Notes on Bias in Estimation.
In Biometrika, vol 43. OXFORD UNIVERSITY
PRESS.
Kocaguneli, E., Menzies, T., 2013. Software effort models
should be assessed via leave-one-out validation. In
Journal of Systems and Software, vol 86. ELSEVIER.
Kitchenham, B., Pickard, L, M., S.G.MacDonell, S, G.,
Shepperd, M, J., 2001. What accuracy statistics really
measure. In IEE Proceedings – Software, vol 148.
IET.
Stamelos, I., Angelis, L., 2001. Managing uncertainty in
project portfolio cost estimation. In Information and
Software Technology, vol 43. ELSEVIER.
ENASE 2017 - 12th International Conference on Evaluation of Novel Approaches to Software Engineering
202
