
An Empirical Analysis of the Correlation between CK Metrics, Test
Coverage and Mutation Score
Robinson Cruso
´
e da Cruz
1,2
and Marcelo Medeiros Eler
1
1
School of Arts, Science and Humanities, University of S
˜
ao Paulo–USP, S
˜
ao Paulo, Brazil
2
Centro Universit
´
ario do Planalto de Arax
´
a–UNIARAX
´
A, Arax
´
a, Brazil
Keywords:
Testability, Testing, Metrics, CK, Code Coverage, Mutation Score.
Abstract:
In this paper we investigate the correlation between test coverage, mutation score and object-oriented sys-
tems metrics. First we conducted a literature review to obtain an initial model of testability and existing
object-oriented metrics related to testability. Thus we selected four open source system whose test cases were
available and calculated the correlation between the metrics collected and the line coverage, branches coverage
and mutation score. Preliminary results show that some CK metrics, which are strongly related to system’s
design, influence mainly line coverage and mutation score, thus they can influence systems testability.
1 INTRODUCTION
Software development can become very complex de-
pending on the characteristics and dimensions of the
software to be developed. Information systems very
often present low quality due to several problems that
can take place during their development, but mainly
because of a poor testing plan that fails to capture the
defects of the software. Nowadays, in such a com-
petitive market, delivering software with high quality
is not a competitive advantage anymore, but a basic
need (Tahir et al., 2014).
Testing is a key activity of the software deve-
lopment process that allows to discover faults in the
program and whether it complies with the level of
quality expected. The testing activity, however, may
be very elaborate as the complexity of the software
grows. Therefore, it is one of the most expensive
and time consuming activities of the software deve-
lopment process. The effort required to test a software
is known as testability. A program with high testabil-
ity is easier to test than a program with low testability.
Accordingly, studies have been conducted in the
academia and the industry to identify characteristics
of a software that can influence the effort required to
test a software (Abdullah and Khan, 2013). In partic-
ular, researchers have been trying to establish a cor-
relation between the metrics defined by Chidamber
and Keremer (CK), which are strongly related to
the object oriented design, and the testability of a soft-
ware. According to Sneed (Sneed, 2010), there are
some features that distinguish object-oriented soft-
ware from procedural, such as: encapsulation, gen-
eralization, association and polymorphism.
In most studies, the test effort was given by the
number and the size of test classes (lines of code),
and by the number of assertions. Despite these previ-
ous efforts to correlate CK metrics and testability, we
believe that there is still room for more investigation
in this field since most studies have focused only on
the test size and not in the quality of those test suites.
In this context, the propose of this paper is to present
an investigation we have conducted to correlate the
CK metrics with code coverage (lines and branches)
and mutation score. The main goal of this study is
to check the influence of the CK metrics on the qual-
ity of the test cases produced rather than the test size.
As the CK metrics are strongly related to the software
design, understanding such correlation may help de-
velopers to design more testable software. Four open
source software were analyzed and the metrics were
collected and correlated using the spearman’s rank-
order.
The remainder of this paper is organized as fol-
lows. Section 2 presents the basics concept of testa-
bility and metrics. Section 3 shows the related work.
Section 4 presents the design while Section 5 depicts
the results of our study. Finally, Section 6 discusses
the results and Section 8 presents some concluding
remarks and future directions.
Cruz, R. and Eler, M.
An Empirical Analysis of the Correlation between CK Metrics, Test Coverage and Mutation Score.
DOI: 10.5220/0006312703410350
In Proceedings of the 19th International Conference on Enterprise Information Systems (ICEIS 2017) - Volume 2, pages 341-350
ISBN: 978-989-758-248-6
Copyright © 2017 by SCITEPRESS – Science and Technology Publications, Lda. All rights reserved
341

2 SOFTWARE TESTABILITY
AND METRICS
Testability is a fundamental software quality attribute
that evaluates the complexity and effort required to
perform testing activities (ISO, 1991). It has been
defined as the degree to which a system or compo-
nent facilitates the establishment of test criteria and
whether these tests could be performed (IEEE, 1990).
To test a component one must be able to control the
inputs and observe their outputs, as a software with
high testability enables analyzes to be carried out dur-
ing the tests.
There are several internal and external factors of
software that can be related to testability (Badri and
Toure, 2012; Bruntink and van Deursen, 2004). Soft-
ware size measures, code complexity, and coupling,
for instance, are internal factors. On the other hand,
documentation, testing tools and processes are exam-
ples of external factors. According to Binder (Binder,
1994), testability is a result of six primary factors,
which are depicted in Figure 1. Each of these factors
can facilitate or hinder the test in many ways: rep-
resentation, a representation is necessary to develop
test cases; implementation, implementation charac-
teristics determine the control and observation; built-
in Test, testing capacity can improve the control and
observation and disassociate testability of application
characteristics; test suite, a collection of test suite is
useful and necessary; test tools, testing tools are re-
quired for efficacy testing; test process, without an
organized and effective approach to testing, testabil-
ity is irrelevant.
Figure 1: Six testability primary factors (Binder, 1994).
The factors that can influence testability can be ex-
pressed in terms of software metrics, which are inter-
nal and external measures of a software product that
can help in planning and software development (Li,
1999). A particular set of internal metrics proposed
by Chidamber and Kemerer in 1994 (Chidamber and
Kemerer, 1994), most known as the CK metrics, are
strongly related to the object oriented design of a soft-
ware and they have been used to calculate the testabil-
ity and the maintainability of a software. Those met-
rics are the following:
• CBO - Coupling between Object Classes: is the
number of classes in which the class is coupled.
Theoretically, an object is bound by another ob-
ject if one performs action on the other, for exam-
ple: when a class uses methods of other classes
or when a class uses instance variable to access
another class (Chidamber and Kemerer, 1994).
• DIT - Depth of Inheritance Tree: can be defined
as the class of the position in the inheritance tree.
It is a measure of how an ancestor class can po-
tentially affect the class analyzed (Chidamber and
Kemerer, 1994).
• LCOM - Lack of Cohesion of Methods: is con-
sidered a measure that quantifies the similarity of
the methods of a class. Two methods are cohe-
sive whether share the same class attributes. To
quantify this result, all methods of the class are
examined in pairs to quantifying the variables in
common classes (Chidamber and Kemerer, 1994).
• NOC - Number of Children: is the number of
subclasses of the class analyzed in the class hier-
archy. This defines how to analyze what are the
classes affected in the event of changes in class
analyzed (Chidamber and Kemerer, 1994).
• RFC - Response for a Class: is related to the
amount of methods that can be performed in re-
sponse to a message received by an object. This
is calculeted by the sum of the number of me-
thods of the class plus the number of external me-
thods used by methods of the analyzed class (Chi-
damber and Kemerer, 1994).
• WMC - Weighted Methods Per Class: this
metric has been proposed to measure the com-
plexity of a class (Chidamber and Kemerer, 1994).
The complexity can be measured by many ways,
for example by cyclomatic complexity proposed
by McCabe (McCabe, 1976).
3 RELATED WORK
Some researches have tried to explain whether exists
correlation between CK metrics and the effort of the
unit testing. Most of them were based on the source
code or the class diagrams of the software analyzed,
and the correlation was calculated between metrics of
the pair (C,C
t
), where C is a class to be tested and C
t
is
the correspondent testing class. The number of lines
of code of the testing class (T LOC) and the amount of
test cases (TAsserts) were correlated with CK metrics
of the class to be tested (C). The Spearman’s corre-
lation was the method most used to calculate the cor-
relation between metrics of C and C
t
. Table 1 shows
a list of published work in this field and which met-
rics they have analyzed. Following there are distinct
characteristics of each of those work.
ICEIS 2017 - 19th International Conference on Enterprise Information Systems
342
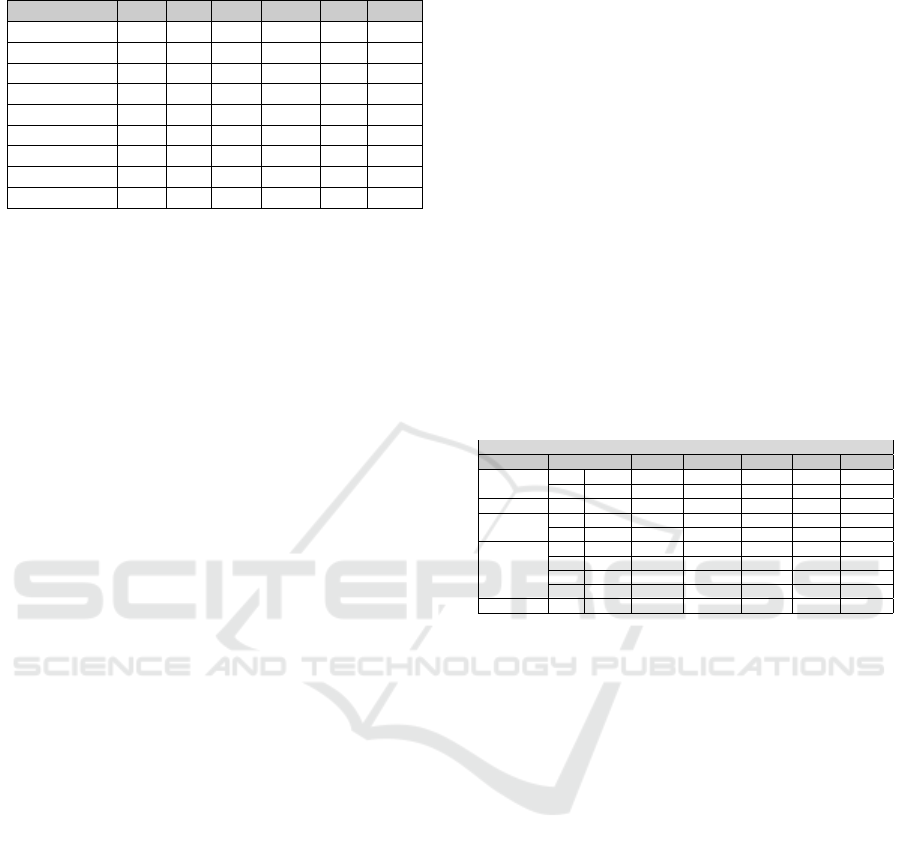
Table 1: Related Work.
Paper CBO DIT NOC LCOM RFC WMC
A1 X - - - - -
A2 X X X - - -
A3 X X X X X X
A4 X X X X X X
A5 X
A6 X X X X X X
A7 X X - - - -
A8 X - - -
Sum 7 5 4 4 3 3
A1 (Khan and Mustafa, 2009) extracted three
class diagram level metrics: ENM (encapsulation
metric) which counts the number of all the methods
defined in a class, REM (reuse inheritance metric)
which counts for a class the depth of its inheritance
tree in the design and the CPM (coupling metric)
which counts the number of classes that a class is re-
lated to. The Based Testability Model for Object Ori-
ented Design (MTMOOD) were proposed to measure
the testability.
A suite of six projects was developed by different
individuals for the study. These six projects were also
evaluated using the proposed metric suite. A group
of ten independent evaluators was assigned to study
the quality of the six projects in the validation suite.
All the evaluators had 8 to 12 years of experience in
commercial software development. All the partici-
pants analyzed each project design and assigned the
scores 1 to 6 based on a decreasing testability score
and the results were correlated with equation 1.
Testability = −0.08 ∗ Encapsulation + 1.12 ∗ Inheritance + 0.97 ∗Coupling
(1)
According to the authors, the proposed model is
more practical since quantitative data on testability is
of immediate use in the software development pro-
cess (Khan and Mustafa, 2009). The result obtained
in their study is a high correlation between evaluators
score on the testability of the six softwares and the
proposed calculation.
A2 (Khalid et al., 2010) extracted the metrics AHF
(Atribute Hiding Factor), that is computed by dividing
the attributes hidden to the total attributes defined in
the class, MHF (Method Hiding Factor), that is com-
puted by dividing the methods hidden in the class to
total methods defined in the class, and CK Metrics
DIT, NOC and CBO. Metrics were collected from
four projects using the class diagram. This work,
the metrics proposed were detailed and related be-
tween complexity, testability and different attributes
of object oriented software design by predicting class
level testability. According to the authors, “Predict-
ing complexity of design at class level helps to sim-
plify the design as much as possible. Object oriented
design metrics extended by the approach proposed in
this work helps to obtain the quantifiable results so
that complexity of design can be predicted.”
A3 (Bruntink and van Deursen, 2004),
A4 (Bruntink and van Deursen, 2006), A5 (Badri and
Tour, 2011) and A6 (Badri and Toure, 2012) analyzed
the correlation between CK metrics and code lines
(T LOC) and test cases asserts (TAssert) generated
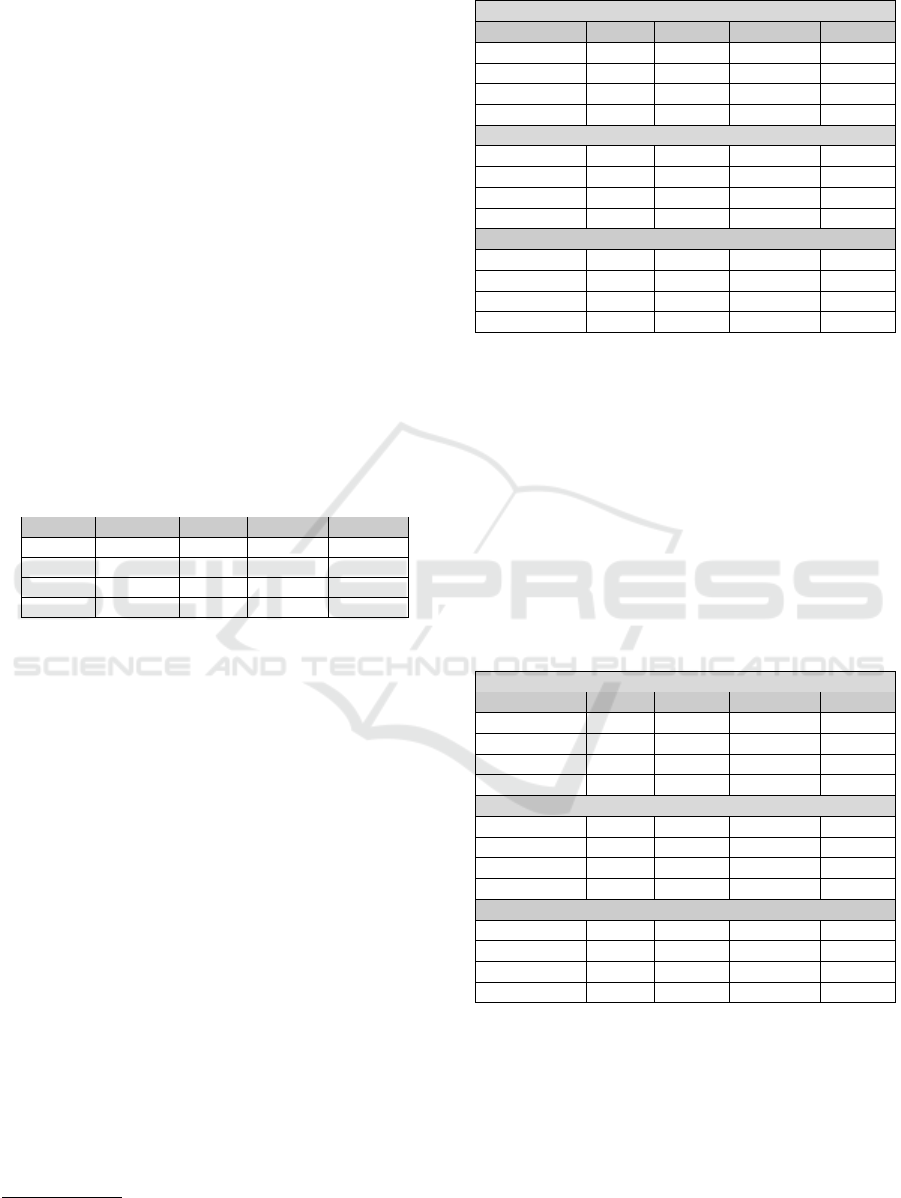
in the unit testing. Table 2 shows the correlation
between CK metrics and test cases (TAssert) in these
work. Values set boldface in the results of correlation
means that there is statistically significance. There is
correlation between TAssert and the metrics CBO,
LCOM, RFC and WMC, indicating that the higher
the value of these metrics, the higher the number
of test cases required (TAsserts). However, metrics
NOC and DIT seems to have insignificant impact
because there is no pattern in the results.
Table 2: Result of related work metrics (A3 to A6).
CK Metrics vs Test Case (TAsserts)
SYSTEM P. CBO DIT LCOM NOC RFC WMC
JFC
A4 0.424
A6 0.261 0.069 0.439 0.224 0.197 0.453
POI A6 0.280 -0.100 0.155 0.011 0.365 0.400
DOCGEN
A3 0.457 -0.059 0.207 0.002 0.526 0.460
A4 0.457 -0.059 0.207 0.002 0.526 0.460
ANT
A3 0.307 -0.020 0.382 -0.026 0.341 0.348
A4 0.307 -0.020 0.382 -0.026 0.341 0.348
A5 0.326
A6 0.135 -0.203 0.347 0.034 0.071 0.391
ZPC A4 0.240 -0.064 0.215 -0.022 0.455 0.511
Studies A3 and A4 used the metric FOUT(Fan
Out), wich is an adaptation of the CBO metric, since
they have only considered the number of classes used
by the analyzed class (Bruntink and van Deursen,
2006). However, in this study we considered it as
CBO to simplify the comparison with the results of
our work.
A7 (Kout et al., 2011) adapted the equation
1 (Khan and Mustafa, 2009) using the following met-
rics: NOO (number of operations in a class), DIT and
CBO. The equation 2 (MTMOOP) gives the compu-
tational formula used for assessing the testability of a
class at the source code level.
Testability = −0.08 ∗ NOO + 1.12 ∗ DIT + 0.97 ∗CBO
(2)
In experiments the authors collected metrics from
two open source Java software systems. The goal
of the study was to explore empirically the relation-
ship between the MTMOOP (equation 2) model and
testability (in terms of testing effort) of classes. The
MTMOOP calculation result of each class was corre-
lated with metrics extracted from the test cases and,
according to the authors: “the achieved results sup-
port the idea that there is a statistically significant re-
An Empirical Analysis of the Correlation between CK Metrics, Test Coverage and Mutation Score
343

lationship between the model and the used test case
metrics” (Kout et al., 2011).
A8 (Tahir et al., 2014) analyzed two metrics: Dy-
namic Coupling (runtime method invocations/calls)
and Key Class (classes that have high execution fre-
quency at runtime). The two metrics were col-
lected from four systems at run time and related to
the number of lines of code (T LOC) and test case
(TAssert). According to authors, “the resulting evi-
dence indicates that there is a significant association
between Dynamic Coupling and internal class testa-
bility” (Tahir et al., 2014).
The related work shows that there is a correlation
between design metrics such as CK metrics and test
effort. However, most studies focus only on test size
and number of test cases rather than the quality of
test cases. The number of test cases and their size is
important, but it is also important to know their ade-
quacy to test criteria such as line and branch coverage.
Only work A4 described the quality of the test suites
analyzed.
4 EXPERIMENTAL DESIGN
The general purpose of this paper is to evaluate
whether there is a correlation between the CK met-
rics and testability, when it comes to the adequacy
of the test suites produced. Differently from the re-
lated work found in the literature, we correlated the
CK metrics with code coverage (lines and branches)
and mutation score, which indicates the efficacy of the
test cases in uncovering artificial faults introduced by
small changes in the original program (Offutt, 1994).
We believe that the number of lines of code of a test-
ing class and the number of asserts may be suitable
to evaluate the test effort, but as long as it is related
to some sort of evaluation of the test suite adequacy.
The next sections describes the experimental proce-
dure adopted to reach our results.
4.1 Sample Selection
We selected four open source Java system whose
test cases were available: APACHE POI, JABREF,
JFREECHART and MOEA. The Apache POI is a
tool to create and maintain Java APIs for manip-
ulation file based Office open XML standars and
Microsofts OLE 2 Compound Document format
(OLE2). JABREF is a tool that provides features to
reference management support for the BibTeX file
format. JFREECHART(JFC) is a Java chart library
for development quality charts. MOEA is a Java-
based framework to development, experimentation
and optimization of algorithms.
These software were chosen because they are used
in several researches, including some related work
(Section 3).
4.2 Metrics and Tools
On the program under test side, we decided to collect
metrics related to the object oriented design of a sys-
tem. Therefore, we have based our analysis on the CK
metrics. We believe that discovering the correlation
between those metrics and testability may help devel-
opers on producing better and more testable designs.
On the testing classes side, we decided to collect in-
formation regarding the quality of the tests rather than
their size. Therefore, we resort to code coverage and
mutation score analysis.
Test coverage is ”the degree to which a given test
or set of tests addresses all specified requirements for
a given system or component” (IEEE, 1990). Cove-
rage analysis is used to provide quality manager with
information about the portions of their code or spec-
ification which are executed or not during tests. In a
white box approach, coverage is related with objec-
tive analyze what percentage of class that is covered
by test cases. There are several kinds of coverage,
however, in this research we use line and branch co-
verage:
• Line Coverage: is also known as statement co-
verage. The goal is executing all the line in the
program under test. A test set that satisfies this re-
quirement is considered to be adequate according
to the statement coverage criterion. Sometimes
the percentage of executed statements is calcu-
lated to indicate how adequately the testing has
been performed. The percentage of the statements
exercised by testing is a measurement of the ade-
quacy (Zhu et al., 1997).
• Branches Coverage: similarly, the branch cove-
rage criterion requires that all control transfers in
the program under test are exercised during test-
ing. The percentage of the control transfers exe-
cuted during testing is a measurement of test ade-
quacy (Zhu et al., 1997).
Mutation Testing generates different versions
(mutants) of a program under test by introducing
small changes that are suppose to be defects in the
code. The test cases of the program are thus exe-
cuted against these versions with goal of causing each
faulty version to fail. When the mutation version fails,
it is said that it is a killed mutant, when it does not
fail, it is considered a alive mutant. The test set are
then enhanced to reveal faults on the alive mutants or
ICEIS 2017 - 19th International Conference on Enterprise Information Systems
344

the alive mutants, at some point, are deemed equiva-
lents, i.e., no fault has been introduced with the small
change (Offutt, 1994).
The mutation score is a measure that indicates
how efficient a test set is to reveal faults in the faulty
versions (mutants), and it is calculated by the ratio of
dead mutants over the amount of mutants generated.
The mutation adequacy of a set of test data is mea-
sured by an adequacy score computed according to
the equation 3 (Zhu et al., 1997):
MC =
D
M − E
(3)
where D is the number of dead mutants, M is the total
number of mutants, and E is the total number equiv-
alent mutants. “Equivalent mutants are mutant pro-
grams that are functionally equivalent to the original
program and therefore cannot be killed by any test
case”(Offutt et al., 1996).
The following tools/plugins were used to col-
lect metrics and calculate code and mutation score:
Eclipse Metrics, EMMA, JHAWK, JUNIT and
PITEST. Eclipse Metrics
1
and JHawk
2
were used to
collect the CK metrics. JUnit
3
was used to execute
the test cases provided along with the open source
software while Emma
4
was used to calculate test co-
verage. PITEST
5
was used to perform mutation anal-
ysis and to generate the mutants we used the default
mutant generation option available in this tool.
4.3 Data Collection
Establishing the correlation between CK metrics and
testability based on the test cases provided along with
the open source software analyzed may bring some
risks. For instance, we have no information about
the time spent to create each testing class. Moreover,
we have no information about the test plan and objec-
tives, i.e., we do not know whether the testers had the
purpose of achieving high coverage on line or branch
criteria, for example. We are not sure whether the low
coverage of a class is due to its complexity or due to
the lack of interest of the testers on testing such class
more carefully.
To mitigate this issue, we have decided to perform
the analysis of the programs under test in different
settings. These settings are shown in Table 3. The
first setting considers all classes, including those from
which no test cases is available. The second setting
1
http://eclipse-metrics.sourceforge.net
2
http://www.virtualmachinery.com
3
http://junit.org
4
http://emma.sourceforge.net
5
http://pitest.org/
considers all classes in which more than 66% of the
lines were executed, indicating that the testers have
put some effort to get it tested. The third setting con-
siders all classes in which the percentage of lines co-
vered is more than the mean considering all classes of
the project. Finally, the fourth setting considers only
classes in which more than 90% of the lines were co-
vered. This last setting aims to investigate the charac-
teristics of the classes that have been almost or fully
covered.
Table 3: Data Analysed.
Analysis Line Branch Mutation
1 > 0.0% >= 0.0% >= 0.0%
2 >= 66.0% >= 0.0% >= 0.0%
3 >= mean% >= 0.0% >= 0.0%
4 >= 90.0% >= 0.0% >= 0.0%
The first setting considers all classes, even those
for which no test cases have been specified. Con-
sider, for example, two different classes: one sim-
ple and self contained class which has no dependency
that has not been covered at all (0% coverage), and
a very complex class with several dependencies that
has been 65% covered. A correlation analysis might
conclude that more complexity leads to higher cove-
rage, while less simple classes are more difficult to
test because they haven’t been covered at all. It is in-
deed a simplistic example and the random nature of
the classes of each project may balance the analysis
up, but we still decided to perform separate analysis
for different settings.
We believe, therefore, that second and third set-
tings are more realistic, but we believe the fourth set-
ting is of interest as well because it is an indication
that this specific class has been thoroughly tested and
the difference between coverage measures might be
impacted by the different CK metrics. Table 4 shows
the amount classes that were analyzed in each soft-
ware considering the four settings.
Table 4: Classes analysed in the tests.
Analysis JABREF JFC MOEA POI Sum
1 318 411 359 694 1782
2 236 224 316 602 1378
3 210 242 250 444 1146
4 159 69 230 365 823
4.4 Statistical Analysis
We calculate the correlation between the CK metrics
and the coverage and mutation score using the Spear-
mans correlation coefficient. Spearmans rank-order
correlation coefficient is a measure of association be-
tween two variables where the result is a value range
An Empirical Analysis of the Correlation between CK Metrics, Test Coverage and Mutation Score
345
from -1 (perfect negative correlation) to 1 (perfect
positive correlation), and a value 0 indicates no corre-
lation. The correlation results statistical significance
were also calculated considering α = 0.05. RStudio
6
tool was used to calculate the correlation and values
set boldface in the results of correlation means that
there is statistically significance.
5 RESULTS
Table 5 shows the result of the data collected on
the execution of the test cases of each analyzed
project. Column 1 shows the name of the project
while columns 2, 3 and 4 show the mean value for
all classes of line coverage, branch coverage and mu-
tation score, respectively. It is important to notice,
however, that the correlation between the CK metrics
and the test measures is not calculated based on the
mean value of the whole project, but considering each
class individually.
Table 5: Coverage of Classes.
System Test Class Line Branches Mutation
JABREF 318 77.43% 52.00% 66.82%
JFC 411 62.45% 47.52% 42.70%
MOEA 359 87.22% 61.47% 26.63 %
POI 694 84.69% 54.51% 69.40%
In the next subsections the results of the correla-
tion between each CK metric and the test measures is
presented. All data are presented following the four
settings defined in Table 3. The values set boldface in
the results of correlation means that there is statisti-
cally significance(α = 0.05).
5.1 CBO Metric
Table 6 shows the results of the correlation between
CBO metric and test measures. The correlation be-
tween CBO and line coverage is a weak and nega-
tive correlation. A negative correlation means that the
higher the coupling between objects, the lower the
line coverage, while the positive correlation means
the opposite. The negative correlation in JABREF,
however, is moderate.
When it comes to branch coverage, it seems that
in some projects there are weak positive and nega-
tive correlation, or no correlation at all, since some
correlations is very close to 0. Regarding the muta-
tion score, except for the POI project, whose mean
mutation score is oddly low, the correlation seems to
follow the same pattern as the line coverage.
6
http://www.rstudio.com
Table 6: CBO vs Test Measures- Spearman’s ρ values.
CBO vs LINE COVERAGE
SYSTEM >= 0% >= 66% >= mean% >= 90%
JABREF -0.420 -0.480 -0.490 -0.440
JFREECHART -0.160 -0.220 -0.210 -0.170
MOEA -0.170 -0.200 -0.170 -0.190
POI -0.110 -0.200 -0.190 -0.190
CBO vs BRANCHES COVERAGE
JABREF -0.150 -0.160 -0.170 -0.120
JFREECHART -0.050 -0.050 -0.050 -0.040
MOEA 0.110 0.100 0.120 0.160
POI 0.170 0.150 0.180 0.160
CBO vs MUTATION SCORE
JABREF -0.360 -0.400 -0.420 -0.370
JFREECHART -0.270 -0.340 -0.350 -0.320
MOEA 0.170 0.180 0.220 0.250
POI -0.080 -0.140 -0.080 -0.100
5.2 DIT Metric
The Table 7 shows the results of the correlation be-
tween DIT metric and test measures. The results show
that there may not be a pattern of correlation consid-
ering each project individually and code coverage. In
some projects there seems to be no correlation, or a
weak positive or weak negative correlation. The cor-
relation with mutation score seems to indicate a weak
negative relation. Could not get a standard result of
the system.
Table 7: DIT vs Test Measures- Spearman’s ρ values.
DIT vs LINE COVERAGE
SYSTEM >= 0% >= 66% >= mean% >= 90%
JABREF -0.080 -0.030 -0.050 -0.140
JFREECHART -0.300 -0.180 -0.190 -0.230
MOEA 0.010 0.010 0.040 0.040
POI 0.280 0.260 0.200 0.200
DIT vs BRANCHES COVERAGE
JABREF -0.100 -0.090 -0.090 -0.100
JFREECHART -0.260 -0.280 -0.290 -0.320
MOEA 0.120 0.250 0.260 0.270
POI -0.300 -0.340 -0.380 -0.370
DIT vs MUTATION SCORE
JABREF -0.040 0.070 0.070 0.070
JFREECHART -0.310 -0.240 -0.250 0.060
MOEA -0.180 -0.150 -0.200 -0.200
POI -0.020 -0.090 -0.140 -0.150
5.3 LCOM Metric
The Table 8 shows the results of the correlation be-
tween LCOM metric and test measures. The results
seems to indicate that there is a weak negative cor-
relation between LCOM metric and line coverage and
mutation score. The correlation does not follow a spe-
cific pattern when it comes to branch coverage.
ICEIS 2017 - 19th International Conference on Enterprise Information Systems
346
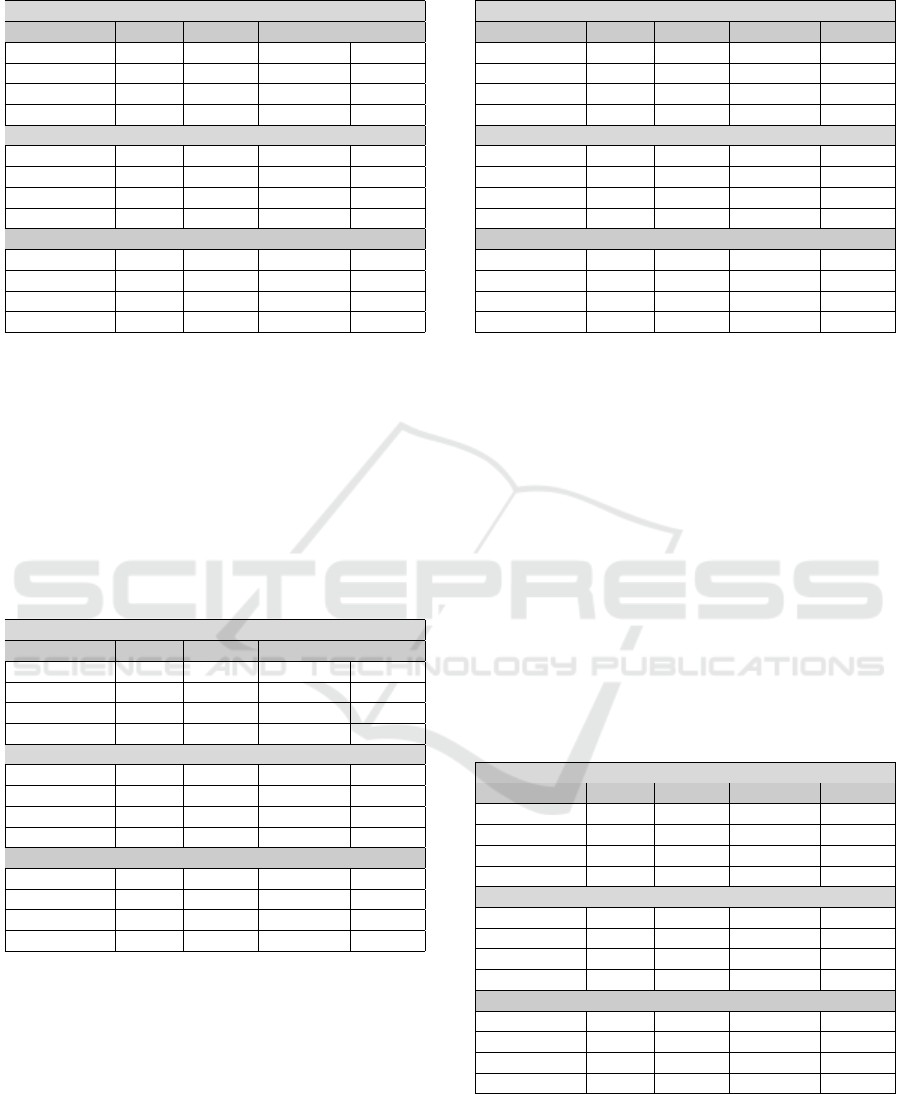
Table 8: LCOM vs Test Measures - Spearman’s ρ values.
LCOM vs LINE COVERAGE
SYSTEM >= 0% >= 66% >= mean% >= 90%
JABREF -0.300 -0.330 -0.300 -0.210
JFREECHART -0.120 -0.160 -0.150 -0.180
MOEA -0.240 -0.310 -0.290 -0.340
POI 0.040 -0.050 -0.040 -0.080
LCOM vs BRANCHES COVERAGE
JABREF -0.110 -0.100 -0.090 -0.040
JFREECHART 0.030 0.110 0.120 0.260
MOEA 0.090 0.070 0.100 0.110
POI -0.100 -0.140 -0.200 -0.200
LCOM vs MUTATION SCORE
JABREF -0.310 -0.360 -0.370 -0.380
JFREECHART -0.130 -0.170 -0.160 -0.180
MOEA 0.060 -0.070 -0.030 -0.020
POI -0.080 -0.130 -0.150 -0.150
5.4 NOC Metric
The Table 9 shows the results of the correlation be-
tween the NOC metric and test measures. Results in-
dicate that there is no correlation between the NOC
metric and the other measures in most of the cases.
There is a weak positive relationship between the
NOC metric and branch coverage, but the values are
not expressive.
Table 9: NOC vs Test Measures - Spearman’s ρ values.
NOC vs LINE COVERAGE
SYSTEM >= 0% >= 66% >= mean% >= 90%
JABREF -0.230 -0.120 -0.120 -0.090
JFREECHART -0.130 0.000 0.010 -0.060
MOEA 0.010 0.000 -0.130 -0.090
POI -0.020 0.130 0.020 -0.010
NOC vs BRANCHES COVERAGE
JABREF -0.130 -0.050 -0.040 -0.090
JFREECHART 0.100 0.070 0.070 0.020
MOEA 0.190 0.190 0.170 0.200
POI 0.030 0.030 0.040 0.030
NOC vs MUTATION SCORE
JABREF -0.170 -0.020 -0.030 -0.070
JFREECHART 0.010 -0.110 -0.110 -0.170
MOEA 0.070 0.090 0.070 0.070
POI 0.020 0.050 -0.020 0.020
5.5 RFC Metric
The Table 10 shows the results of the correlation be-
tween the RFC metric and test measures. There is a
weak or moderate negative correlation between RFC
and line coverage and mutation score. When it comes
to branch coverage, however, there seems to be no
pattern of correlation.
Table 10: RFC vs Test Measures-Spearman’s ρ values.
RFC vs LINE COVERAGE
SYSTEM >= 0% >= 66% >= mean% >= 90%
JABREF -0.440 -0.430 -0.420 -0.350
JFREECHART -0.110 -0.320 -0.300 -0.540
MOEA -0.400 -0.510 -0.550 -0.540
POI -0.120 -0.180 -0.170 -0.240
RFC vs BRANCHES COVERAGE
JABREF -0.100 -0.050 -0.040 0.020
JFREECHART 0.190 0.210 0.200 0.440
MOEA 0.110 0.070 0.120 0.150
POI 0.000 -0.030 -0.070 -0.050
RFC vs MUTATION SCORE
JABREF -0.450 -0.480 -0.500 -0.500
JFREECHART -0.080 -0.200 -0.210 -0.260
MOEA -0.130 0.140 0.090 -0.070
POI -0.230 -0.250 -0.220 -0.240
5.6 WMC Metric
Table 11 shows the results of the correlation between
the WMC metric and test measures. There is a mo-
derate negative correlation between the WMC metric
and line coverage, which means that the higher the
complexity, the lower the line coverage. Oddly, there
is a week positive correlation between the WMC
metric and branch coverage, which means that the
higher the complexity, the higher the branch cove-
rage. One possible causes for this phenomenon is that
the higher the complexity, the higher the number of
branches to be covered. The results also indicate a
weak negative correlation between WMC and muta-
tion score.
Table 11: WMC vs Test measures-Spearman’s ρ values.
WMC vs LINE COVERAGE
SYSTEM >= 0% >= 66% >= mean% >= 90%
JABREF -0.450 -0.460 -0.490 -0.430
JFREECHART -0.210 -0.320 -0.310 -0.590
MOEA -0.370 -0.500 -0.610 -0.600
POI -0.210 -0.330 -0.270 -0.360
WMC vs BRANCHES COVERAGE
JABREF 0.110 0.150 0.150 0.250
JFREECHART 0.140 0.240 0.230 0.590
MOEA 0.270 0.210 0.270 0.330
POI 0.550 0.220 0.220 0.230
WMC vs MUTATION SCORE
JABREF -0.370 -0.390 -0.420 -0.420
JFREECHART -0.160 -0.210 -0.220 -0.280
MOEA -0.020 -0.040 -0.040 -0.070
POI -0.170 -0.180 -0.090 -0.130
5.7 Other Analysis
Additionally, we have performed other analysis rather
than comparing design metrics with testing measures.
An Empirical Analysis of the Correlation between CK Metrics, Test Coverage and Mutation Score
347
We have decided to also analyze the correlation be-
tween code coverage and mutation score, which in-
dicates whether more coverage would help to reveal
more faults, or at least kill more mutants consider-
ing a mutation analysis approach. Table 12 shows
the results of the correlation between Line Coverage
and Mutant coverage. The results indicate a mode-
rate positive correlation between line coverage and
the mutation score since the mutation score increases
as the line coverage increases. The correlation for
project MOEA, however, indicates a weak positive
correlation. This can be explained by the low mean
mutation score 26.63% (Table 5). We noticed that
in software analysis with high coverage (>= 90%),
there is a weak negative correlation, indicating that
after some coverage has been reached, the number
of mutants killed as the line coverage is increased is
not so higher as when considering more low covered
classes.
Table 12: MUTANTION SCORE vs LINE COVERAGE-
Spearman’s ρ values.
MUTANT SCORE vs LINE COVERAGE
SYSTEM >= 0% >= 66% >= mean% >= 90%
JABREF 0.750 0.580 0.540 0.380
JFREECHART 0.730 0.520 0.540 0.310
MOEA 0.310 0.230 0.070 0.010
POI 0.460 0.390 0.380 0.350
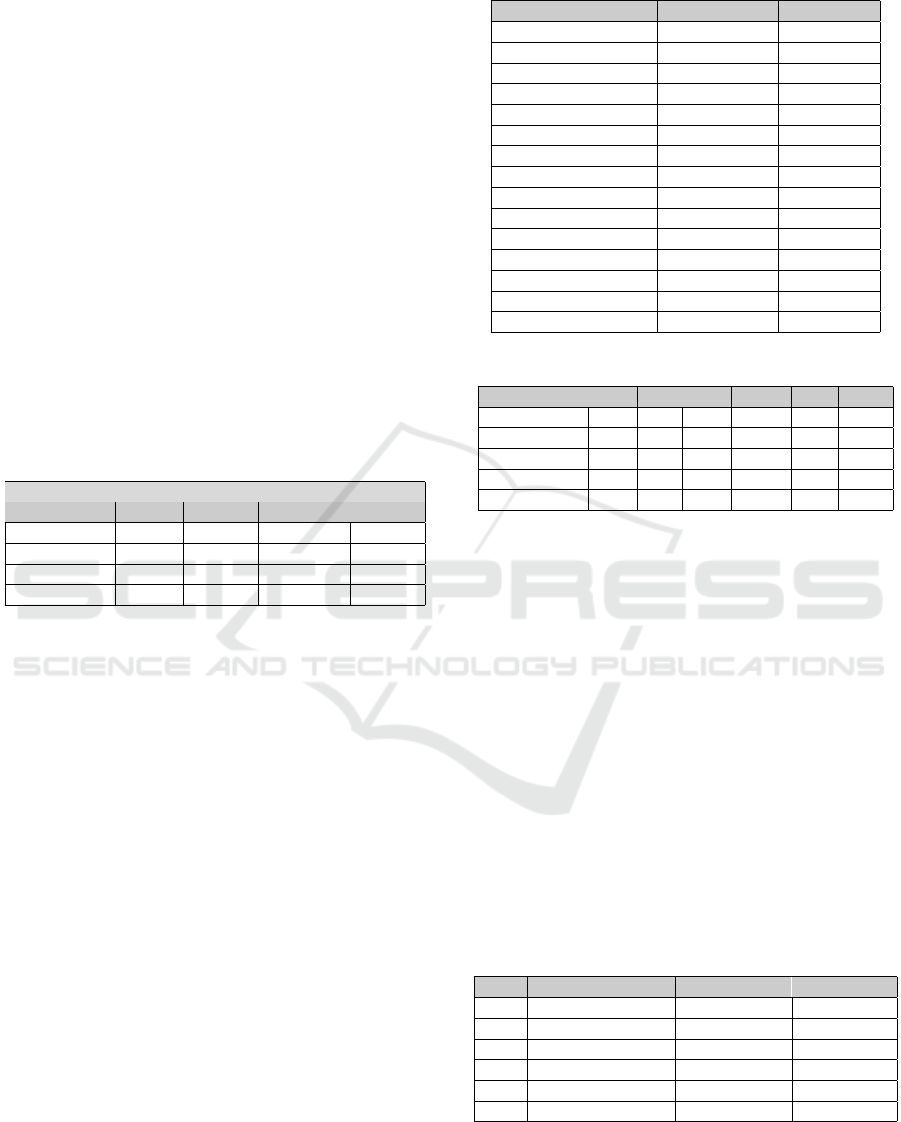
Table 13 provides the correlations between each
CK metric, considering the results of this work and
related work A3 to A6 (Section 3). It is important
to notice that this is the mean correlation consider-
ing all projects and all classes. The goal of this com-
parison is to check whether there is a pattern of the
metrics collected in this research and in the related
work. The first thing to notice is that the source code
metrics themselves are correlated. A second obser-
vation is that the results between this research and
related work are similar in (CBO vs DIT), (CBO vs
LCOM), (DIT vs LCOM),(LCOM vs NOC), (LCOM
vs WMC), (NOC vs WMC) and (RFC vs WMC).
We observe that the WMC metric strongly corre-
lates with the RFC metric for all systems. An expla-
nation is offered by the fact that for all systems, the
greater the complexity of a class, the greater the quan-
tity of external and internal methods used by method.
Between the WMC and CBO there is an important
correlation too, which can be explained by the fact
that high coupling brings more complexity to a class.
Finally, Table 14 shows an analysis of the impor-
tance of each metric with respect its impact on testa-
bility considering the results of this research and re-
lated work (Section 3), where I mean that the metric
was important, N when the metric was not important
Table 13: Analysis of Metrics - spearman’s ρ values.
Metric vs Metric Related Work Mean Mean this Work
CBO vs DIT 0.117 0.140
CBO vs LCOM 0.366 0.330
CBO vs NOC 0.040 0.250
CBO vs RFC 0.812 0.470
CBO vs WMC 0.658 0.480
DIT vs LCOM 0.145 0.120
DIT vs NOC 0.023 -0.040
DIT vs RFC 0.260 0.220
DIT vs WMC 0.030 0.080
LCOM vs NOC 0.105 0.120
LCOM vs RFC 0.210 0.540
LCOM vs WMC 0.432 0.460
NOC vs RFC 0.089 0.150
NOC vs WMC 0.144 0.120
RFC vs WMC 0.802 0.850
Table 14: Summary Importance of metrics in testability.
Paper CBO DIT NOC LCOM RFC WMC
This Work I N N I I I
A3 I N N I I I
A4 I N N I I I
A5 NA NA NA I NA NA
A6 I N N I I I
and NA when the metric was not analyzed. This result
shows similarity in the importance of metrics CBO,
LCOM, RFC and WMC in both this research and re-
lated work.
6 DISCUSSION AND
RECOMMENDATIONS
Table 15 summarizes the type of correlation there is
between CK metrics and the test measures. Notice
that there is no strong correlation between CK metrics
and test measures. This can be explained by the fact
that there are several factors that may influence testing
activities rather than just one factor. It is interesting
Table 15: Summary of the correlation between the CK met-
rics and test measures
Metric Line Coverage Branch Coverage Mutation Score
CBO weak negative inconclusive weak negative
DIT inconclusive inconclusive weak negative
LCOM weak negative inconclusive weak negative
NOC inconclusive inconclusive inconclusive
RFC weak/moderate negative inconclusive weak negative
WMC moderate negative weak positive weak negative
to notice that, for most case, the correlation between
CK metrics and branch coverage is inconclusive, i.e.,
there is no pattern according to our analysis. In some
cases the correlation coefficient was almost zero, or
ICEIS 2017 - 19th International Conference on Enterprise Information Systems
348

for some projects weak positive and for others weak
negative, which indicates no pattern. Line coverage is
more influenced by the RFC and the WMC method,
while CBO and LCOM seems to have a slight influ-
ence on it. Mutation Score is also slightly influenced
by all metrics, except for NOC.
Our results seems to be in line with related work
which deemed metrics CBO, LCOM, RFC and WMC
to have some influence on the software testability.
However, their analysis were based on the number of
lines of the test classes and the number of asserts of
each testing class, while our study focused on code
coverage and mutation score.
Based on our analysis and in related work found
in the literature, we drew some recommendations to
software developers and architects when designing
more testable software:
• CBO: invest in keeping the design simple and less
coupled as possible. High coupling leads to more
complex unit and integration testing, which can
result in poor test cases depending on the bud-
get and time available for testing activities. The
higher the coupling, the lower the line coverage
and test effectiveness.
• LCOM: proper separation of concerns helps de-
velopers to create classes with high cohesion.
High cohesion leads to better designs and more
testable software. Classes with many different
functions also result in testing classes with differ-
ent purposes, which can jeopardize the systematic
testing.
• RFC: developers should organize classes writing
methods and analyze the need for external calls,
since it leads to more coupling during design and
runtime. It has been shown that this increases
the test effort and the quality of the test suites.
Analyze the possibility of merging methods and
classes according to refactoring patterns so it can
decrease the amount of calls between methods of
the same or different classes.
• WMC: write more simple methods and invest in
refactoring to get complex methods more simple.
Experienced developers and testers know that me-
thods and classes with complex logic are more dif-
ficult to test, and recent studies have been con-
ducted to quantify the influence of characteris-
tics of programs on the testing activity (de Castro
et al., 2016). The more complex the method, the
less lines of code are covered.
7 THREATS TO VALIDITY
We have identified some threats that could affect the
validity of our findings. First, the number of appli-
cations analysed is not statiscally expressive. How-
ever, we selected those four applications because they
had been analysed by related work, therefore it would
be easy to compare our findings. Moreover, we do
not know how the test cases made available by the
developers of the analysed applications were gener-
ated. Accordingly, we are not aware of the reasons
why some classes has so low code coverage and con-
sequently mutation score. It is either because the class
is too complex or because the developers created just
a few test cases for them. To mitigate this issue,
we performed analysis considering different coverage
ranges. Finally, we have not performed further statis-
tical analysis that could show results related to distri-
bution of our data.
8 CONCLUDING REMARKS
We presented an analysis of four open source systems
with respect the correlation between the CK metrics,
which are strongly related to the design of object ori-
ented systems, and the quality and the adequacy of
the test suites available, which can be an indication
of the level of testability of such systems. Similarly
to the related work, which correlated the CK metrics
with test numbers and size, we have concluded that
metrics CBO, LCOM, RFC and WMC have moderate
influence on software testability. We believe a design
with low coupling, low complexity and high cohesion
can lead to a high level of testability.
The results obtained in this study may be easily
inferred by experienced designers and developers, but
we believe it is important to quantify the influence
of those metrics on the software testability. More-
over, we believe these results, along with the related
works’, can be used to derive equations and coeffi-
cient that can estimate or predict the level of testabil-
ity of a system. For example, design patterns are con-
stantly applied in software development. Sometimes,
before applying a pattern one may need to consider
the tradeoffs between the solution and its effect on the
overall design, which usually involves increasing co-
hesion but also increasing coupling, or vice versa. Co-
efficients or equations to estimate the impact of such
decisions on the testability of a system could be very
useful since in complex systems it is very difficult to
track the impact of different design decisions made by
different developers or architects.
In this perspective, we foresee some future di-
An Empirical Analysis of the Correlation between CK Metrics, Test Coverage and Mutation Score
349

rections for this work. We intend to analyse larger
programs and consider different languages to check
whether the correlations found for Java systems hold
for other languages. Conduct experiments to consider
not only testing metrics such as coverage and mu-
tation score, but also the effort with respect to time
spent to develop the test cases. We also intend to anal-
yse each CK metric individually by clustering classes
with a subset of similar metrics values to analyse the
isolated impact of a single metric on the test results
and metrics. Finally, as software testability is affected
by many different factors, it would be interesting to
use others suite of metrics, as the metrics proposed by
Abreu (e Abreu et al., ) and Lorenz and Kidd (Loren-
zen and Kidd, 1994).
REFERENCES
Abdullah, R. S. and Khan, M. H. (2013). Testability es-
timation of object oriented design:a revisit. Inter-
national Jounal of Advanced Research in Computer
and Communication Engineering, pages 3086–3090,
numpages = 5,.
Badri, L. and Tour, F. (2011). An empirical analysis of
lack of cohesion metrics for predictiong testability of
classes. International Journal of Software Engineer-
ing and its Application.
Badri, M. and Toure, F. (2012). Empirical analysis of
object-oriented design metrics for predicting unit test-
ing. Journal of Software Engineering and Applica-
tions, pages 513–526.
Binder, R. V. (1994). Design for testability in object-
oriented systems. Commun. ACM, 37(9):87–101.
Bruntink, M. and van Deursen, A. (2004). Predicting class
testability using object-oriented metrics. Source Code
Analysis and Manipulation, 2004. Fourth IEEE Inter-
national Workshop on, pages 136–145.
Bruntink, M. and van Deursen, A. (2006). An empirical
study into class testability. J. Syst. Softw., 79(9):1219–
1232.
Chidamber, S. and Kemerer, C. (1994). A metrics suite for
object oriented design. Software Engineering, IEEE
Transactions on, 20(6):476–493.
de Castro, C. F., de Souza Oliveira Jr, D., and Eler, M. M.
(2016). Identifying characteristics of java methods
that may influence branch coverage: An exploratory
study on open source projects. In Proceedings of the
35th International Conference of the Chilean Com-
puter Science Society (SCCC 2016). IEEE.
e Abreu, F. B., (inesc/iseg, O. B. E. A., Esteves, R., Goulo,
M., and (inesc/ist, R. E. Toward the design quality
evaluation of object-oriented software. International
Conference on Software Quality.
IEEE (1990). Ieee standard glossary of software engineer-
ing terminology. IEEE Std 610.12-1990, pages 1–84.
ISO (1991). International standard ISO/IEC 9126. informa-
tion technology:Software product evaluation: Quality
characteristics and quidelines for their use. ISO.
Khalid, S., Zehra, S., and Arif, F. (2010). Analysis of object
oriented complexity and testability using object ori-
ented design metrics. In Proceedings of the 2010 Na-
tional Software Engineering Conference, NSEC ’10,
pages 4:1–4:8, New York, NY, USA. ACM.
Khan, R. A. and Mustafa, K. (2009). Metric based testabil-
ity model for object oriented design (mtmood). SIG-
SOFT Softw. Eng. Notes, 34(2):1–6.
Kout, A., Toure, F., and Badri, M. (2011). An empirical
analysis of a testability model for object-oriented pro-
grams. SIGSOFT Softw. Eng. Notes, 36(4):1–5.
Li, W. (1999). Software product metrics. Potentials, IEEE,
18(5):24–27.
Lorenzen, M. and Kidd, J. (1994). Object-oriented soft-
ware metrics : a practical guide. Prentice Hall object-
oriented series, Englewood Cliffs, NJ. PTR Prentice
Hall.
McCabe, T. J. (1976). A complexity measure. In Proceed-
ings of the 2Nd International Conference on Software
Engineering, ICSE ’76, page 407, Los Alamitos, CA,
USA. IEEE Computer Society Press.
Offutt, A. J. (1994). A practical system for mutation testing:
help for the common programmer. In Test Conference,
1994. Proceedings., International, pages 824–830.
Offutt, A. J., Pan, J., Tewary, K., and Zhang, T. (1996).
An experimental evaluation of data flow and mutation
testing. Softw. Pract. Exper., 26(2):165–176.
Sneed, H. M. (2010). Testing object-oriented software sys-
tems. In Proceedings of the 1st Workshop on Testing
Object-Oriented Systems, ETOOS ’10, pages 1:1–1:5,
New York, NY, USA. ACM.
Tahir, A., MacDonell, S. G., and Buchan, J. (2014). Under-
standing class-level testability through dynamic anal-
ysis. In Evaluation of Novel Approaches to Software
Engineering (ENASE), 2014 International Conference
on, pages 1–10.
Zhu, H., Hall, P. A. V., and May, J. H. R. (1997). Software
unit test coverage and adequacy. ACM Comput. Surv.,
29(4):366–427.
ICEIS 2017 - 19th International Conference on Enterprise Information Systems
350
