
Study of the Floodflow Dynamics in the Pantanal of Cáceres/MT
Edinéia Aparecida dos Santos Galvanin
1
, Carla Bernadete Madureira Cruz
2
, Raúl Sanchez Vicens
3
,
Murilo Henrique Xavier Pereira
4
and Sandra Mara Alves da Silva Neves
5
1
Department of Mathematics, University of State of Mato Grosso, Barra do Bugres, Brazil
2
Department of Geography, Federal University of Rio de Janeiro, Rio de Janeiro, Brazil
3
Department of Geography, Fluminense Federal University, Niterói, Brazil
4
Department of Computing, University of State of Mato Grosso, Street A, s/n, Barra do Bugres, Brazil
5
Department of Geography, University of State of Mato Grosso, Cáceres, Brazil
Keywords: Land Cover, Geotechnologies, Wetland.
Abstract: The Brazilian Constitution lists some biomes and ecosystems considered as national patrimony, among which
the Pantanal Matogrossense is inserted, legally establishing conditions that ensure the preservation of the
environment, including the use of its natural resources (Article 225, § 4). In this context, the research proposes
to analyze the dynamics of the floodflow in the Pantanal of Cáceres/MT and aims to contribute a methodology
to obtain results that can support the planning, management, and monitoring of natural resources, as well as
providing important information for agriculture, geology, hydrology, and ecological models. In this research,
images from the MODIS sensor from the year 2015, with a resolution of 250 m, were used for the application
of the methodology. The software ArcGis and Matlab were used for the image processing. The normalized
difference water index obtained through 500 m resolution MODIS images was used as a priori analysis of the
regions with water and without water, after a threshold was defined for all of the images and the processing
was done to obtain the matrix with days with water and without water in the studied area. The results obtained
provide a classification for the floodflow, the quality parameters derived using study area show that the
proposed method performed better with classes < 30 (96%) and 180 - 270 (90%) of 4% and 10% of false
positives, respectively.
1 INTRODUCTION
The Pantanal is a large wetland composed of several
types of vegetation (landscape units) that make up a
complex set of habitats with multiple functions.
These systems depend on the pulse of flood and the
interaction of these environments. Biodiversity
maintenance needs these habitats. Similarly, this
immense floodplain maintains a relationship of
interdependence with the ecosystems located around
the Pantanal, considering, in this context, the impacts
caused by human intervention in the highlands
surrounding the wetlands (Wantzen et al., 2008; Silva
and Girard, 2004).
The Pantanal of Cáceres, as a subregion of the
Mato Grosso Pantanal, corresponds to an extensive
area of accumulation with a very flat topography that
is frequently subjected to floods, whose drainage
network is controlled by the Paraguai River (Brasil,
1997).
Some studies have concluded that the floods of
area are due to the volume of water brought by the
network of tributaries of the Paraguai River, together
with the weak slope and soil type rather than the
rainfall. The Pantanal vegetation consists of a variety
of species adapted to the dynamics defined by the
flood pulses.
According to Adamoli (2005), the Pantanal is a
biome that frequently undergoes alteration in its
vegetation cover. This factor is due to the
differentiated dynamics, caused by the double
seasonality and alterations in the flood regime, which
changes the structure and floral composition, making
the humid areas more sensitive to anthropic processes
(Bove et al., 2003).
Due to this distinct characteristic, flooded areas
require monitoring to verify the change in vegetation.
Santos et al., (2009) emphasize that the most efficient
way to promote the monitoring of these areas is
through Geographic Information System (GIS) and
Galvanin, E., Cruz, C., Vicens, R., Pereira, M. and Neves, S.
Study of the Floodflow Dynamics in the Pantanal of Cáceres/MT.
DOI: 10.5220/0006309001950200
In Proceedings of the 3rd International Conference on Geographical Information Systems Theory, Applications and Management (GISTAM 2017), pages 195-200
ISBN: 978-989-758-252-3
Copyright © 2017 by SCITEPRESS – Science and Technology Publications, Lda. All rights reserved
195
geoprocessing that makes it possible to have precise
evaluations, aiding in the analysis of the spatio-
temporal modifications. Due to the synoptic view,
mapping and repetitive coverage through remote
sensing images is a viable source of information at
regional and global scales (Csaplovics, 1998; Foody,
2002).
In this context, high-spatial revisits with a
moderate resolution image spectroradiometer
(MODIS) have been used to monitor land use/land
(LULC) cover, predict global changes, and to assist
in the protection of our environment. In Song et al.
(2011), an approach is proposed for the mapping of
LULC in the Amur river basin using MODIS at 250m
resolution, the normalized difference vegetation
index (NDVI), land surface vegetation index (LSWI),
and the reflectance time series data for 2001 and
2007.
Almeida et al. (2015) analyzed the spatio-
temporal variability of the Pantanal vegetation
cover by a principal component analysis applied to
a complete annual dataset of filtered EVI2 images.
PCA-based approach was able to capture the
essentials of the phenological/environmental
variability.
Gu et al. (2008) evaluated the relationship
between satellite derived vegetation indices
(normalized difference vegetation index–NDVI and
normalized difference water index–NDWI) and soil
moisture to understand how these indices respond to
soil moisture fluctuations.
The most relevant aspect of this work is the
exploration of methodologies to identify the
floodflow dynamics in the Pantanal of Cáceres, which
were formulated based on the analysis of the images
of the annual time series of the MODIS system with
250 m resolution and the normalized difference water
index (NDWI) of MODIS at 500 m resolution.
The scientific and technological relevance of the
theme, in the context of the development of new
methodologies for the efficient capture of
cartographic information, is evidenced by the
importance given to the theme by the International
Society for Photogrammetry and Remote Sensing
(ISPRS), where one of the terms of reference is the
remote sensing of land use and coverage.
This paper is organized into four sections: the next
section presents the proposed methodolgy, followed
by the experimental results, discussion, and the main
conclusions. Future prospectives are described in the
last section.
2 MATERIALS AND METHODS
2.1 Study Area
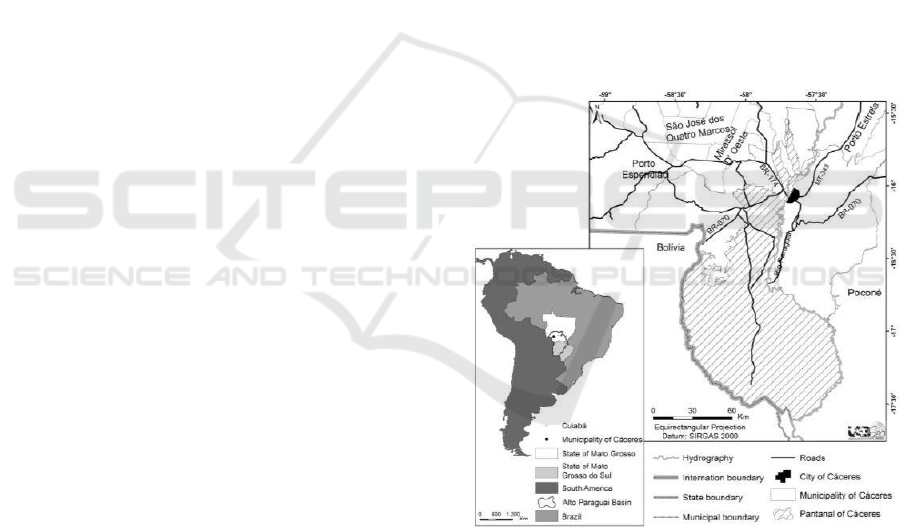
The Pantanal of Cáceres is one of the subregions of
the Mato Grosso Pantanal, which corresponds to
approximately 9.01% of its territorial area (Silva and
Abdon, 1998) and occupying 50.87% of the territorial
area of the municipality of Cáceres, located in Mato
Grosso. It is located in the upper Paraguai Basin
(BAP) in the southwest region of the state of Mato
Grosso (Figure 1).
It lies between the Paraguai river and the
municipality of Corumbá/MS (north–south) and
borders the Republic of Bolivia and the Poconé
Pantanal (east–west) at the geographic coordinates
15°31’15’’ and 17°37’45’’ South latitude and
58°32’30’’ and 57°21’55’’ West Longitude. The
Cáceres Pantanal area is 12,412.56 km
2
, where
12,371 km
2
(99.66%) are located within the
municipality of Cáceres (Neves, 2008).
Figure 1: Location map of Pantanal of Cáceres, Mato
Grosso, Brazil.
The study area represents an extensive flooded
environment, described as an ancient sandy alluvial
plain (Ab'Saber, 2006) with phyto-physiognomic
aspects composed of different vegetal types such as:
wooded savanna, forest savanna, and grass savanna
(IBGE, 2012).
The annual average temperature is 22.6°C (Brasil,
2007). It presents a rainfall index of 1200 to 1500 mm
GISTAM 2017 - 3rd International Conference on Geographical Information Systems Theory, Applications and Management
196
annually (Neves et al., 2011) with an altitude varying
between 90 and 200 meters (Radambrasil, 1982).
The soil of the region presents low fertility,
mainly composed by Plintossolo (PL), Plantossolo
(PT), and quartz sands (Quartzarenic Neosol), with
the influence of hydromorphic processes (Fernandes
et al., 2007; Embrapa, 2006).
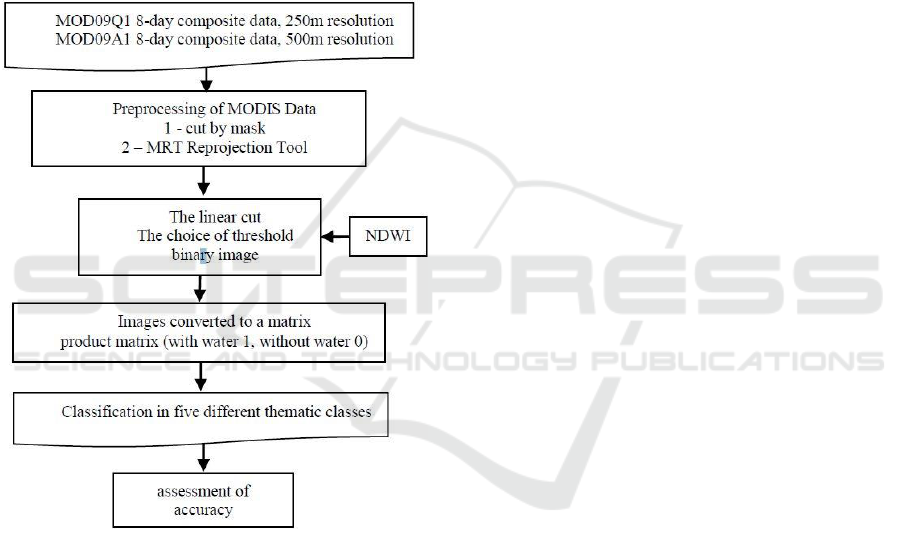
2.2 Methodology
In this paper, we propose an analyze of the dynamics
of the floodflow in the Pantanal of Cáceres/MT.
Methodological steps are explained in detail in the
Figure 2.
Figure 2: Flowchart of methodology.
In the first stage of the methodology, 46 MODIS
product Q1 images were selected with a spatial
resolution of 250 m on the Terra platform, available
in the EOS Data Gateway (NASA, 2007) portal, in an
8-day composition, referring to the months of January
to December 2015.
The choice of the 8-day composition in this work
is due to the reduction of the number of images with
clouds and the effects of bidirectional reflectance and
atmosphere reflectance (Martinez et al., 2009; Villar
et al., 2012).
In this stage, the study area was cut by mask of the
area using the shapefile extension. The linear cut with
one standard deviation was used as a parameter for
the choice of threshold. The thresholds were chosen
in the software ArcGis, version 9.2 (ESRI, 2007).
The NDWI images of the MODIS product A1
with a spatial resolution of 500 m from the months of
January and July of 2015 was used to subsidize the
choice of threshold. The NDWI was calculated
according to Gao (1995).
Larger thresholds were tested, however, they
eventually underestimated the delimitation of the
areas with water, causing the grouping of areas with
differentiated responses. The use of one standard
deviation was an empirical choice but provided a
plausible result for determining the threshold to be
used in all study images.
It is worth noting that the months of the dry season
are May–October, with July being the month with the
lowest total rainfall. The months of the rainy season
are November–April, when 76% of the annual total
rainfall occurs, with January being the wettest month.
The resulting image was classified in a binary
image (with water values being 1 and not water being
0) and exported to Matlab software.
In the second step of the methodology, the images
were imported into the Matlab software, in which all
images were converted to a matrix, and to performed
the sum of the values of the pixels with water (value
of 1) and without water (value of 0) and the after the
product matrix was generated, resulting from the
matrix sum multiplied by the composition of the
MODIS images (8 days).
This gave a matrix with values of days with water
varying from 0 (not one day with water) to 365 (every
day with water). At the end of the compilation process
in the Matlab software, the georeferenced product
image and a classification of the days with water in
the study area were imported into ArcgGis.
For the classification, five different thematic
classes were defined, including the days with water:
<30 (nonflooded or rarely flooded––automatic
landscapes), 30–90 (occasionally flooded), 90–180
(seasonally flooded), 180–270 (frequently flooded),
>270 (permanently flooded–hydromorphic
landscapes).
Visits were made to the study area during the dry
period, in November 2015, to record photographs of
the existing landscapes in the region (attached in
Figure 1) and collect land control points (PCTs) to
subsidize the classification of satellite images.
After the classification process an assessment of
accuracy was performed using the Khat statistic to
check the reliability of the map generated (Congalton
(1991). The producer's accuracy refers to the total
number of correct pixels in a class divided by the total
number of pixels of that class as derived from the
Study of the Floodflow Dynamics in the Pantanal of Cáceres/MT
197
reference data (i.e., the column total). The user's
accuracy is the total number of correct pixels in a
class divided by the total number of pixels that were
classified in that class (i.e., the row total).
For the generation of the confusion matrix, the
classification generated in ArcGIS were converted to
the feature class, through the Raster to Polygon tool.
In the ArcGIS, 150 (hundred and fifty) points
were created randomly, distributed in the each class.
In the ArcMap application, the Esri Image Service
(World Imagery) was used for point validation.
3 RESULTS
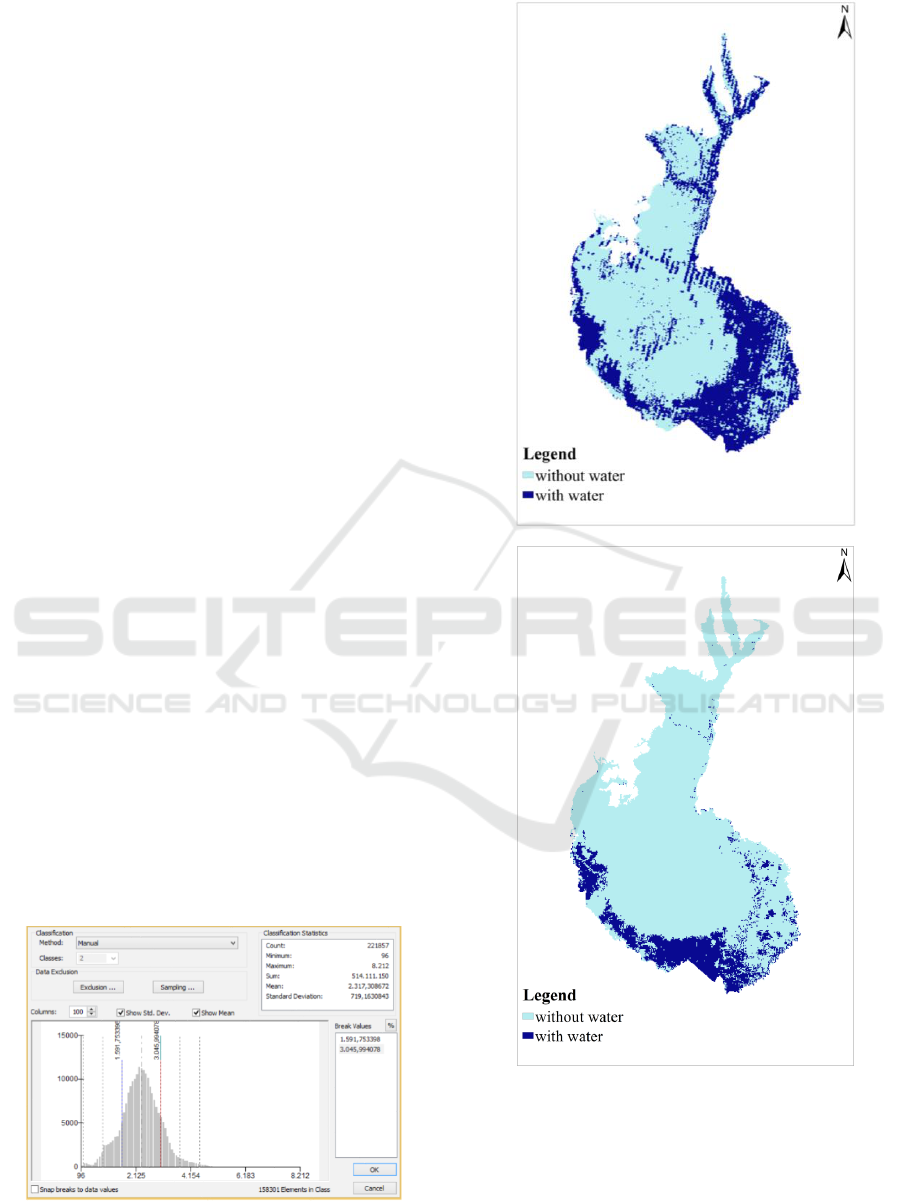
In order to aid in the detection of variations in water
availability in the environment, the NDWI was used
(Figure 3) which, according to Gao (1995), is more
sensitive to variations because the values of
reflectances corresponding to the average infrared
region are used.
However, with a resolution of 500 m, this product
was used to subsidize the choice of a linear cut
threshold for the histogram of the MODIS images at
250 m, considering that the study was carried out on
a regional scale.
The NDWI of the months with the highest
(January) and lowest (July) total rainfall was analyzed
and verified by the histograms that in the month of
July (driest period), a greater distribution of the
values occurs. In the month of January (the rainy
season) it is possible to verify a higher concentration
of the values. The same behavior can be verified in
MODIS images at 250 m. This analysis assisted in the
final classification of the floodflow dynamics.
Figures (4) and (5) show the frequency histograms
of the MODIS images at 250 m from January and
July, respectively, and the linear cut with the
threshold of a standard deviation.
Figure 4: Image histogram of January 2015.
A
B
Figure 3: NDWI images. A) NDWI image of January 2015
and; B) NDWI image of July 2015.
GISTAM 2017 - 3rd International Conference on Geographical Information Systems Theory, Applications and Management
198
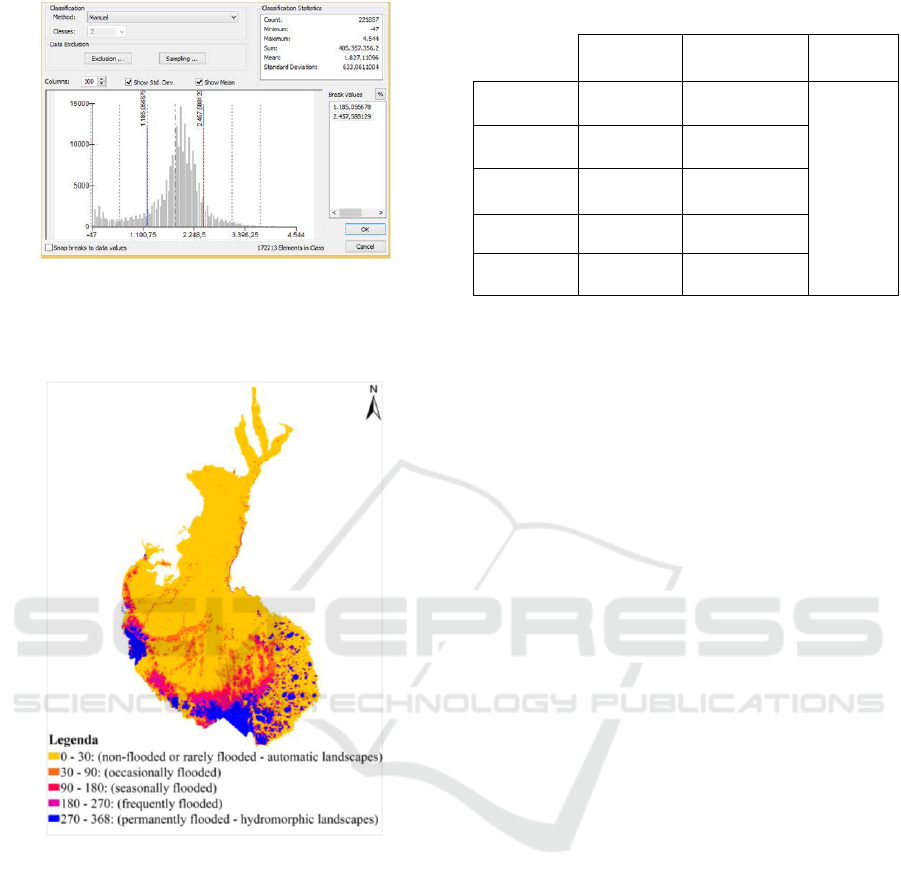
Figure 5: Image histogram of July 2015.
The classes that represent the floodflow in the
Pantanal of Cáceres / MT are presented in figure 6.
Figure 6: Classification of the floodflow in the Pantanal of
Cáceres / MT.
Table 1 shows the results of the quality parameters
obtained for the five thematic classes. Four main
columns are shown in Table 1: column 1 identifies the
thematic classes; column 2 shows the user’s accuracy
(number of false positives); column 3 shows the
producer’s accuracy (number of false negatives); and
column 4 shows the KHAT accuracy is a KHAT
statistic (an estimate of KAPPA).
The quality parameters derived using study area
show that the proposed method performed better with
classes < 30 (96%) and 180 - 270 (90%) of 4% and
10% of false positives, respectively. In the class of 30
- 90 was obtained (30% of false positives). Because
this area is occasionally flooded and this fact difficult
the classification.
Table 1: Quality parameters.
User’s
accuracy (%)
Producer’s
accuracy (%)
Khat
accuracy
< 30
96
80
0,82
30 - 90
70
87
90 - 180
86
78
180 - 270
90
87
> 270
83
96
In the table 1, class > 270 present 4% of false
negatives and class 90 – 180 presented 22% of false
negatives. Less than ideal results, in terms of false
negatives. In conclusion, the method performance for
this experiment can be considered satisfactory.
The result obtained in this work is essential for the
monitoring of the impacts caused by excess or lack of
water, as well as the definition of the environments of
the Pantanal of Cáceres.
4 CONCLUSIONS
The results generated in this work showed the areas
with and without water and resulted in defining the
thematic classes of the floodflow of the Pantanal of
Cáceres / MT, Brazil. For that, a methodology was
developed using an annual time series of images of
the MODIS Q1 and A1 sensor for the year 2015.
Results from this study indicate that the floodflow
can be mapped into thematic classes, according to
five flood distinctions.
To evaluate the proposed method, the analysis
were conducted involving sample of classified
classes. In general, the method showed a satisfactory
performance, few false positives occurred and few
false negatives were verified.
The main challenge of this work was to obtain a
single threshold for the entire series of images from
the year 2015.
As future work will be performed, some statistical
analyses will be performed to evaluate the results
obtained by the temporal profile of the floodflow.
ACKNOWLEDGEMENTS
The authors would like to thank the project
“Temporal analysis of land use to define scenarios of
natural landscape change by human interventions in
Study of the Floodflow Dynamics in the Pantanal of Cáceres/MT
199

the Pantanal of Cáceres / MT” financed by
FAPEMAT.
REFERENCES
Ab’Saber, A. N. Brasil, Paisagens de Exceção: o litoral e
o Pantanal Mato-Grossense: patrimônio básico.
Editora Ateliê. Cotia S.P., p.57-59, 2006.
Adamoli, J. Zoneamento ecológico do Pantanal baseado no
regime de inundações. In: Encontro Sobre
Sensoriamento Remoto Aplicado a Estudos no
Pantanal, 1., 1995, Corumbá. Anais. São José dos
Campos: Inpe, p.15-17, 2005.
Almeida, T. I. R.; Penatti, N. C.; Ferreira, L. G.; Arantes,
A. E.; Amaral, C. H. Principal component analysis
applied to a time series of MODIS images: the spatio-
temporal variability of the Pantanal wetland, Brazil.
Wetlands Ecology Management, vol. 23, p. 737-748.
2015.
Bove, C. P.; Gil, A. S. B.; Moreira, C. B.; Anjos, R. F. B.
Hidrófitas fanerogâmicas de ecossistemas aquáticos
temporários da planície costeira do Estado do Rio de
Janeiro, Brasil. Acta Bot. Bras., v.17, n.1, p. 119-135,
2003.
BRASIL. Ministério do Meio Ambiente. Biomas. Pantanal:
Fauna e Flora. 2007. Disponível em:<
http://www.mma.gov.br/biomas/pantanal#footer>.
Acesso em: jan. 2015.
BRASIL. Ministérios do Meio Ambiente, dos Recursos
Hidricos e da Amazônia Legal. Plano de Conservação
da Bacia do Alto Paraguai (Pantanal) – PCBAP.
Diagnóstico dos meios físicos e bióticos: meio biótico.
Brasília, DF: MMA, v. 2, t. 3. p. 3-68, 1997.
Congalton, R. G. A review of assessing the accuracy of
classifications of remotely sensed data. Remote Sensing
of Environment. n. 37, 35-46, 1991.
Csaplovics, E. High Resolution space imagery for regional
environmental monitoring — status quo and future
trends. International Archives of Photogrammetry and
Remote Sensing, 32(7), 211-216, 1998.
EMBRAPA. Centro Nacional de Pesquisa de Solos (Rio de
Janeiro, RJ). Sistema Brasileiro de Classificação de
solos. 2. ed. – Rio de Janeiro : EMBRAPA-SPI, 2006.
ESRI. ArcGIS Desktop: release 9.2. Redlands, CA:
Environmental Systems Research Institute, 2007.
Fernandes, F. A.; Fernandes, A. H. B. M.; Soares, M. T. S;
Pellegrin, L. A.; Lima, I. B. T. de. Atualização do mapa
de solos da planície pantaneira para o Sistema
Brasileiro de Classificação de Solos. Corumbá:
Embrapa Pantanal, 2007.
Foody, G. M. Status of Land Cover Classification Accuracy
Assessment, Remote Sensing of Environment, 80, 185-
201, 2002.
Gao, B.C. A normalized difference water index for remote
sensing of vegetation liquid water from space, in SPIE's
1995 Symposium on OE / Aerospace Sensing and Dual
Use Photonics, Vol. 2480, Orlando, FL, 1995.
Gu, Y.; Hunt E.; Wardlow, B.; Basara, J.; Brown, J. F.;
Verdin, J. P. Evaluation of MODIS NDVI and NDWI
for vegetation drought monitoring using Oklahoma
Mesonet soil moisture data. Geophysical Research
Letters, vol. 35, p. 1-5, 2008.
IBGE- Instituto Brasileiro de Geografia e Estatística.
Manual Técnico da Vegetação Brasileira. Ed. 2. 2012.
Martinez, J. M.; Guyot, J. L., Filizola, N., Sondag, F.
Increase in suspended sediment discharge of the
Amazon River assessed by monitoring network and
satellite data. Catena, v.79. p.257-264. 2009.
NASA. National Aeronautics and Space Administration.
Earth observing system data gateway. Disponível em:
<http:// edcimswww.cr.usgs.gov/pub/imswelcome/>.
Acesso em: 15 out. 2007.
Neves, S. M. A. S.; Cruz, C. B. M.; Neves, R. J.
Operacionalização de propostas de Zoneamento
Turistico do Pantanal de Cáceres/MT, com suporte nas
geotecnologias. Ciência Geográfica, v. 18, n., p. 76-86,
2008.
Neves, S. M. A. S.; Nunes, M. C. M.; Neves, R. J.
Caracterização das condições climáticas de
Cáceres/MT Brasil, no período de 1971 a 2009:
subsídios às atividades agropecuárias e turísticas
municipais. Boletim Goiano de Geografia, v. 31, n. 2,
p. 55-68, 2011.
Radam-Brasil. Projeto RADAMBRASIL: Levantamento de
Recursos Naturais Vol. 27 - Corumbá. Rio de Janeiro:
Ministério das Minas e Energia, 1982.
Santos, J. S.; Pereira, G.; Shimabukuru, Y. E.; Rudorff,
B. F. T. Identificação de áreas alagadas no Bioma
Pantanal - Brasil -utilizando dados multitemporais
TERRA/MODIS. GEOGRAFIA, Rio Claro, v. 34,
Número Especial, p. 745-755, dez., 2009.
Silva, J.S.V.; Abdon, M.M.; Delimitação do Pantanal
brasileiro e suas sub-regiões. Pesquisa Agropecuária
Brasileira, Brasília, v.33, Número Especial, p.1703-
1711, out.,1998.
Silva, C.J.; Girard. P New challenges in the management of
the Brazilian Pantanal and catchment area. Wetlands
Ecology and Management, 12: 553-561, 2004.
Song, K.; Wang, Z.; Liu, Q.; Liu, D.; Ermoshin, V. V.;
Ganzei, S. S.; Zhang, B.; Ren, C.; Zeng, L.; Du, J. Land
use/land cover (LULC) classification with MODIS time
series data and validation in the Amur River Basin.
Geography and Natural Resources, Vol. 32, Issue 1, p.
9–15, 2011.
Villar, R. E.; Martinez, J. M.; Guyot, J. L.; Fraizy, P.;
Armijos, E.; Crave, A.; Bazán, H.; Vauchel, P.; Lavado,
W. The integration of field measurements and satellite
observations to determine river solid loads in poorly
monitored basins. Journal of Hydrology, v.44, p.45-54.
2012.
Wantzen, K. M.; Cunha, C. N.; Junk, W. J.; Girard, P.;
Rossetto, O. C.; Penha, J. M.; Couto, E. G.; Becker, M.;
Priante, G.; Tomas, W. M.; Santos, S. A.; Marta, J.;
Domingos, I.; Sonoda, F.; Curvo, M.; Callil, C. T.
Towards a sustainable management concept for
ecosystem services of the Pantanal wetland.
Ecohydrology & Hydrobiology, 8: P. 115-138, 2008.
GISTAM 2017 - 3rd International Conference on Geographical Information Systems Theory, Applications and Management
200
