
Comparative Analysis of Web Platform Assessment Tools
Solange Paz
1
and Jorge Bernardino
1,2
1
Polytechnic of Coimbra, ISEC, Rua Pedro Nunes, Quinta da Nora, 3030-190 Coimbra, Portugal
2
Centre of Informatics and Systems of University of Coimbra, Pinhal de Marrocos, 3030-290 Coimbra, Portugal
Keywords: Web Assessment Tools, Load Testing, Performance Tests.
Abstract: Search engines are used daily anywhere in the world. Although they regularly use updated indexes to run
quickly and efficiently, they sometimes fail to keep the user on their page for a long time. As such, it is
important that their response time is the lowest possible Therefore, it is essential to understand what load is
supported by each search engine by conducting load testing. These tests have the objective of optimizing the
performance of the application being tested, thus verifying the maximum amount of data that is processed.
In this paper we conduct a comparative analysis of the four most popular web platform assessment tools,
Apache JMeter, Apache Flood, The Grinder and Gatling, and elect the best. In the experimental evaluation
the search engines used are: Google, Bing, Ask and Aol Search.
1 INTRODUCTION
People around the world access search engines
frequently to obtain links relating to the information
they are looking for. The speed in returning a
response to the user is very important, because
although there are almost imperceptible differences
in response time, users are aware of these faults and
are dissatisfied. In the event of a high response time
from a search engine, users tend to abandon their
search. On the other hand, a faster search engine
creates a better usability experience for the user. For
this reason, it is important that the response time of a
search engine is the lowest possible. To understand
the maximum load supported by a search engine it is
necessary to conduct performance tests, which focus
exclusively on efficiency and reliability. Thus, the
performance test evaluates the behaviour of an
application when it is submitted to a workload, that
is, when it has several users interacting
simultaneously with the application. The results of
these tests reveal application sites where resources
are being wasted or used inefficiently.
The development process of software includes a
variety of activities where the probability of
occurring errors is enormous. Therefore, software
testing is critical to ensure the quality of product
functionality, and as a final revision of its
specification, design and code.
When performing tests during software
development value is added to the product, as a test
conducted correctly uncovers bugs that must be
corrected before release to improve quality and
reliability of a system.
Despite the great importance of these tests,
sometimes they aren’t executed as testing is a costly
activity within development.
Depending on what system is being developed
testing can be responsible for more than 50% of the
costs (Pressman, 2006).
Load tests are normally performed to identify the
behaviour of a system subjected to a specific
expected load, which can be a number of
simultaneous expected users, the number of
transactions per hour or a number of transactions
made on system currently in test. These type of tests
are ideal to verify if the application, server or data
base being tested remains stable during its usual
workload. Load tests help to identify the maximum
capacity of an application as well as any
impediments that can interfere with its operation in
terms of capacity.
There are a variety of testing tools in the market
with different features and functionalities. The main
purpose of all these tools is to simulate users
accessing a particular application and later record
the response time of the same, providing in most
cases several formats of visualization of the response
time. In this work we compare four of the most
popular tools (Tikhanski, 2015): Apache JMeter;
Apache Flood; The Grinder and Gatling. The tools
are compared in terms of functionality, usability and
performance. This comparison helps the selection of
116
Paz, S. and Bernardino, J.
Comparative Analysis of Web Platform Assessment Tools.
DOI: 10.5220/0006308101160125
In Proceedings of the 13th International Conference on Web Information Systems and Technologies (WEBIST 2017), pages 116-125
ISBN: 978-989-758-246-2
Copyright © 2017 by SCITEPRESS – Science and Technology Publications, Lda. All rights reserved

the best tool and it promotes the use of software
testing tools.
Nowadays the content of a website is important
as well as the speed at which it responds. Companies
focus on improving the capability of a website’s
response to avoid losing users. To conduct a realistic
evaluation of the tools, four search engines are tested
in terms of performance: Google; Bing; Ask and Aol
Search.
This paper is structured as follows. Section 2
presents a literature revision and section 3 describes
the various types of performance testing. Section 4
describes the four testing tools, section 5 the
qualitative and quantitative analysis of these tools.
Section 6 presents the performance tests performed
on each search engine. Lastly, section 7 states the
conclusion of this work and proposes some future
work.
2 RELATED WORK
Web applications are ubiquitous and need to deal
with a large number of users. Due to their exposure
to end users, especially customers, web applications
have to be fast and reliable, as well as up-to-date.
However, delays during the usage of the Internet are
common and have been the focus of interest in
different studies (Barford and Crovella, 1999),
(Curran and Duffy, 2005).
Load testing is thus an important practice for
making sure a web site meets those demands and for
optimizing its different components (Banga and
Druschel, 1999).
The goal of a load test is to uncover functional
and performance problems under load. Functional
problems are often bugs which do not surface during
the functional testing process. Deadlocks and
memory management bugs are examples of
functional problems under load. Performance
problems often refer to performance issues like high
response time or low throughput under load.
The first conference about testing software was
organized in 1972, at Chapel Hill, where the
presented works at the conference defended that
performing tests is not the same as programming
(Sharma and Angmo, 2014).
Existing load testing research focuses on the
automatic generation of load test suites (Avritzer and
Larson, 1993), (Avritzer and Weyuker, 1994),
(Avritzer and Weyuker, 1995), (Bayan and
Cangussu, 2006), (Garousi et al., 2006), (Zhang and
Cheung 2002).
There is limited work, which proposes the
systematic analysis of the results of a load test to
uncover potential problems. Unfortunately, looking
for problems in a load test is a timeconsuming and
difficult task. The work Jiang et al., (2008) flags
possible functional problems by mining the
execution logs of a load test to uncover dominant
execution patterns and to automatically flag
functional deviations from this pattern within a test.
In Jiang (2010) the authors introduce an
approach that automatically flags possible
performance problems in a load test. They cannot
derive the dominant performance behavior from just
one load test, since the load is not constant. A
typical workload usually consists of periods
simulating peak usage and periods simulating off-
hours usage. The same workload is usually applied
across load tests, so that the results of prior load tests
are used as an informal baseline and compared
against the current run. If the current run has
scenarios which follow a different response time
distribution than the baseline, this run is probably
troublesome and worth investigating.
Wang and Du (2012) introduced a new
integrated automation structure by Selenium and
Jmeter. This structure shares the test data and steps,
which is usefull for switching in severall kinds of
tests for web applications. With the use of this
software structure one can improve extensibility and
reuse of the tests, as well as the product quality. The
document describes how to design the tests
automation based in web details.
Wang et al., (2010) proposed a usage and load
model to simulate user behaviors and help generate a
realistic load to the web application load test,
respectively. They implemented a tool know as “
Load Testing Automation Framework” for web
apllications load test. The tool is based in the two
models mentioned above.
There are not many scientific articles dedicated
to the comparison of evaluation tools of web
platforms. However, Sharma et al., (2007) used four
testing tools: Apache JMeter, HP LoadRunner,
WebLOAD and The Grinder, with the objective of
comparing these tools and identify which one is the
most efficient. In the comparison were used
parameters such as cost, the unlimited load generator
and the ease of use. After comparing the tools, the
selected one was jMeter, since it’s free, has a huge
ability to simulate load and its interface is easy to
use.
Hussain et al., (2013) describes three open
source tools (jMeter, soapUI e storm) and compares
them in terms of functionalities, usability,
performance and software requirements. Concludes
Comparative Analysis of Web Platform Assessment Tools
117

in his study that jMeter is the tool that takes longer
to respond to the tests, compared to the other two tools.
Khan (2013) compares the Apache jMeter and
HP LoadRunner tools in terms of performance and
concludes that the best one is Apache jMeter.
Selecting this tool as the best derived from the ease
of installation and ease of learning how to use.
Unlike previous papers, besides a comparison
between four web platforms evaluation tools:
Apache jMeter, Apache Flood, The Grinder and
Gatling, in our work it is also performed an
evaluation of four search engines: Google, Bing,
Ask and Aol search relatively to its performance.
3 PERFORMANCE TESTING
TYPES
Performance tests are important to analyze and
monitor the performance of web applications. The
performance test is accomplished to verify the
response time of an application, thus determining its
scalability and reliability taking into account a load.
This is also used to identify the critical bottleneck of
a system, or gather other information as the
hardware needed for the operation of the application.
Before going to market, the software system
must be tested against speed, stability and scalability
under a variety of load conditions. If the system is to
be sold without performance testing, it can cause
problems as the system slows down when it is
accessed by multiple users simultaneously, which
affects the expected sales goal directly.
There are several performance tests used to
measure the performance of a system when it is
subjected to a certain workload. Table 1 describes
the types of performance tests.
Table 1: Performance testing types.
TYPE DESCRIPTION
Load
testing
Load testing refers to placing a load on the
system and analyze its performance.
Stress
testing
Stress testing refers to a large number of
inputs and big system queries.
Volume
testing
Refers to testing with a certain amount of
load.
Endurance
testing
Refers to placing a load on a system over a
certain time period and check its
performance.
Spike
testing
Refers to the use of a sudden increase of load
and analyze if the system behavior degrades
or cope with the load changes
Scalability
testing
Refers to the system capacity working under
the expected load.
According to the information in Table 1,
performance tests are divided in six types: Load
testing; Stress testing; Volume testing; Endurance
testing; Spike testing e Scalability testing. All these
kind of test aim at evaluating the performance of a
certain system to test. For that end, loads are applied
in the system in different ways.
4 EVALUATED TOOLS
There are several tools available on the market,
some of them free, while others are paid. From all
the existing tools, four were selected which are
considered most popular and for it ability to measure
web applications performance and its proficiency
after a load test. In this article we will evaluate the
following tools:
1. Apache JMeter (http://jmeter.apache.org/)
2. Apache Flood
(https://httpd.apache.org/test/flood/)
3. The Grinder (http://grinder.sourceforge.net/)
4. Gatling (http://gatling.io/)
To understand which tool satisfies our needs,
additional detailed information is required about
each tool. To synthesize that information, a
comparative study was carried out between the four
tools. For the accomplishment of this study was
necessary to evaluate the provided functionalities by
the tools, its documentation and existing usage
examples. It was also necessary to install each tool
to ensure knowledge of its operation details.
Throughout the next sections, four testing tools will
be presented: Apache jMeter, Apache Flood, The
Grinder and Gatling.
4.1 Apache jMeter
Apache jMeter (Apache jMeter, n.d.) was designed
to load test functional behavior, that is, to correctly
simulate users and measure the applications
performance that will be tested. It can be used to test
performance both in static resources as in dynamic
resources (files, databases, server), to simulate a
heavy server/group load, testing its resistance, or
analyzing the overall performance under different
kinds of load.
This tool simulates software usage by virtual
users and simulates the same users accessing the
web system simultaneously, generating data to
delimit how many users manages to withstand
before being cast away by its users. That is, Apache
jMeter then tests whether the expected number of
WEBIST 2017 - 13th International Conference on Web Information Systems and Technologies
118
users will be met within the timeframe described in
the software requirements. Like this, the search for
bugs is simplified and its possible to determine the
performance cost.
For the fulfillment of tests, Apache jMeter
provides several kinds of requests and assertions,
which authenticate the result of said requests,
besides that it also possess logic controllers, such as
cycles, and additional controllers to be used in the
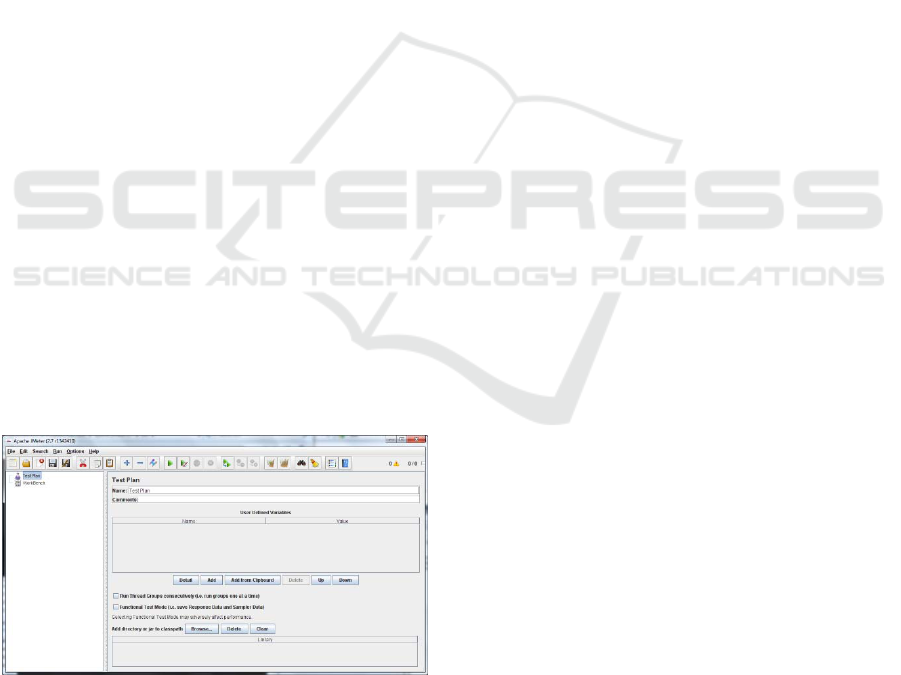
construction of test plans. In Figure 1 it is possible
to visualize the home page of a testing plan in
Apache jMeter, where only the name of the test is
being given. Thread controls (virtual users) are also
made available by this tool, designated as thread
group, where it’s possible to set the number of
threads, the amount of times each thread is executed
and the timeframe between each execution, all this
assists in conducting stress tests. In the end, several
listeners exist (tree, tables, graphs and log file), that
based in the request results or in the assertions, that
can be used to generate graphs or tables.
Apache jMeter initially works with the user
sending a request to the destination server. Apache
jMeter then receives the useful information from the
destination server and provides the user with the
results in different formats, such as graphs and
tables.
The main features of Apache jMeter are:
Can be run on any operating system, since it is
an application developed in JAVA;
Supports HTTP, SMTP, POP3, LDAP, JDBC,
FTP, JMS, SOAP and TCP protocols;
Has multiple built-in and external listeners to
view and analyze performance test results;
Integration with major configurations and
continuous integration systems is possible.
Figure 1: Test plan in Apache jMeter.
In summary, Apache jMeter is a tool that behaves
completely in performing tests, since it supports
static and dynamic resources, as well as several
protocols from HTTP to TCP. It can even be used by
any machine since it can run on any operating
system. The fact of supporting distributed testing
facilitates the simulation of a larger load, since each
test runs on different machines.
4.2 Apache Flood
Apache Flood (Apache Flood, n.d.) can be used to
collect performance metrics that are important for a
given website, such as the time to submit an order or
the time to receive a complete response.
It has a modular architecture where you can
easily add new resources, designing frameworks
through a support library and defining actions and
behaviors for them. It is capable of generating large
amounts of web traffic and of working well with
dynamic content, being possible to simulate
multiple, different and complex users, since a user
can make a request to a more complete web page.
In Figure 2, test example in Apache Flood is
shown.
All tests are called with a standard interface and
at the end transaction reports are collected with
statistics of each HTTP transaction about the latency
time, response time, idle time, and TCP Handshake
time.
With Apache Flood it is possible to run several
tests in parallel and two options are provided for this
execution: Threaded and Forked. These two methods
can be used simultaneously, allowing to maximize
the performance of each test. In threaded execution,
the process is instructed to perform several user-
space threads, each of which will execute a chain of
complex events. When a Forked run is performed,
the process is instructed to make multiple copies of
itself using the fork() command.
Flood makes it possible to perform distributed
tests through access to several remote machines. It’s
possible to invoke a remote instance with both RSH
and SSH.
The main features of Flood are:
Works with a global standard in security
technology (SSL);
Has an XML-based configuration;
Simulator of users and multiple users
simultaneously;
Simulator of several different users, that is, each
with different arrival times.
Overall, Apache Flood is a little complex tool,
since its configuration is only based on XML and
works only with SSL. Besides that, it has little
documentation, which makes it difficult to use.
Comparative Analysis of Web Platform Assessment Tools
119
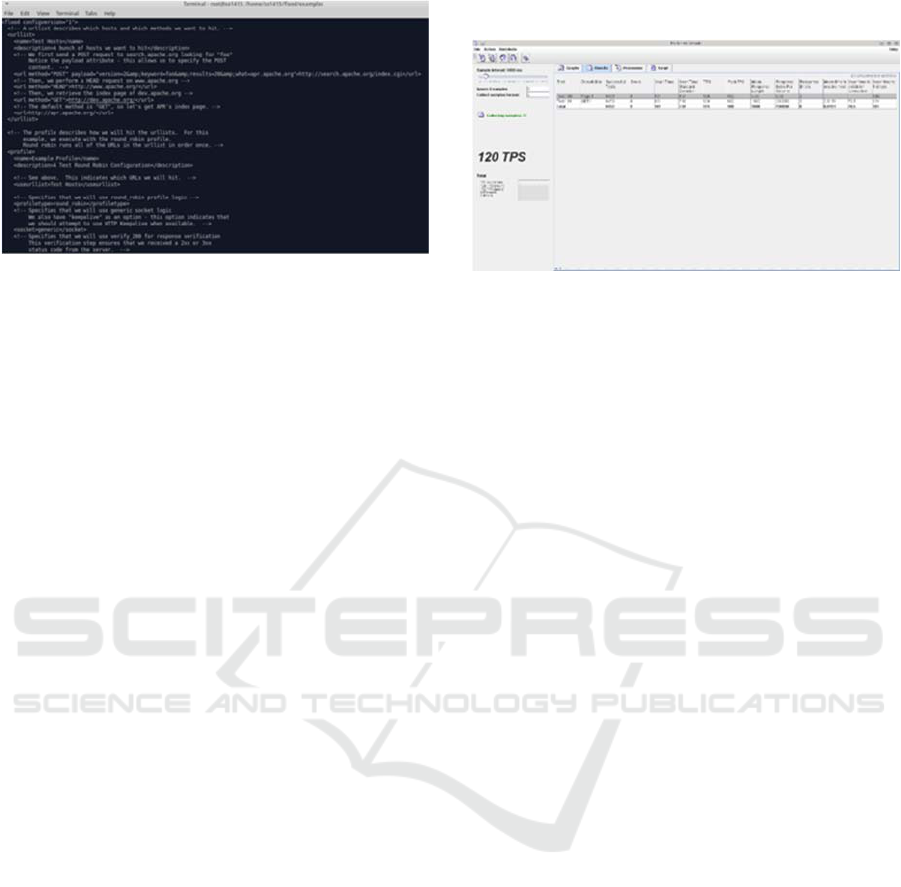
Figure 2: Test Plan at Apache Flood.
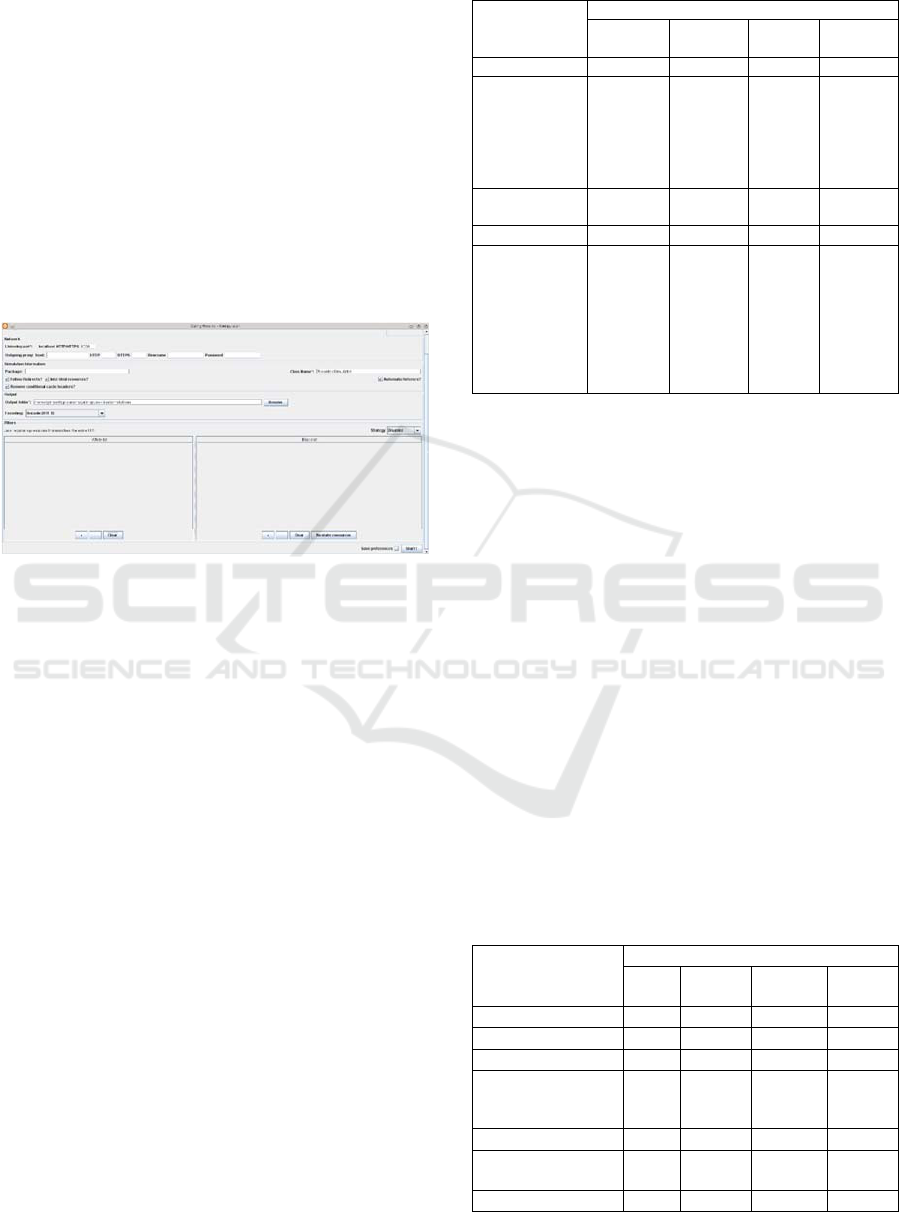
4.3 The Grinder
The Grinder (The Grinder, a Java Load Testing
Framework, n.d.) is a load testing platform,
developed in JAVA, that makes it easy to run a
distributed test. That is, it is possible to
simultaneously use several machines to perform
parallel tests, controlling all execution from a main
machine, where we can generate various analyzes of
the generated data, with tables and graphs. Each load
to be monitored and controlled is visualized through
a graphic console, as shown in Figure 3. It allows to
see how the application behaves under a heavy load,
subsequently determining all weaknesses of the
application in order to optimize them. The Grinder
comes with a plugin for HTTP testing services as
well as a tool that allows HTTP scripts to be
automatically recorded.
The Grinder consists of agents, which initiate the
number of load processes equal to the number
configured by the user; by workers, who execute the
load test scripts; by a console that is the graphical
interface used to control the agents and to display
the statistics collected by the workers and by
TCPProxy that interposes between the browser and
the destination server and can be used to create
scripts by registering the activity of the browser,
which can later be executed by work processes.
The Grinder's main features are:
Uses a TCP proxy to record network activity in
the test script;
It is possible to perform distributed tests that
adapt with the increase of the number of users;
Using Python or Closure with any Java API
allows creation or modification of better test
scripts;
Post-processing with full access to the results of
the correlation and content verification tests;
Supports multiple protocols: SOAP, XML-RPC,
IIOP, RMI / IIOP, RMI / JRMP, JMS, POP3,
SMTP, FTP and LDAP.
Figure 3: Test Plan at The Grinder.
Briefly, The Grinder is a tool that supports several
protocols, from SOAP to LDAP. This allows the
exchange of structured information on a
decentralized and distributed platform to be carried
out in several ways, some faster and more efficient
than others. Besides, it’s highlighted in its reports
that allow an easy analysis of the test results, since
they can be presented from tables to graphs.
4.4 Gatling
Gatling (Gatling Project, Stress Tool, n.d.) was
designed to be used with load testing, analyzing and
measuring the performance of a variety of services,
focusing on web applications, defending ease of use,
maintenance and high performance. Gatling is
written in Scala that comes with an interesting
premise of always treating our performance tests as
production code, meaning we can write code directly
in the application. It is a very useful tool when we
want to simulate a large number of users, since they
do not all arrive at the same time and Gatling has an
option (ramp) to implement this behavior, where the
ramp value indicates the duration during which the
users are started linearly, that is, they are always
started for a fixed number of seconds. It also allows
to simulate various types of users and even all these
users using the application simultaneously. A test
plane in Gatling is shown in Figure 4.
Basically the Gatling structure can be defined in
four different parts: configuration of the HTTP
protocol, where it is possible to define the base url to
be tested; definition of headers, which makes it
possible to add a bit of load through them to the
server; definition of the scenario, which constitutes
the core of the test, where a set of actions is
performed to simulate a user interaction with the
application and simulation definition, where the load
that will be executed over a period of time is
defined.
WEBIST 2017 - 13th International Conference on Web Information Systems and Technologies
120
Gatling provides a diverse form of representation
of results, as shown in Figure 3.
The main characteristics of Gatling are:
Easy integration with Jenkins through the
jenkins-plugin and can also be integrated with
other continuous integration tools. This allows
constant feedback from performance tests;
Allows to easily run the tests through Maven to
Gradle with the help of maven-plugin and
gradle-plugin;
Full HTTP protocol support and can also be used
for JDBC and JMS load tests;
Has multiple input sources for data-driven
testing.
Figure 4: Gatling Test Plan.
In short, Gatling stands out for the elegant reports it
provides, as well as for the documentation it has
about the operation of the application. It also has a
very intuitive interface. The fact that its structure has
the possibility of being defined in four different
parts, parts, allows the addition of charge even in
headers.
5 COMPARISON OF WEB
TESTING TOOLS
In this section we present a comparison of the four
Web Platform test tools, and then a discussion of the
results is presented. This comparison is useful for
users to choose the testing tool best suited to their
needs. The comparison of the tools is divided into
two analyzes: qualitative and quantitative.
5.1.1 Qualitative Analysis
In order to perform the qualitative analysis, only the
most relevant characteristics were considered and,
after the use of each of the tools, each one of its
characteristics was described. Table 2 shows the
qualitative analysis of the four tools.
Table 2: Qualitative Analysis.
Characteristics
Tools
Apache
jMeter
Apache
Flood
The
Grinder
Gatling
Open Source Yes Yes Yes Yes
Report view
mode
CSV,
XML,
Embed.
Tables,
Graphic,
Plugins
XML Console HTML
Test language XML XML
Jython,
Clojure
Scala
Test Recorder HTTP HTTP TCP HTTP
Distributed
Testing
Supports
multiple
machines
to be
controlled
by a single
instance to
run
Uses rsh /
ssh for
simple
distributed
processing
Facilit.
ates
exec. of
distrib.
load tests
betwen
multiple
servers
Supports
distributed
testing
In this analysis the Apache jMeter tool stands out as
being the best one, since it has more visualization
modes than the other tools. Regarding distributed
testing this tool is also better, since it allows the use
of multiple machines to be controlled by a single
instance for execution.
5.1.2 Quantitative Analysis
In order to perform the quantitative analysis, only
the most relevant characteristics were considered:
ease of use, graphics complexity, interface, quality
of documentation presented, easily editing scripts,
and ease of interpretation of reports. After each tool
use, each one of its characteristics was evaluated on
a scale from zero (very bad) to ten (very good). Then
the individual scores of each feature of the
respective tools were added, resulting in their final
score.
In Table 3 the quantitative analysis of the four
tools is performed.
Table 3: Quantitative analysis.
Characteristics
Tools
Apache
jMeter
Apache
Flood
The
Grinder
Gatling
Ease of Use 10 4 6 5
Graphics Complexity 8 0 7 6
Interface 9 2 8 7
Quality of
documentation
presented
10 2 8 6
Easily editing scripts 10 3 7 6
Ease of interpretation
of reports
8 5 4 3
Final score 55 16 40 35
Comparative Analysis of Web Platform Assessment Tools
121

The final scores obtained by the Apache jMeter
tools; Apache Flood; The Grinder and Gatling were
respectively: 55; 16; 40 and 35 points.
The jMeter tool was considered to have a better
ease of use, since it has an intuitive interface and a
lot of documentation about its use. In turn, Flood
was the tool with a lower ease of use, since it does
not have an interface, nor does it have
documentation about its operation. Regarding the
ease of editing scripts, the jMeter tool is the
"winner", since it is not necessary to write direct
code to perform editing. The more complex graphs
of jMeter lead to the production of more detailed
reports with a high ease of interpretation.
The tool with the lowest score was Flood, since it
had a negative score in practically all analyzed
characteristics. With regard to the best score, this
was attributed to the jMeter tool, since it stood out
positively in all the characteristics, never obtaining a
score inferior to 8.
5.2 Discussion of the Results
After enumeration and analysis of the four test
platforms, it was necessary to choose one that would
allow easy learning, be simple to handle, be able to
simulate several users on the website, send requests
to the server, support distributed testing and generate
reports in CSV. That is, it was necessary to select a
tool that pleases the user in all its aspects, from its
use, to the results visualization. So, the selected tool
was Apache jMeter, although this one stands out
positively in relation to the mentioned characteristics
and to have a good documentation in its own website
that originates a good learning of use is evidenced
by the examples that it has in the most diverse tasks
that allow you to create test scripts in a simplified
way.
The fact that jMeter supports distributed testing,
with multiple machines simultaneously being
controlled by a single running instance allows test
scripts with a small number of users to run on
multiple machines. Thus it is possible to simulate a
greater number of users in the same time interval,
thus avoiding long execution times for the various
tests performed.
6 PERFORMANCE TEST IN
SEARCH ENGINES
The speed of a website is as important today as its
content, because unconsciously no one likes to wait,
so every millisecond matters a lot in response time.
Smartphones, tablets and other portable devices
are creating more and more web traffic
simultaneously, since countless people download
videos, news or use social networks. Therefore,
there is a huge competition not through the content
that each website has, but because of its
responsiveness. Certainly the most visited is the one
that will respond faster.
Google engineers have revealed that users are
starting to get frustrated with a website after waiting
only 400 milliseconds (Lohr, 2012), this almost
imperceptible delay causes users to look for other
websites.
The top five search engines (Ratcliff, 2016) were
selected: Google; Bing; Yahoo; Ask and Aol Search.
Of these five, Yahoo was excluded, and the others
were compared in terms of performance to the
remaining search engines by using the jMeter tool.
Yahoo was removed from the comparison, since
whenever users were simulated to access it, an error
was returned with code 999 (unable to process
request at this time). This error occurs when there is
a large number of requests originating from the
computer that is being used to perform the tests. So,
to protect its servers, Yahoo generates error code
999, denying access to your page (Information about
Yahoo Error 999, n.d.).
The test case consisted of a simple search of the
word "Apache jMeter" in each of the search engines,
with a gradual increase in the number of users.
All users were simulated coming to the search
engines every 5 seconds, since they always have
countless people accessing their web pages. Only 10
users were initially simulated to understand how
each search engine behaved with a minimum load.
This number has been increasing to an average load
with 100 users and to a high load with 1000 users.
Since 1000 users already experienced errors in
simulating users, this number was no longer
increased. Each test case was repeated ten times and
the elapsed mean was performed (it encompasses the
time from the time the request was formulated, until
its response was obtained), message size in bytes
(encompasses the size of customer requests for
Server and server responses to the client) and
latency (it only includes the time from when the
request was formulated until the first part of the
response was obtained).
The results obtained are presented in Tables 4, 5
and 6.
According to the results presented in Table 4, the
search engine that takes less time to obtain the
response since the request was made is Google. So it
WEBIST 2017 - 13th International Conference on Web Information Systems and Technologies
122
responds quickly to its users, avoiding waiting
queues, because with 10 and 100 users the elapsed
values are less than 450 seconds. When the load is
increased to 1000 users, it also increases the elapsed
value. In this case it is possible that some users wait
longer than others to obtain the response to their
request, since the standard deviation is high. A good
alternative to Google in terms of performance will
be Aol Search, which also has reduced elapsed
values.
In contrast, the search engine that responds more
slowly to its users by providing higher elapsed
values is Bing. This one with 100 and 1000 users
can have elapsed values that represent twice the
value present in the other search engines.
Table 4: Mean and standard deviation of elapsed tests
performed.
Search Engine
Elapsed
time (ms)
Standard
deviation
10
Users
Google 395,6 57,82
Bing 575,31 45,65
Ask 802,24 69,84
Aol Search 441,26 33,21
100 Users
Google 442,85 157,33
Bing 2201,03 1717,82
Ask 1171,27 382,89
Aol Search 730,96 813,85
1000 Users
Google 11524,73 5337,18
Bing 43353,53 13158,68
Ask 20225,05 26497,37
Aol Search 19775,78 8888,54
According to the results presented in Table 5, in
general the size of the client requests to the server
and the responses from the server to the client
(message size) varies little, since the simulated
request is always the same, with the difference in
load.
Google again stands out again positively,
because the size of the message is small. In turn, the
search engine with the highest message size is Bing,
which is more than twice the size of Google's
message.
Table 5: Mean and standard deviation of the message size
of the tests performed.
Search Engine
Size of
message
(Bytes)
Standard
deviation
10 Users
Google 40685,62 220,84
Bing 91819,52 832,22
Ask 71389,76 20,85
Aol Search 48416,99 0,17
100 Users
Google 40656,06 149,22
Bing 91932,32 776,07
Ask 71411,43 612,72
Aol Search 48417,00 0,11
1000 Users
Google 40622,86 744,98
Bing 91495,05 5768,17
Ask 35803,72 28905,95
Aol Search 48417 0,39
Table 6: Mean and latency standard deviation of the tests
performed.
Search engine
Latency
(ms)
Standard
deviation
10 Users
Google 140,12 11,40
Bing 201,08 33,19
Ask 615,73 61,31
Aol Search 292,38 27,67
100 Users
Google 169,32 97,69
Bing 925,59 894,12
Ask 718,68 173,68
Aol Search 386,99 507,69
1000 Users
Google 5276,27 3932
Bing 8888,11 6788,92
Ask 5793,60 4308,98
Aol Search 5574,89 4690,05
According to the results presented in Table 6,
Google is the search engine that can formulate the
request and obtain the first part of its latency
response in a shorter time interval. This value
changes greatly when the load is increased to 1000
users as the system becomes overloaded. However,
it may happen that some users get a faster system
Comparative Analysis of Web Platform Assessment Tools
123

response than others, since the standard deviation is
high. An alternative to Google based on the latency
value is again Aol Search which also provides small
amounts.
The search engine that takes the longest time to
get the first part of the response, since the order was
formulated is Bing.
Overall, the search engine that best meets the
user's performance needs and keeps them longer on
our page, since it has fewer response times is
Google. An alternative to Google will then be Aol
Search which also has low response times. In turn,
the search engine that will have more users to
abandon our page, because it takes longer to respond
will be Bing.
7 CONCLUSIONS AND FUTURE
WORK
The test activity is fundamental to guarantee the
quality of the products developed. Among the
various types of test exist the load tests stand out,
since they are reaching more and more importance,
since the web systems are increasingly used. These
tests are still little used and, since the associated
costs for their execution are high, the use of tools
that automate the creation and execution of tests is
essential. In addition, measuring response times and
simulating multiple users accessing an application
simultaneously is unfeasible and often impossible to
perform without a tool that automates the testing
process.
In this paper, four test tools were presented:
Apache jMeter, Apache Flood, The Grinder and
Gatling. For this, a quantitative analysis and a
qualitative analysis were carried out, comparing the
main characteristics common to all the tools. This
comparison concludes that the best tool for
evaluation of web platforms is Apache jMeter, since
it stands out positively in most of its characteristics,
in addition to allowing the use of distributed tests,
with multiple machines simultaneously to be
executed by a single instance running. The fact that
Apache jMeter supports distributed testing, provides
the simulation of more users in the same time
interval.
As search engines are accessed countless times
during the day by various users around the world, it
is important that they can respond quickly to all
users. Thus, it is important to perform performance
tests on the search engines, and then act on their
optimization.
In the experimental evaluation load tests were
performed on four search engines and Google stood
out positively with either a low load (10 users),
average (100 users) or high (1000 users), since it
responds quickly to its users. In contrast, Bing was
the search engine that stood out negatively, since it
is the one that takes more time to present the
answers to the users. With high response times users
tend to abandon their page.
As future work we propose the creation of
distributed tests, that is, in several machines. This
way, we can simulate more users accessing the same
search engines already tested and get more real
results.
REFERENCES
A. Avritzer and E. R. Weyuker, "The automatic generation
of load test suites and the assessment of the resulting
software," in IEEE Transactions on Software
Engineering, vol. 21, no. 9, pp. 705-716, Sep 1995.
doi: 10.1109/32.464549.
Alberto Avritzer and Brian Larson. 1993. Load testing
software using deterministic state testing. In
Proceedings of the 1993 ACM SIGSOFT international
symposium on Software testing and analysis (ISSTA
'93), Thomas Ostrand and Elaine Weyuker (Eds.).
ACM, New York, NY, USA, 82-88.
DOI=http://dx.doi.org/10.1145/154183.154244.
Alberto Avritzer and Elaine J. Weyuker. 1994. Generating
test suites for software load testing. In Proceedings of
the 1994 ACM SIGSOFT international symposium on
Software testing and analysis (ISSTA '94), Thomas
Ostrand (Ed.). ACM, New York, NY, USA, 44-57.
DOI=http://dx.doi.org/10.1145/186258.186507.
Apache Flood, https://httpd.apache.org/test/flood/. [11
November 2016].
Apache JMeter, http://jmeter.apache.org. [11 November
2016].
Fei Wang and Wencaai Du, “A Test Automaton
Framework Based on WEB” proc. IEEE 11th
International Conference on Computer and
Information (ACIS 12),IEEE Press, 2012.
Gatling Project, Stress Tool, http://gatling.io. [11
November 2016].
Gaurav Banga and Peter Druschel. 1999. Measuring the
capacity of a Web server under realistic loads. World
Wide Web 2, 1-2 (January 1999), 69-83.
DOI=http://dx.doi.org/10.1023/A:1019292504731.
Information about Yahoo Error 999, http://www.
scrapebox.com/yahoo-999-error. [11 November 2016].
Jian Zhang and S. C. Cheung. 2002. Automated test case
generation for the stress testing of multimedia
systems. Software - Practice & Experience Journal, 32,
15 (December 2002), 1411-1435. DOI=http://
dx.doi.org/10.1002/spe.487.
WEBIST 2017 - 13th International Conference on Web Information Systems and Technologies
124

K. Curran and C. Duffy. Understanding and Reducing
Web Delays. International Journal of Network
Management, 15(2):89–102, 2005.
Lohr, 2012,” For Impatient Web Users, an Eye Blink Is
Just Too Long to Wait” http://www.nytimes.com/
2012/03/01/technology/impatient-web-users-flee-
slow-loading-sites.html?_r=2.
M. S. Bayan and J. W. Cangussu, "Automatic Stress and
Load Testing for Embedded Systems," 30th Annual
International Computer Software and Applications
Conference (COMPSAC'06), Chicago, IL, 2006, pp.
229-233. doi: 10.1109/COMPSAC.2006.119.
Monika Sharma and Rigzin Angmo, “Web Based
Automation Testing and Tools”, International Journal
of Computer Science and Information Technologies,
2014.
Monika Sharma, Vaishnavi S. Iyer, Sugandhi
Subramanian and Abhinandhan Shetty, “A
Comparative Study on Load Testing Tools” proc.
International Journal of Innovative Research in
Computer and Communication Engineering (2007).
Paul Barford and Mark Crovella. 1999. Measuring Web
performance in the wide area. SIGMETRICS
Performance Evaluation Review 27, 2 (September
1999), 37-48. DOI=http://dx.doi.org/10.1145/
332944.332953.
R. Pressman. Engenharia de Software. McGraw-Hill, 6th
edition, 2006.
Ratcliff, 2016, https://searchenginewatch.com/
2016/08/08/what-are-the-top-10-most-popular-search-
engines/. [11 November 2016].
Rizwan Khan, “Comparative Study of Performance
Testing Tools: Apache JMeter and HP LoadRunner”
(2013).
Shariq Hussain, Zhaoshun Wang, Ibrahima Kalil Toure
and Abdoulaye Diop, 2013, “Web Service Testing
Tools: A Comparative Study”.
The Grinder, a Java Load Testing Framework”,
http://grinder.sourceforge.net/. [11 November 2016].
Tikhanski, 2015, “Open Source Load Testing Tools:
Which One Should You Use?” https://
www.blazemeter.com/blog/open-source-load-testing-
tools-which-one-should-you-use.
Vahid Garousi, Lionel C. Briand, and Yvan Labiche.
2006. Traffic-aware stress testing of distributed
systems based on UML models. In Proceedings of the
28th international conference on Software engineering
(ICSE '06). ACM, New York, NY, USA, 391-400.
DOI=http://dx.doi.org/10.1145/1134285.1134340.
Xingen Wang, Bo Zhou and Wei Li, “Model based load
testing of Web Applications”, Proceedings of IEEE
International Symposium on Parallel and Distributed
Processing with Applications (ISPA 10), IEEE Press,
2010.
Z. M. Jiang, A. E. Hassan, G. Hamann and P. Flora,
"Automatic identification of load testing problems," In
Proceedings of the 24th IEEE International
Conference on Software Maintenance (ICSM),
Beijing, 2008, pp. 307-316. doi: 10.1109/
ICSM.2008.4658079.
Zhen Ming Jiang. 2010. Automated analysis of load
testing results. In Proceedings of the 19th international
symposium on Software testing and analysis (ISSTA
'10). ACM, New York, NY, USA, 143-146.
DOI=http://dx.doi.org/10.1145/1831708.1831726.
Comparative Analysis of Web Platform Assessment Tools
125
