
Public Transport Stops State Detection and Propagation
Warsaw Use Case
Marcin Luckner
1
, Paweł Kobojek
1
and Paweł Zawistowski
2
1
Faculty of Mathematics and Information Science, Warsaw University of Technology, Koszykowa 75, Warsaw, Poland
2
Institute of Computer Science, Faculty of Electronics and Information Technology, Warsaw University of Technology,
Nowowiejska 15/19, Warsaw, Poland
Keywords:
Open Data, Public Transport, Text Mining, Events Detection, Geographic Information System.
Abstract:
Publication of information on public transport in a form acceptable to third–party developers can improve a
quality of services offered to the citizens. Usually, published data are limited to localisations of the stops and
the schedules. However, a public transport model based on these data is incomplete without information about
a current state of the stops. In this paper, we present a system that observes public sources of information on
public transport such as Twitter feeds and official web pages hosted by the City of Warsaw. The incoming
messages are parsed to extract information on events that concern public transport lines and stops. Extracted
information allows us to detect a current state of the stops and to create linguistically independent and spatial
oriented information in Geography Markup Language format that can be published using a web service. The
system has been tested on real data from Warsaw district and the suburban zones.
1 INTRODUCTION
Public transport is an area that still needs improve-
ment to satisfy its users. The public transport user’s
perception survey showed that the most important fac-
tors in public transport evaluation are on–time perfor-
mance and reduction of waiting time (Nesheli et al.,
2016). These criteria are strongly connected with
stops and their current state.
Lack of information about the current state of
the stops influence on public transport users’ percep-
tion.When the user suddenly discovers that the stop is
closed or the schedule on the stop is temporary chan-
ged his evaluation of the public system will decrease.
Similarly, lack of knowledge about newly opened or
reopened stops disturbs the user to take an advantage
of public transport.
The City of Warsaw – as many other cities – pu-
blishes information about changes in public trans-
port using various forms such as Rich Site Summary
(RSS) or Tweeter. Figure 1 shows examples of publi-
shed messages. However, the messages are published
in Polish, without spatial localisation, and in the form
that cannot be directly reused in third–party applica-
tions.
The last factor is critical because recent studies
emphasise the role of Open Data also as an enabler
of innovation (Lakomaa and Kallberg, 2013). Among
other purposes in this area, Open Data can be used
for application development (Lakomaa and Kallberg,
2013; Lindman et al., 2014). For example, 43 percent
of surveyed Swedish start-up IT entrepreneurs find
Open Data essential for their business plans (Lako-
maa and Kallberg, 2013). Other survey showed, that
most frequently designed and developed applications
involve location based services (LBS) and dynami-
cally changing urban data (Grabowski et al., 2015).
Therefore, a proper politics in city data opening may
increase services for the citizens. Moreover, informa-
tion on stops’ states are critical for public transport
information systems and modelling (see Section 2).
In this paper, we presented a system that collects
text data on public transport produced by the city hall.
The data are collected from several sources including
public city web pages and Twitter (Section 3). Next,
the collected data are parsed to extract information
about lines, stops, a type of the event, and a time span
for the event (Section 4). The collected information is
used to detect a current state of the public transport
stops. Finally, the information is transferred into a lo-
calised form that contains a linguistically independent
graphical presentation and can be reused through web
services (Section 5). The system was tested on real
data from City of Warsaw (Section 6).
Luckner, M., Kobojek, P. and Zawistowski, P.
Public Transport Stops State Detection and Propagation - Warsaw Use Case.
DOI: 10.5220/0006305102350241
In Proceedings of the 6th International Conference on Smart Cities and Green ICT Systems (SMARTGREENS 2017), pages 235-241
ISBN: 978-989-758-241-7
Copyright © 2017 by SCITEPRESS – Science and Technology Publications, Lda. All rights reserved
235
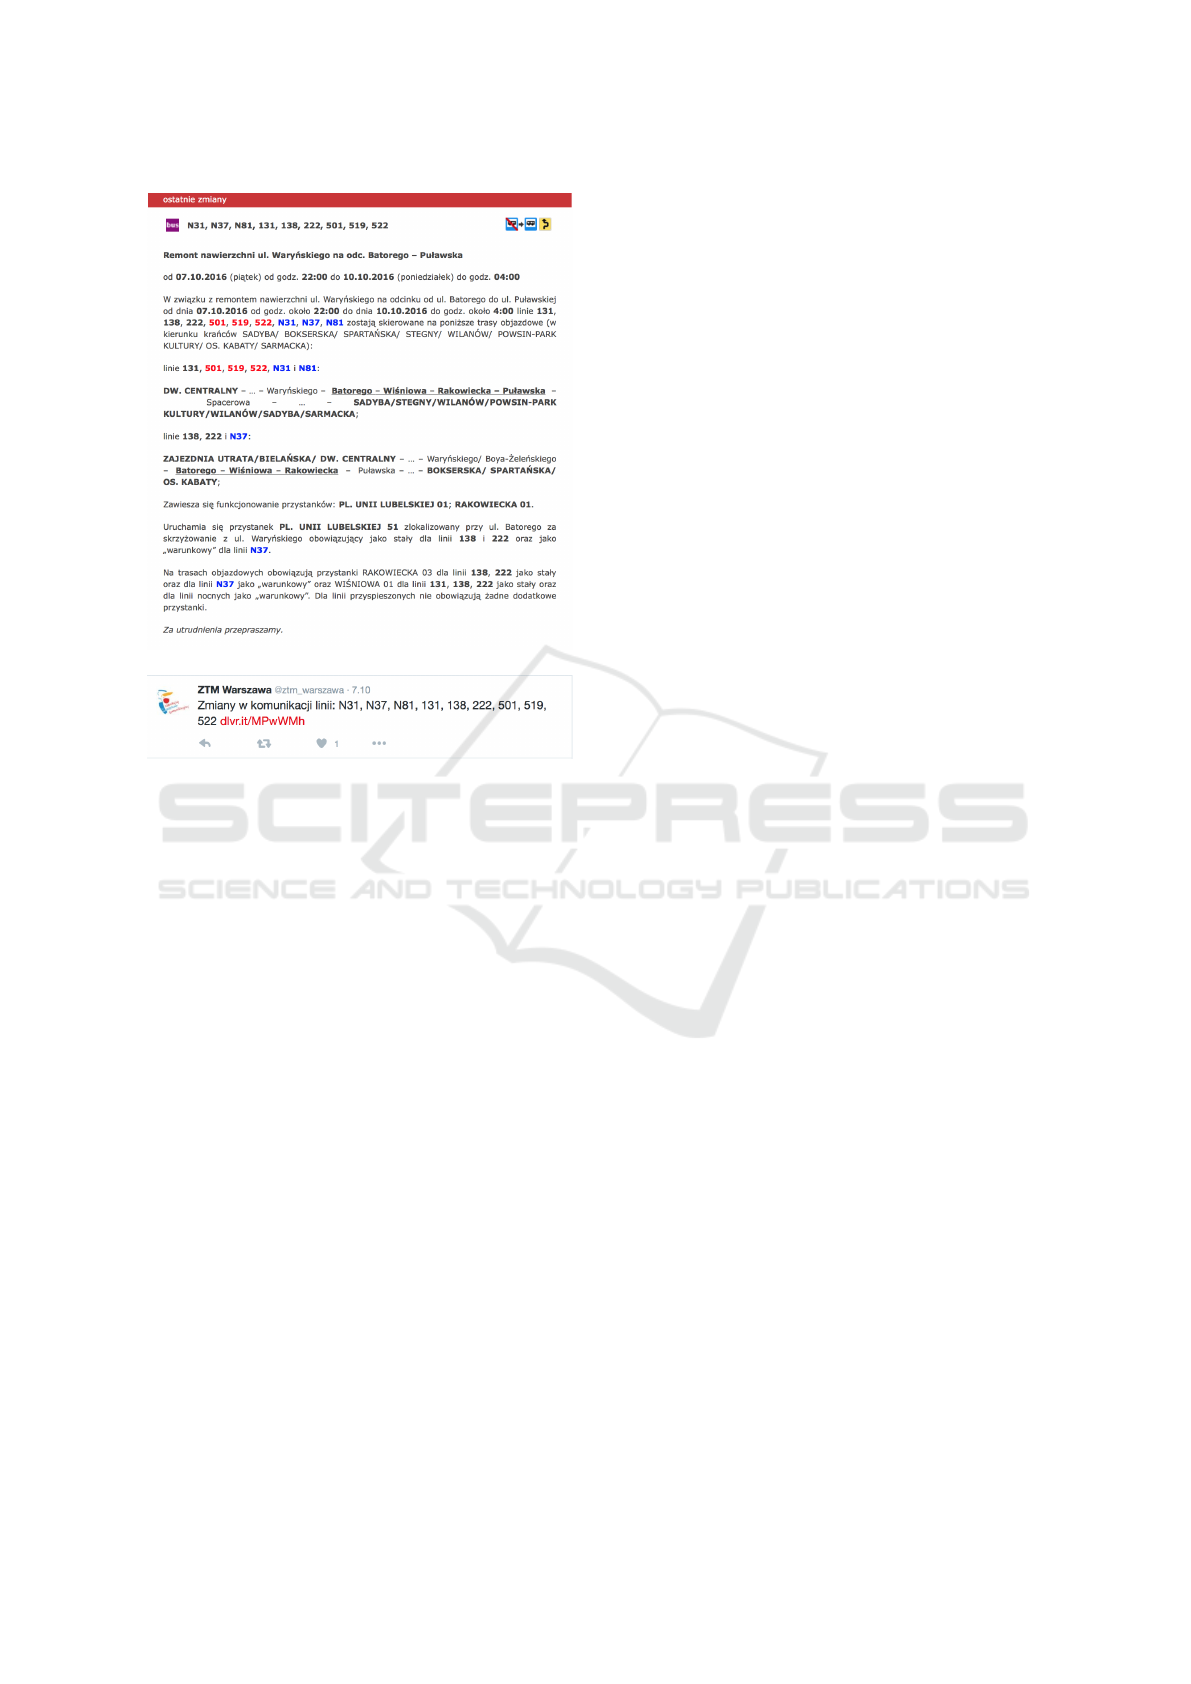
(a) RSS
(b) Twitter
Figure 1: The examples of information about public trans-
port events. The first example 1(a) is a well structured
HTML broadcast as RSS. The second example 1(b) refers
to the same event. The link in the tweet links to the same
HTML.
2 RELATED WORK
Our system is a dynamic solution that informs about
events that influence public transport but may not be
noted in timetables.
Work (Tyrinopoulos, 2004) summarised types of
models available in the public transport business. On-
ly 11 percent of them were dynamics models that inc-
lude real-time passenger information. That stress de-
mand on dynamic systems.
Work (García et al., 2009) named three main
subsystems of public transport information systems:
timetable information subsystem, route information
subsystem, and payment subsystem. In this categori-
sation a state of the stop is included in timetable infor-
mation subsystem. An existence of a timetable sugge-
sts that the stop is working. Unfortunately, very often
the schedules are not modified when stops are closed
because of a sudden or temporary event.
Information on stops’ states are also critical for
any public transport model (Zheng et al., 2016; Ro-
drigues et al., 2016; Álvarez et al., 2010). The model
should disable closed stops and enable reopened ones.
Our system can conveys such information.
Work (Rathod and Khot, 2016) proposed an inte-
resting alternative in a detection of events that influ-
ence the schedules. A multi-sensor system in a bus
detects accidents and simultaneously sends informa-
tion to public transport system.
3 COLLECTION OF TEXT DATA
In order to get some insights into the current state of
transport stops first raw data needs to be collected and
analysed. After preliminary analysis of the available
data sources, four relevant text feeds have been cho-
sen:
• RSS (http://www.ztm.waw.pl/rss.php) and Twit-
ter (https://twitter.com/ztm_warszawa) feeds ho-
sted by the Public Transport Authority in War-
saw, which contain important information about
the municipal communication system,
• articles posted on http://warszawa19115.pl/
glowna website which often indicates important
events within the city which might influence also
the transportation,
• information submitted by Warsaw citizens direc-
tly to 19115 which is the name of one of the offi-
cial API services hosted by the city of Warsaw.
3.1 Overall Architecture
The task of getting external text data into our system
consists of two parts:
1. retrieving data directly from the feed sources, par-
sing and identifying external weblinks – which
is the responsibility a python component called
VaVelFeeds,
2. fetching the external links along with all their
dependencies (i.e. links present on the fetched
HTML pages) – which is handled by a Spark Stre-
aming job called UriDownloader.
The main reason behind having two components
responsible for downloading web data is that the feed
messages might link to external files of various types
like for example images or video clips which may be
large in size. Therefore a decision has been made to
handle downloading and saving these links in a desi-
gnated separate component which would be configu-
red in an environment with efficient storage access.
At the same time the readers communicating direc-
tly with the chosen data sources have only to fetch
SMARTGREENS 2017 - 6th International Conference on Smart Cities and Green ICT Systems
236
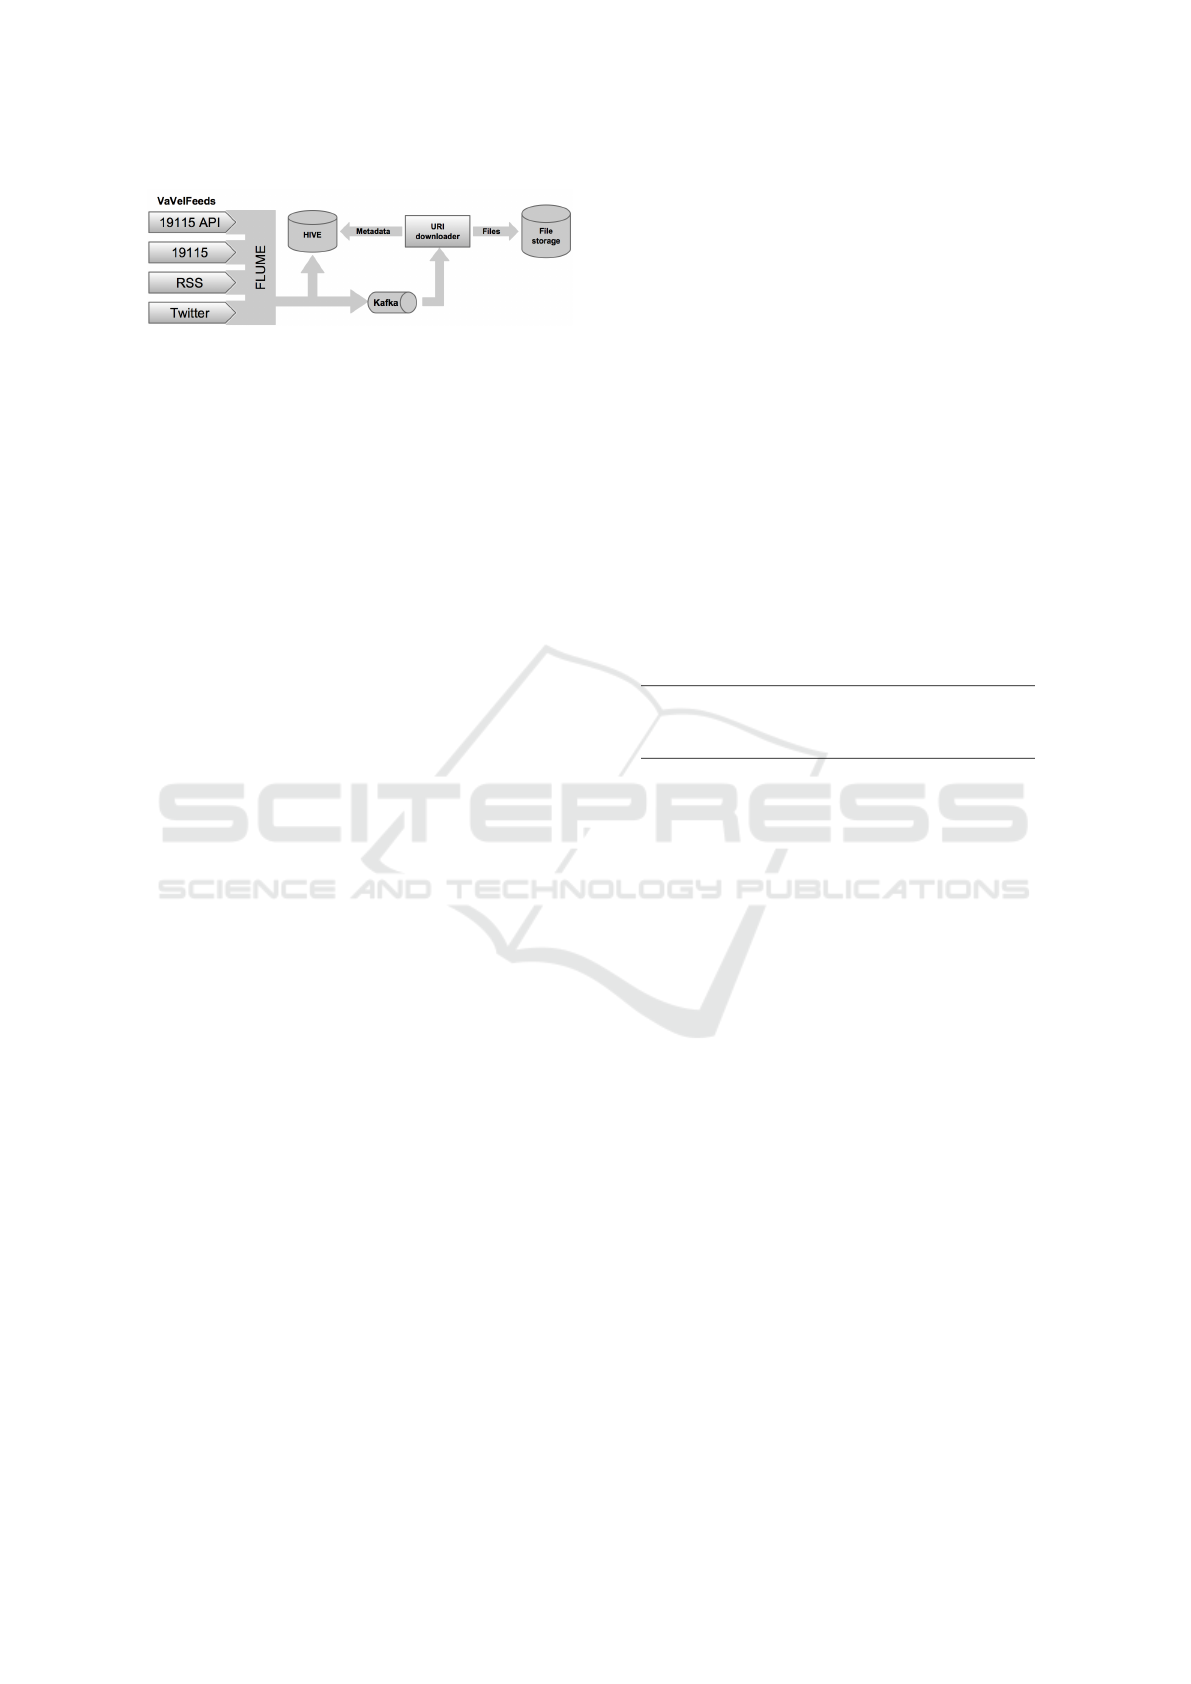
Figure 2: Schema of information collecting system. Custom
components implemented for the project have gradient bac-
kround.
and process (relatively short) text documents, there-
fore these have a different performance characteristic
and may benefit from a different deployment configu-
ration.
The interaction between the mentioned compo-
nents is depicted in Figure 2.
3.2 Fetching Text-feed Data
The VaVelFeeds python package (implemented spe-
cifically for the purposes of the described system)
consists of a number of readers downloading text-
feed data. These are also responsible for extracting
necessary information like timestamps and main con-
tent and identifying external links which should also
be downloaded. The messages fetched from all four
sources are effectively converted into JSON objects
and passed for further processing. Here Apache Flu-
me is utilised to deliver these objects to both Kafka
and HDFS sinks. A designated Kafka channel makes
the feed messages available in near real-time for other
components. To be precise, the latency is mostly in-
fluenced by polling frequencies of the individual text
feed sources — these may be set very low to make the
feed messages available as soon as possible, however
certain restrictions regarding for example the usage of
Twitter’s API apply here.
The package strives to provide exactly-once pro-
cessing semantics on a best-effort basis. Therefore,
the history of recently consumed messages is stored
on disk for each of the readers. This allows rejec-
tion of possibly duplicated messages early on in the
processing pipeline. Such an approach is however not
bulletproof – making the history size too small or de-
leting the contents of these files may result in proces-
sing duplicated messages. On the other hand shutting
down the feed readers entirely for a too long period
will result in loosing messages.
Scaling the system to handle more text-feed sour-
ces is straightforward, as it requires only creating an
appropriate feed reader and plugging it in into Apa-
che Flume. Here it is also possible to benefit from the
already existing Flume sources which may be utilised
in many cases.
3.3 Downloading Linked Content
A Spark streaming job called UriDownloader is re-
sponsible for downloading links extracted from text-
feed messages. As depicted in Figure 2, this job con-
sumes JSON messages from Kafka, processes them
and saves the results to external storage. Each of the
utilised technologies (and thus the entire system) is
easily scalable.
Processing a single message proceeds as follows.
First, the URIs from the message’s links field are do-
wnloaded — if these contain HTML, further links are
extracted from the content and also downloaded (this
process is not continued for these ’2nd level’ links).
Each downloaded link is stored in a seperate file with
the file name generated as a hash of the file’s content
— this approach helps to avoid the problem of storing
multiple copies of the same binary content.
Apart from the downloaded content, a record con-
taining metadata is stored in Apache Hive. A sample
record (in CSV) is given below:
1 2016−09−02T11 : 04 : 03 . 195+02 : 00 , h t t p :
/ /www. foo . com / foo . html , TEXT, abc /
def / ab cde f 123 , ab cde f 123
where the consecutive columns are: download
timestamp,URI,file type (BINARY or TEXT),
file path, file content checksum.
As the same URIs appear in multiple feed mes-
sages at various times, there is a need to handle po-
tentially duplicated content. Storing each downloaded
link as a separate file may lead to wasting storage spa-
ce, therefore a hashing approach (described above) is
used to prevent such problems. Although the content
will not be stored multiple times using this solution,
it still needs to be downloaded multiple times, which
potentially wastes network bandwidth. A naive reme-
dy would be to fetch the content of each URI only on-
ce, however this breaks in case of links that get upda-
ted – like news websites. Another solution is to utilise
HTTP’s ETags to detect whether the content has chan-
ged or not.
4 FEATURES EXTRACTION
The parsing module extracts meaningful and struc-
tured information about public transportation events
from observed sources. Those events should regard
particular lines and stops, usually lay in some span
of time and be of some type. On the other hand, data
from which this information is extracted forms a stre-
am consisting of well-structured records. Each such
record is in JSON format and contains information
Public Transport Stops State Detection and Propagation - Warsaw Use Case
237

about its source (e.g. twitter or RSS) along with other
data.
The module operates as follows. Each record –
whether it is sourced from twitter or RSS – contains
at least one website URL. Final results are extracted
directly from these websites. If there is more than one
hyperlink, results are gathered from each of those and
then merged additively (i.e. if there’s information abo-
ut line A and line B in the first link, and line B and line
C in the second link, then the final result will contain
lines A, B and C).
The website is only parsed when it is of a certa-
in structure. More specifically, only Public Transport
Authority websites with specific information type are
taken into the consideration. What is actually requ-
ired by the website in order to be parsed by the mo-
dule is an existence of an HTML element <td> with
CSS class "linie". As it is implied by the data we have
gathered, this element is only used when the news is
about some public transportation event.
Once it is known that the processed page concerns
such an event, four HTML elements are extracted for
further computations. The first one is a header, which
is always a first <h4> child element of the <div> with
id "PageContent". We will refer to this element as "he-
ader". The second is a table cell which lists all the li-
nes correlated with the news. It is the <td> element
with class "linie", which is exactly the one used to de-
termine whether the website is useful for further pro-
cessing. We will refer to this element as "line header".
The third one is a <p> element containing information
about date range. This one is always a first direct si-
bling of the header element. We will refer to this ele-
ment as "dates". The last one is text content. It con-
sists of all <p> elements which are direct children of
the <div> with id "PageContent". We will refer to this
element as "content".
4.1 Parsing Schemes
Since all lines related to the news are listed in the line
header element and separated by commas, extracting
the lines is just splitting the text content of this ele-
ment by the separator.
When it comes to dates, there are several possible
scenarios. An event may or may not start at a spe-
cific date and may or may not stop at a specific da-
te. What is more, both dates may or may not conta-
in information about specific time. The module as-
sumes, that if there is no time specified, it is set to
00:00 for starting date and 23:59 for ending date. One
more possible scenario is when the event spans over
one exact day. The pattern for a starting date looks
as follows: "od dd.MM.yyyy (a day of the week) <od
godz. HH:mm>" (text between <> is optional). This is
parsed using the following regular expression (in Java
language syntax):
1 od ( [ 0−9 ] \ {2 \ } \ \ . [ 0−9 ] \ {2 \ } \ \ . [ 0−9 ] \
{4 \ } ) \ \ ( [A−Za−z ] ∗ \ \ ) ( od godz
\ \ . ( [ 0−9 ] {2} : [ 0−9 ] \ {2 \ } ) ) ?
In this and in the following regular expression dia-
critical mark were removed for a presentation reason.
As it was previously stated, if there is no time spe-
cified, the "00:00" is assumed. However, if the event
only concerns one, specific day, the pattern is: "dn.
dd.MM.yyyy". The related regular expression:
1 dn . ( [ 0−9 ] \ {2 \ } \ \ . [ 0−9 ] \ {2 \ } \ \ . [ 0−9 ]
\ {4 \ } )
The end date is a similar case. The regular expres-
sion used for parsing:
1 do ( [ 0−9 ] \ {2 \ } \ \ . [ 0−9 ] \ {2 \ } \ \ . [ 0−9 ] \
{4 \ } ) \ \ ( [A−Za−z ] ∗ \ \ ) ( do godz
\ \ . ( [ 0−9 ] \ {2 \ } : [ 0−9 ] \ {2 \ } ) ) ?
Stops information is extracted from the content
text. Stops in the text are written in uppercase letters
and usually consists of one or more words, separa-
ted by a dot, dash, or space and two digits. Example
stops: RAKOWIECKA-SANKTUARIUM 06, KUL-
SKIEGO 02, METRO POLE MOKOTOWSKIE 06.
This is extracted using following regular expression:
1 ( [A−Z ] ++ [ − .\ ] ? ) + [ 0−9 ] \ {2 \ }
Type is obtained from header element. It is who-
le text from this element without lines and stops. In
order to remove the stops, it is required to remove the
white spaces from stops name, as it is sometimes spelt
differently in content text and in the header.
5 GRAPHICAL PRESENTATION
The transformation module converts the parsed events
into Keyhole Markup Language format (KML). The
KML is a descriptive language developed by Google
Company, which complements Geography Markup
Language (Open Geospatial Consortium, 2007) (stan-
dard defined by Open Geospatial Consortium) as a
format for describing and storing geographical infor-
mation including three-dimensional objects.
KML is connected a Web Map Service (WMS) z
Web Feature Service (WFS). WMS (Open Geospa-
tial Consortium, 2009b) produces a visual represen-
tation of spatial data, which is not the data itself.
WFS (Open Geospatial Consortium, 2009a) enables
the client to retrieve geospatial data through HTTP
SMARTGREENS 2017 - 6th International Conference on Smart Cities and Green ICT Systems
238

protocol (Chunithipaisan and Supavetch, 2009). It al-
lows clients and servers to share data without having
to convert data between proprietary formats (Ribeiro
et al., 2004). The result is encoded in Geography Mar-
kup Language.
The format enables marking of spatial data with
a time stamp or a time span. Therefore, the presen-
tation of the events can be limited to requested pe-
riod and published to interested receivers. Moreover,
the created Geography Markup Language files can be
easily published using a spatial data web service. The
format can be successfully applied in various GIS ta-
sks (Ying-Jun et al., 2009; Grzenda et al., 2011).
Before transformation of the events into KML
structure data are cleaned by an elimination of dupli-
cates that could be created during collection of data
from various sources.
Next, all events are localised in time and space.
For a spatial localisation the parsed stops’ names are
used. The geolocation is done using the Google Maps
Geocoding API. In the results, stops’ names are co-
nverted into geographic coordinates: latitude and lon-
gitude. To define a term of the event, the parsed dates
are used to define a time stamp or a time span.
The localised events were described by a type.
One and two words long prefixes are extracted from
the parsed types of the events. The prefixes are com-
pared with entries from a directory that exclusive
maps a prefix into one of the following three groups:
restored stop the stop that was reopened after a mo-
dernisation,
closed stop the stop that was closed because of a mo-
dernisation or other event,
change on stop the stop with some changes on it.
Mostly the events describe changes in the sche-
dules and the routes.
Bus lines affected by stop’s status are symboli-
sed by a polyline that connects the localisations of the
stops grouped by the event.
The final description of the events is stored using
Keyhole Markup Language format:
<Pl acemark>
<name>Pl . Un ii L u b e l s k i e j 01< / name>
< d e s c r i p t i o n >< ! [CDATA[ c l o s e d ] ] >< /
d e s c r i p t i o n >
< s t y l e U r l ># icon −1899−DB4436< /
s t y l e U r l >
< P o i n t >
< c o o r d i n a t e s >
21.018658 , 5 2 . 2 1 2 2 8 8 , 0 . 0 < /
c o o r d i n a t e s >
< / P o i n t >
< / Pla cemar k >
Figure 3: Detected event: closed stops with attached lines.
<Pl acemark>
<name>222 , N37 , 522 , N81 , 138 ,
501 , N31 , 519 , 131< / name>
< d e s c r i p t i o n >< ! [CDATA[ c l o s e d ] ] >< /
d e s c r i p t i o n >
< s t y l e U r l ># l i n e −A52714−6< / s t y l e U r l
>
< L i n e S t r i n g >
< t e s s e l l a t e >1< / t e s s e l l a t e >
< c o o r d i n a t e s >
21.018658 , 5 2 . 2 1 2 2 8 8 , 0 . 0
2 1 . 0 2 0 7 , 5 2 . 2 1 0 3 5 ,0.0
2 1 . 0 1 9 7 8 , 5 2 . 2 0 9 7 ,0.0
2 1 . 0 1 5 4 9 ,52 . 2 0 9 ,0. 0 < /
c o o r d i n a t e s >
< / L i n e S t r i n g >
< / Pla cemar k >
Figure 3 presents – in graphical form – the event
presented in Figure 1.
The obtained event description is very limited in
comparison to the original information. However, the
created description is linguistically independent, lo-
calised, and can be propagated through a web service.
6 TESTS AND RESULTS
The designed system was tested on real data. RSS and
Twitter feeds hosted by the Public Transport Authori-
ty in Warsaw were observed and collected over one
month.
In observer period – from 10th of September 2016
to 10th of October 2016 – we have collected 827 mes-
sages from the observed sources. Among that number
733 did not contain information about public transport
lines and stops. The rest of the messages – 94 cases
– were successfully parsed and information on lines
and stops were extracted. The extracted information
was verified manually. No mistakes were detected.
Public Transport Stops State Detection and Propagation - Warsaw Use Case
239
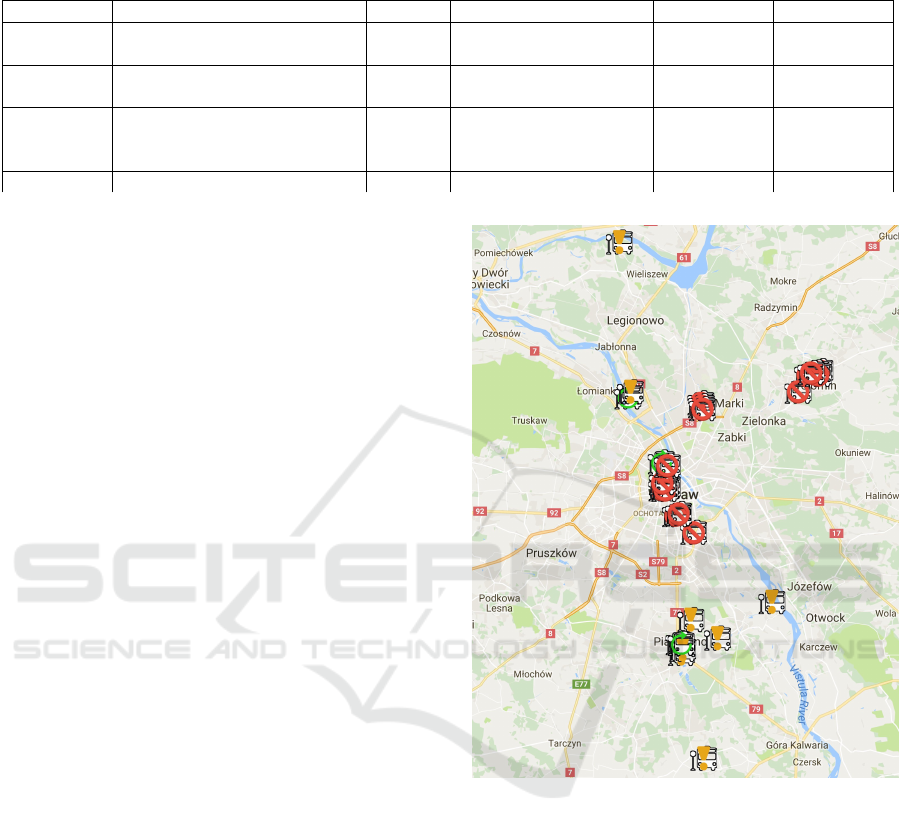
Tabela 1: Fragment of data on events connected with public transport produced by the city hall. For the presentation the
descriptions were translated into English and the events were labelled with the states.
lines stops state description beginning end
157, 116,
N44
GEN.ZAJ ˛ACZKA 01,
GEN.ZAJ ˛ACZKA 51
restored
stop
restored primary locali-
sation of the stop
2016-09-03
00:00
null
204, 527,
N11
OS. DERBY 01, OS. DERBY
VI 01, OS. DERBY III 01
closed
stop
renovation of the surface
of Skarbka z gór street
2016-10-01
00:00
2016-10-03
05:00
509, 186 NOWODWORY 55, NOWO-
DWORY 02
change
on stop
change of traffic orga-
nization on the terminal
stop Nowodwory
2016-10-01
00:00
2016-10-02
23:59
. . . . . . . . . . . . . . . . . .
The extracted information allowed us to remove
duplicated entries. The duplication came into existen-
ce because of the various sources of raised informa-
tion. After the filtration, 24 events were defined.
Table 1 shows partial information on 14 events as-
signed to stops. Each event contains information on
lines and stops, a short description, the beginning ti-
me, and the end time. For a presentation reason, the
descriptions were translated into English.
There are two types of observed events according
to their localisation in the time. The first group inclu-
des temporary events. The beginning and the end of
the event are known. The group consists of planned
renovations, changes in schedules and localisations
caused by various events in the city. For this group,
the states are established temporarily.
The second group of the events has only one time-
stamp that describes the beginning of the event. This
group – with a single exception – contains informa-
tion on restored stops. The group also includes infor-
mation on changes on the stop without a known end
of the event.
The events were divided into three classes using
events’ descriptions. Each class is connected with a
state of the stop. The distribution of the states is as
follows: 4 messages about restored stops, 6 messa-
ges about closed stops, and 4 messages on changes on
stops. Because a single event touches several stops the
number of the stops with assigned states is as follows:
7 restored, 28 closed, and 10 with the changes in the
schedules or locations.
The events were localised using geolocation of the
stops. Figure 4 shows the positioned stops. The icons
symbolise a type of the events: the restored stop, the
closed stop, and changes on the stop. The results co-
ver not only the Warsaw district but also the suburban
zones.
Not all of the stops were localised on the map. The
Google Maps Geocoding API does not cover tempo-
rary stops. All stops labelled with the numbers over
fifty are temporary stops created mostly as a substi-
tute stop for the closed one. The localised stops we-
re distributed as follows: 4 restored stops, 22 closed
Figure 4: Localisation of detected events on the map
stops, and 8 stops with the changes in the schedules
or locations. The number of the stops was reduced to
34 stops from 45 stops mentioned in events but each
event is represented by at least a single localised stop.
7 CONCLUSIONS
We have presented the system that collects text da-
ta on public transport produced by the Warsaw city
hall. The collected data are parsed to extract informa-
tion about the status of stops used by public transport.
Information about closed stops, reopened stops, and
changes on stops is presented in graphical linguisti-
cally independent form using geolocation of the stops.
Data are prepared using Geography Markup Langu-
SMARTGREENS 2017 - 6th International Conference on Smart Cities and Green ICT Systems
240

age format that can be easily published using a web
service. The output should be consumed by a notifi-
cation system that allows us to analyse the users feed-
back. The notification system is in development.
ACKNOWLEDGEMENTS
This research has been supported by the European
Union’s Horizon 2020 research and innovation pro-
gramme under grant agreement No. 688380 VaVeL:
Variety, Veracity, VaLue: Handling the Multiplicity of
Urban Sensors.
REFERENCES
Álvarez, A., Casado, S., González Velarde, J. L., and Pa-
checo, J. (2010). A computational tool for optimizing
the urban public transport: A real application. Jour-
nal of Computer and Systems Sciences International,
49(2):244–252.
Chunithipaisan, S. and Supavetch, S. (2009). The deve-
lopment of web processing service using the power
of spatial database. In Emerging Trends in Engine-
ering and Technology (ICETET), 2009 2nd Interna-
tional Conference on, pages 832 –837.
García, C. R., Pérez, R., Lorenz, Á., Alayón, F., and Padrón,
G. (2009). Supporting information services for travel-
lers of public transport by road. In Computer Aided
Systems Theory - EUROCAST 2009: 12th Internatio-
nal Conference, pages 406–412, Berlin, Heidelberg.
Springer Berlin Heidelberg.
Grabowski, S., Grzenda, M., and Legierski, J. (2015). The
adoption of open data and open api telecommunica-
tion functions by software developers. In Business
Information Systems: 18th International Conference,
Proceedings, pages 337–347, Pozna
´
n, Poland,. Sprin-
ger International Publishing.
Grzenda, M., Kaczmarski, K., Kobos, M., and Luckner, M.
(2011). Geospatial presentation of purchase transac-
tions data. In FedCSIS, pages 291–296.
Lakomaa, E. and Kallberg, J. (2013). Open data as a fo-
undation for innovation: The enabling effect of free
public sector information for entrepreneurs. IEEE Ac-
cess, 1:558–563.
Lindman, J., Kinnari, T., and Rossi, M. (2014). Industrial
open data: Case studies of early open data entrepre-
neurs. In 2014 47th Hawaii International Conference
on System Sciences, pages 739–748.
Nesheli, M. M., Ceder, A. A., and Estines, S. (2016). Pu-
blic transport user’s perception and decision asses-
sment using tactic-based guidelines. Transport Policy,
49:125 – 136.
Open Geospatial Consortium (2007). OpenGIS Geography
Markup Language (GML) Encoding Standard(Version
3.2.1) [EB/OL].
Open Geospatial Consortium (2009a). OpenGIS Web Featu-
re Service (WFS) Implementation Specification Ver-
sion 1.1.0.
Open Geospatial Consortium (2009b). OpenGIS Web Map
Service (WMS) Implementation Specification Version
1.3.0.
Rathod, R. and Khot, S. T. (2016). Smart assistance for pu-
blic transport system. In 2016 International Conferen-
ce on Inventive Computation Technologies (ICICT),
volume 3, pages 1–5.
Ribeiro, J., de Farias, O., and Roque, L. (2004). A syntactic
and lexicon analyzer for the geography markup langu-
age (gml). In Geoscience and Remote Sensing Sym-
posium, 2004. IGARSS ’04. Proceedings. 2004 IEEE
International, volume 5, pages 2896 – 2899 vol.5.
Rodrigues, F., Borysov, S., Ribeiro, B., and Pereira, F.
(2016). A bayesian additive model for understanding
public transport usage in special events. IEEE Trans-
actions on Pattern Analysis and Machine Intelligence,
PP(99):1–1.
Tyrinopoulos, Y. (2004). A complete conceptual model for
the integrated management of the transportation work.
Journal of Public Transportation, 7(4):101–121.
Ying-Jun, D., Chong-Chong, Y., and Jie, L. (2009). A study
of gis development based on kml and google earth.
In INC, IMS and IDC, 2009. NCM ’09., pages 1581
–1585.
Zheng, P., Wang, W., and Ge, H. (2016). The influence
of bus stop on traffic flow with velocity-difference-
separation model. International Journal of Modern
Physics C, 27(11):1650135.
Public Transport Stops State Detection and Propagation - Warsaw Use Case
241
