
Automatic Driver Sleepiness Detection Using Wrapper-Based Acoustic
Between-Groups, Within-Groups, and Individual Feature Selection
Dara Pir
1
, Theodore Brown
1,2
and Jarek Krajewski
3,4
1
Department of Computer Science, The Graduate Center, City University of New York, New York, U.S.A.
2
Department of Computer Science, Queens College, City University of New York, New York, U.S.A.
3
Institute for Safety Technology, University of Wuppertal, Wuppertal, Germany
4
Engineering Psychology, Rhenish University of Applied Science Cologne, Cologne, Germany
Keywords:
Automatic Sleepiness Detection, Wrapper Method, Acoustic Group Feature Selection, Computational
Paralinguistics.
Abstract:
This paper presents performance results, time complexities, and feature reduction aspects of three wrapper-
based acoustic feature selection methods used for automatic sleepiness detection: Between-Groups Feature
Selection (BGFS), Within-Groups Feature Selection (WGFS), and Individual Feature Selection (IFS) meth-
ods. Furthermore, two different methods are introduced for evaluating system performances. Our systems
employ Interspeech 2011 Sleepiness Sub-Challenge’s “Sleepy Language Corpus” (SLC). The two tasks of
the wrapper-based method, the feature subset evaluation and the feature space search, are performed by the
Support Vector Machine classifier and a fast variant of the Best Incremental Ranked Subset algorithm, respec-
tively. BGFS considers the feature space in Low Level Descriptor (LLD) groups, an acoustically meaningful
division, allowing for significant reduction in time complexity of the computationally costly wrapper search
cycles. WGFS considers the feature space within each LLD and generates the feature subset comprised of
the best performing individual features among all LLDs. IFS regards the feature space individually. The best
classification performance is obtained by BGFS which also achieves improvement over the Sub-Challenge
baseline on the SLC test data.
1 INTRODUCTION
Sleep related driving accidents are widespread and
the urgency to prevent them underscores the consid-
erable value of sleepiness detection systems (Horne
and Reyner, 1995; Maycock, 1996; MacLean et al.,
2003; Flatley et al., 2004). The computational par-
alinguistics task of binary sleepiness classification
was presented as one of the two Interspeech 2011
Speaker State Sub-Challenges (Schuller et al., 2011).
The emerging field of computational paralinguistics
is concerned with ways in which words are spoken
rather than with the actual words themselves and at-
tempts to recognize the various states and traits of the
speakers (Schuller and Batliner, 2014). Speech-based
systems possess unique strengths in detection tasks
(Krajewski and Kr
¨
oger, 2007; H
¨
onig et al., 2014a;
H
¨
onig et al., 2014b) where other modes are non-
optimal or intrusive, e.g., a visual detection system in
poor lighting conditions and a spontaneous eye-blink
detection system requiring clipping of an infrared sen-
sor to the frame of an eyeglass (Caffier et al., 2003). In
addition, including a speech mode in multimodal ap-
plications can help enhance recognition performance.
Since 2009, the Interspeech paralinguistic set of chal-
lenges started to provide a standard feature set and
a predefined split of data into training, development,
and test sets to facilitate performance comparison
among excellent research (Schuller et al., 2009). The
Interspeech 2011 Sleepiness Sub-Challenge uses the
“Sleepy Language Corpus” (SLC) and employs the
openSMILE toolkit (Eyben et al., 2010) to extract the
baseline acoustic feature set.
On the one hand, the results of the Sub-Challenge
baseline show that increasing the size of the feature
set improves the classification performance (Schuller
et al., 2011). On the other hand, larger feature sets
potentially introduce irrelevant features that degrade
system performance. It seems, therefore, that choos-
ing a large feature set to start with and applying a fea-
ture selection method subsequently would be a rea-
sonable strategy for addressing the Sub-Challenge.
196
Pir, D., Brown, T. and Krajewski, J.
Automatic Driver Sleepiness Detection using Wrapper-Based Acoustic Between-Groups, Within-Groups, and Individual Feature Selection.
DOI: 10.5220/0006294501960202
In Proceedings of the 3rd International Conference on Vehicle Technology and Intelligent Transport Systems (VEHITS 2017), pages 196-202
ISBN: 978-989-758-242-4
Copyright © 2017 by SCITEPRESS – Science and Technology Publications, Lda. All rights reserved
We employ feature selection to reduce the high di-
mensionality of the provided feature space. Our use
of feature selection has two main goals. First, remov-
ing potentially irrelevant features could potentially
improve classification performance. Second, greatly
reduced resultant feature sets allow feature selection
to be used as a preprocessing step in a system that can
take advantage of further classification. The subse-
quent smaller feature sets enable the use of computa-
tionally intensive state-of-the-art classifiers, e.g., non-
linear Support Vector Machine (SVM) (Cortes and
Vapnik, 1995), that would not be practically feasible
otherwise.
There are two main methods for feature selec-
tion: the filter and the wrapper methods (Kohavi and
John, 1997). The filter method evaluates feature sub-
sets based on statistical properties of data, whereas
the wrapper method uses a classifier’s performance
score for the evaluation. The wrapper-based method,
employed by our systems, is operationally costly but
provides excellent performance results generally as it
uses the biases of the learning method in feature sub-
set evaluation (Ng, 1998; Ruiz et al., 2006). For our
systems, the two tasks of the wrapper-based method,
the feature subset evaluation and the feature space
search, are performed by the SVM classifier and a
fast variant of the Best Incremental Ranked Subset
(BIRS) algorithm, respectively. We use the same clas-
sifier employed by the official Sub-Challenge base-
line to achieve the comparability of results goal. The
fast linear BIRS search algorithm is used to render the
computationally costly space search more tractable.
Acoustic features are obtained by the application
of functionals like arithmetic mean and standard de-
viation, on the chunk level, to Low Level Descriptor
(LLD) contours like sum of the auditory spectrum or
RMS energy (Schuller et al., 2009; Weninger et al.,
2013). We evaluate the classification performance of
LLD-based based Between-Groups Feature Selection
(BGFS), Within-Groups Feature Selection (WGFS),
and Individual Feature Selection (IFS) systems and
compare their time complexity and dimensionality re-
duction aspects. BGFS Considers the feature space in
groups, represented by LLDs, rather than individually
(Pir and Brown, 2015). WGFS regards the feature
space within single LLDs and produces the feature
subset as the collection of the best performing indi-
vidual acoustic features from among all LLDs. The
feature space is considered individually by IFS.
This paper contains, to the best of our knowl-
edge, the following main novel points in the context
of paralinguistics tasks. First, the classification per-
formance comparison between group and individual
acoustic feature selection is novel. Second, WGFS
is a novel method. Finally, a novel combination of
classification measures and aspects is used for perfor-
mance evaluation.
This paper is organized as follows. Section 2 de-
scribes the BIRS search algorithm and discusses the
background on BGFS and its previous applications.
Section 3 describes the classification test-bed and the
corpus. Section 4 provides details on the WGFS sys-
tem. Two classification performance measures are
presented and used for experimental evaluation in sec-
tion 5 followed by the conclusion and suggested fu-
ture work in section 6.
2 BACKGROUND
2.1 BIRS Search
BIRS (Ruiz et al., 2006) is a two-step linear forward
search algorithm. In the first or ranking step, the fea-
tures are ranked according to their evaluation score.
In the second or feature subset selection step, we start
with an empty feature subset and visit every feature
in the ranked subset obtained in the first step. The
feature subset selects a feature if its inclusion leads to
a Unweighted Average Recall (UAR) score, an accu-
racy measure, that is higher than the previous value,
by a threshold level T. The T parameter can be nega-
tive, near 0, or positive, corresponding to systems that
operate in weak, neutral, or strong dimensionality re-
duction modes, respectively. Cross-validation and t-
test are not performed in our fast version of the algo-
rithm. Algorithm 1 depicts the details of the feature
subset selection step for the BGFS system, which re-
gards the feature space in groups.
Algorithm 1: Wrapper-based BGFS by BIRS.
Input Groups: labeled training set LLDs, C: classi-
fier, T: threshold
Output Subset, BestUAR
1: RankedGroups ← Rank(Groups,C)
2: Subset ← {}
3: BestUAR ← 0
4: for each Group ∈ RankedGroups do
5: TempSet ← Subset ∪ Group
6: UAR ← WrapperClassify (TempSet,C)
7: if UAR − BestUAR > T then
8: Subset ← TempSet
9: BestUAR ← UAR
10: end if
11: end for
Automatic Driver Sleepiness Detection using Wrapper-Based Acoustic Between-Groups, Within-Groups, and Individual Feature Selection
197

2.2 Wrapper-Based BGFS by BIRS
BGFS considers the feature space in groups rather
than individually. This is motivated by two fac-
tors. First, group-based approach reduces the time
complexity of the subset search component rendering
the computationally intensive problem more tractable
(Pir and Brown, 2015). The time complexity of BGFS
is k ∗2 evaluation cycles, where k = 118 is the number
of LLD-based groups. This is a substantial reduction
compared to the N ∗2 evaluation cycles of IFS, where
N = 4368 is the number of individual features. Sec-
ond, using an LLD-based group feature search instead
of a detailed and overfitting-prone individual feature
search could potentially enhance the generalization
power of the method (Pir et al., 2016).
2.3 Previous Applications of BGFS
BGFS was employed in Interspeech 2015 Compu-
tational Paralinguistics Challenge’s Eating Condition
Sub-challenge (Schuller et al., 2015) and achieved a
3% relative UAR performance improvement over the
baseline on test data. The best performing system em-
ployed the BIRS Variant algorithm which combined
BIRS and Rank search algorithms into one (Pir and
Brown, 2015). The algorithm was designed to remove
only the worst performing feature group(s) and used a
negative threshold parameter in the subset evaluation
of the space search corresponding to weak dimension-
ality reduction mode. Best performance was achieved
by removing only 1 out of 130 feature groups. The
aim of the system was to improve performance alone.
In this paper, aside from attempting to improve per-
formance, we are interested in achieving meaningful
dimensionality reduction and will therefore use the
neutral and strong dimensionality reduction modes
in performing feature subset evaluation. BGFS was
also used for sleepiness classification in noisy envi-
ronments (Pir et al., 2016).
3 CLASSIFICATION TEST-BED
AND CORPUS
3.1 Classification Test-Bed
The official Sub-Challenge and all of our systems use
WEKA’s (Hall et al., 2009) SVM implementation,
Sequential Minimal Optimization (SMO), with lin-
ear Kernel setting for classification and WEKA’s Syn-
thetic Minority Over-sampling Technique (SMOTE)
(Chawla et al., 2002) implementation for balancing
the number of instances in the development sets.
The openSMILE toolkit is used to generate the
4368 baseline features that include those identified as
relevant to the task (Dhupati et al., 2010), resulting
in a 70.3% UAR baseline score. The UAR measure
compensates for imbalance between the instances of
the two classes (Schuller et al., 2011).
3.2 Corpus
SLC consists of 21 hours of realistic car and lecture-
room environment speech recordings of 99 subjects.
Microphone-to-mouth distance of 0.3 m recordings
are down-sampled from 44.1 kHz to 16 kHz and use
16 bit quantization (Schuller et al., 2011).
The well established Karolinska Sleepiness Scale
(KSS) measure (Shahid et al., 2012) was used in self-
assessments plus two additional observer assessments
for reporting sleepiness levels 1 through 10. Levels
less than or equal to 7.5 correspond to a non-sleepy
state and those greater than 7.5 to a sleepy one.
4 METHOD
4.1 Wrapper-Based WGFS by BIRS
WGFS approach considers the feature space within
each LLD and produces the feature subset by com-
bining the best performing individual features from
every LLD as detailed in Algorithm 2. The LLD par-
titioning in this method does not reduce the number
Algorithm 2: Wrapper-based WGFS by BIRS.
Input Groups: labeled training set LLDs, C: classi-
fier, T: threshold
Output Subset, BestUAR
1: Subset ← {}
2: BestUAR ← 0
3: for each G ∈ Groups do
4: RankedFeatures ← Rank(G,C)
5: GroupSubset ← {}
6: BestGroupUAR ← 0
7: for each Feature ∈ RankedFeatures do
8: TempSet ← GroupSubset ∪ Feature
9: UAR ← WrapperClassify (TempSet,C)
10: if UAR − BestUAR > T then
11: GroupSubset ← TempSet
12: BestGroupUAR ← UAR
13: end if
14: end for
15: Subset ← Subset ∪ GroupSubset
16: end for
17: BestUAR ← WrapperClassify (Subset,C)
VEHITS 2017 - 3rd International Conference on Vehicle Technology and Intelligent Transport Systems
198
of the evaluation cycles and, consequently, the time
complexity of WGFS is N ∗2 evaluation cycles, where
N is the number of individual features.
4.2 Wrapper-Based IFS by BIRS
The IFS system is identical to the already described
BGFS system with the exception that features are con-
sidered individually and not in groups. IFS has the
same time complexity as WGFS.
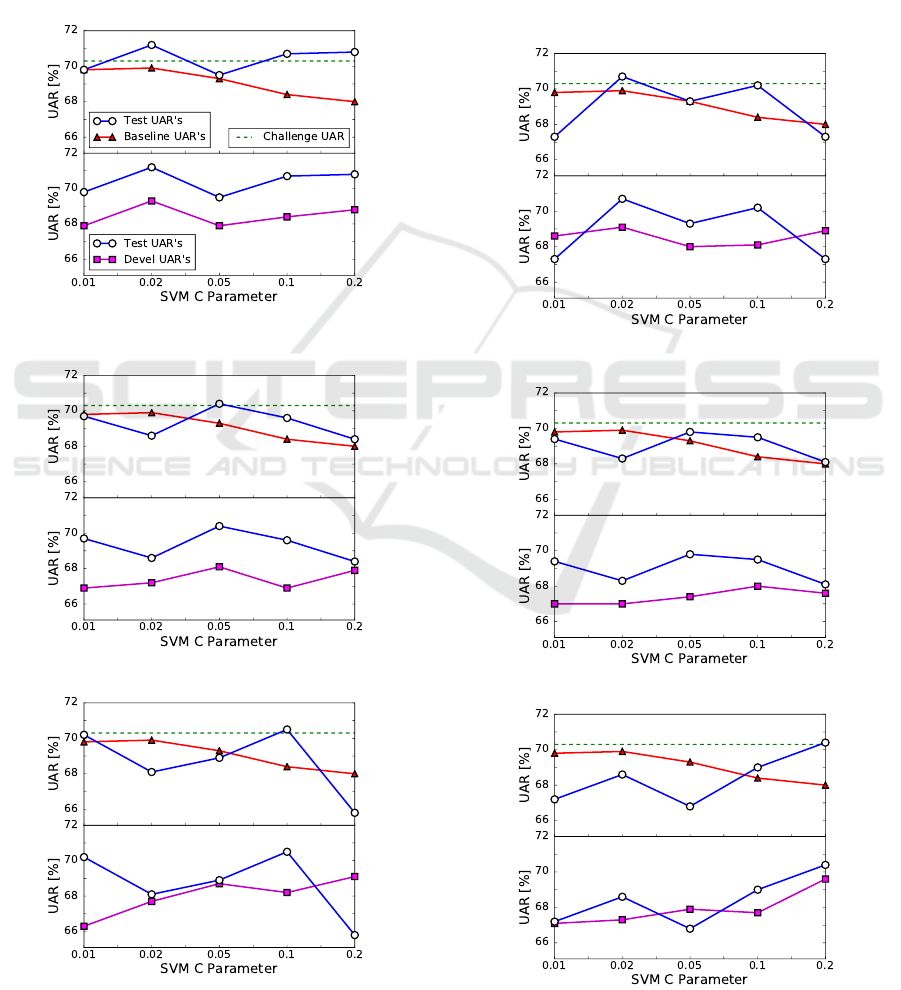
Figure 1: Results for BGFS, T = 0.1.
Description is given in Section 5.1.
Figure 2: Results for WGFS, T = 0.1.
Figure 3: Results for IFS, T = 0.1.
5 EXPERIMENTAL EVALUATION
5.1 Performance Measures
The five SVM Complexity (C) parameter values em-
ployed in the official Sub-Challenge: 0.01, 0.02, 0.05,
0.1, and 0.2 (Schuller et al., 2011) are also used by
our systems. We present two measures to evaluate
our system performances.
The first measure, M
1
, represents the total per-
formance gain and is calculated as the difference
Figure 4: Results for BGFS, T = ε, where
ε = 10
−6
.
Figure 5: Results for WGFS, T = ε.
Figure 6: Results for IFS, T = ε.
Automatic Driver Sleepiness Detection using Wrapper-Based Acoustic Between-Groups, Within-Groups, and Individual Feature Selection
199
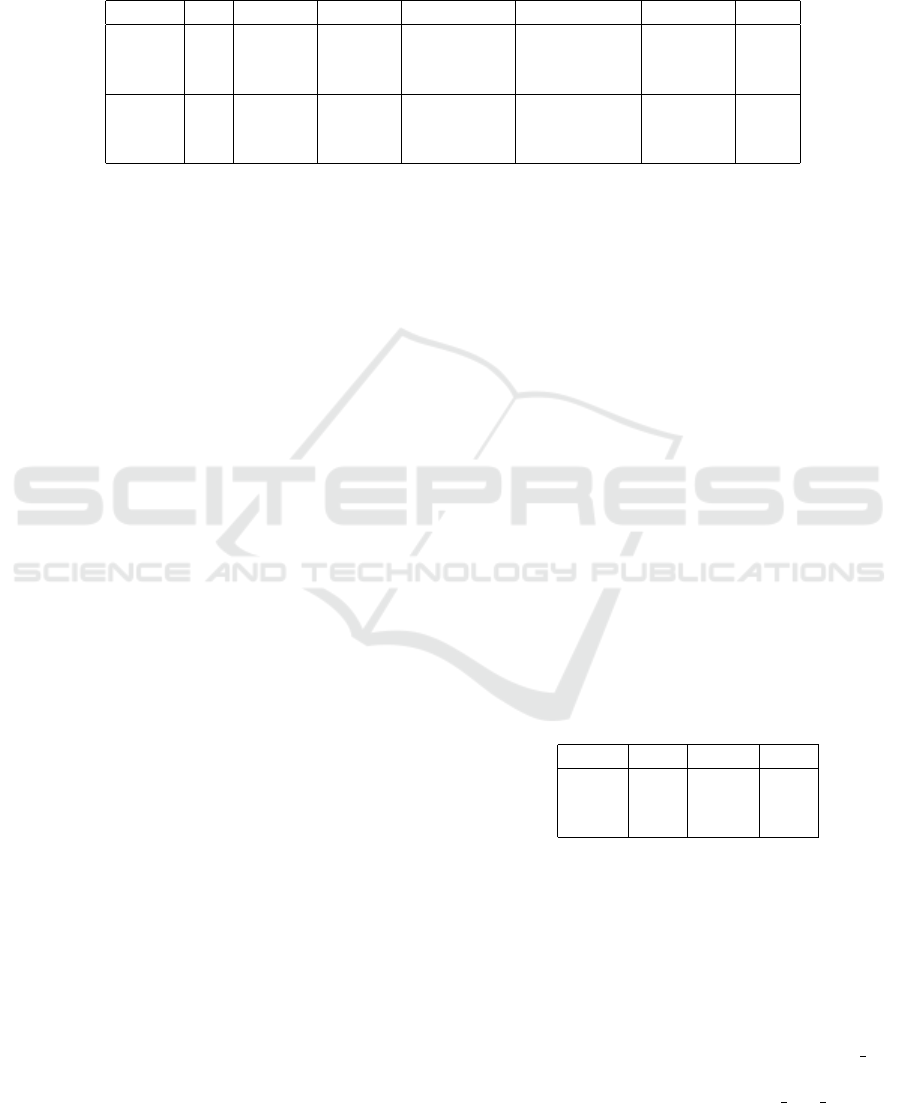
Table 1: Classification results on test data. Sys: System type. T: Threshold level. M
1
and M
2
: Two performance measures
in % given by Formulas 1 and 2, respectively. TimeComp: Time complexity in wrapper evaluation cycles. DimRed: Dimen-
sionality reduction shows the ratio of the number of features selected to the total number of features in % used by the system
whose UAR is displayed under ”Best”. Best: UAR in % achieved on test data using parameters of best performing system
trained on development data. ↑ BL: Number of UAR results (of 5) that surpass the official Sub-Challenge baseline. The best
performances and smallest time complexities are depicted in bold.
Sys T M
1
[%] M
2
[%] TimeComp DimRed [%] Best [%] ↑ BL
BGFS 0.1 6.6 9.7 118 * 2 16.9 71.2 3
WGFS 0.1 1.3 9.7 4368 * 2 10.3 70.4 1
IFS 0.1 -1.9 3.5 4368 * 2 0.7 65.8 1
BGFS ε -0.6 2.1 118 * 2 25.4 70.7 1
WGFS ε -0.3 8.1 4368 * 2 10.5 69.5 0
IFS ε -3.4 2.4 4368 * 2 1.7 70.4 1
between the sum of the performances between the
BGFS system (T = 0.1) and our baseline system, both
operating on test data,
M
1
=
5
∑
n=1
UAR
(T )
n
−
5
∑
n=1
UAR
(BL)
n
, (1)
where UAR
(T )
and UAR
(BL)
, displayed in the top
part of Figure 1, represent UAR results of the BGFS
(T = 0.1) system and our baseline system on test data,
respectively. Our baseline system uses a setup simi-
lar to the official baseline experiment. Our baseline
result for C = 0.02 is slightly lower than that of the
official baseline (depicted by dotted line in Figure 1).
This may be partly due to differences in preprocess-
ing operations. The x-scale in Figure 1 is drawn with
equidistant C parameters for clarity of presentation.
The second measure, M
2
, reflects the generaliza-
tion power of the system, given by the difference be-
tween the sum of the performances on test and devel-
opment data,
M
2
=
5
∑
n=1
UAR
(T )
n
−
5
∑
n=1
UAR
(D)
n
, (2)
where UAR
(T )
and UAR
(D)
, shown in the bottom
part of Figure 1, represent UAR results of the BGFS
(T = 0.1) system on test and development data, re-
spectively. We note that the BGFS (T = 0.1) system
results shown in the bottom part of Figure 1 is the
same as those shown in the top part.
Figures 2 and 3 depict the results obtained by
WGFS and IFS in place of BGFS, using the same
T = 0.1 threshold. The Legends are the same as in
Figure 1 and are therefore not duplicated. Figures
4, 5, and 6 display the outcomes of the same sys-
tems as in Figure 1, 2, and 3, respectively, with the
exception that the threshold level used is changed to
T = ε = 10
−6
.
5.2 Best Performing System
Table 1 shows the two performance measures and
other statistics of our systems using neutral and strong
reduction modes. The strong reduction mode (T =
0.1) BGFS system outperforms the other systems in
both performance measures and has the highest UAR
score (71.2%), the highest number (3 of 5) of results
surpassing the official baseline, and the smallest time
complexity. In addition, it is the only system where
none of the C parameters result in a score lower than
that of our baselines.
Test data classification results that surpass the of-
ficial baseline, 70.3% UAR, obtained by our best per-
forming system’s 3 best results on development data
are displayed in Table 2. Our best result achieves
1.3% relative UAR improvement over the official
baseline.
Table 2: Test data classification results that surpass the
official baseline, obtained by our best performing system
(BGFS, T = 0.1) on development data. Devel: UAR in %
on development data. C: C parameter used. nLLD: Number
of LLDs selected (of 118) where each LLD represents one
group feature. Test: UAR in % on test data.
Devel C nLLD Test
69.3 0.02 20 71.2
68.8 0.2 13 70.8
68.4 0.1 16 70.7
5.3 Selected Group Features
The LLD-based group features selected by our best
performing system (BGFS, T = 0.1) are listed in Ta-
ble 3.
The selected LLD-based group features are com-
prised of types: MFCC, RASTA filtered auditory spec-
trum, spectral roll-off points, and jitter. The
sma
suffix indicates that smoothing by moving average has
been performed on the LLD and the sma de suffix
represents the first order delta of the smoothed LLD.
VEHITS 2017 - 3rd International Conference on Vehicle Technology and Intelligent Transport Systems
200
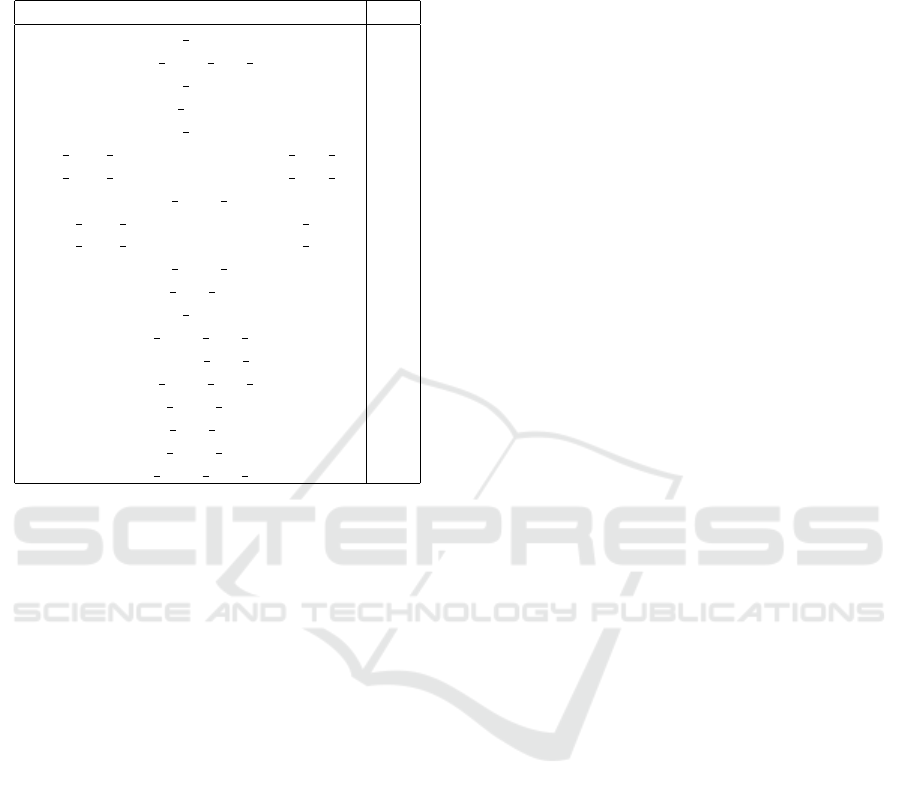
Table 3: List of LLD-based groups selected by our best
performing system. LLD: Name of LLD-based group. R:
Rank of the group in the list of 118 ranked group features.
The ranking is based on UAR scores, from high to low.
LLD R
m f cc sma[1] 1
audSpec R f ilt sma de[9] 2
m f cc sma[3] 3
m f cc sma[10] 4
m f cc sma[5] 6
pcm Mag spectralRollO f f 75.0 sma de 8
pcm Mag spectralRollO f f 90.0 sma de 10
audSpec R f ilt sma[9] 12
pcm Mag spectralRollO f f 90.0 sma 16
pcm Mag spectralRollO f f 25.0 sma 34
audSpec R f ilt sma[3] 40
m f cc sma de[3] 66
m f cc sma[8] 67
audSpec R f ilt sma de[15] 70
jitterLocal sma de 79
audSpec R f ilt sma de[2] 93
audSpec R f ilt sma[20] 97
m f cc sma de[7] 105
audSpec R f ilt sma[21] 111
audSpec R f ilt sma de[23] 115
The number inside the square bracket denotes the or-
dered position of the element within the set. Detailed
information about acoustic LLD groups is given in
(Eyben, 2016). Domain expert knowledge has been
used to generate the acoustic baseline feature set. The
results obtained by our data-driven feature selection
method may, in turn, provide further insight on rele-
vant features to the domain experts. We note that our
systems using other classifier and threshold parame-
ters, which select different group feature subsets, may
potentially obtain other equally high performance re-
sults.
5.4 Comparison with Interspeech 2011
Sleepiness Sub-Challenge Results
We discuss the relative importance of our perfor-
mance improvement by comparing it with already ob-
tained results. The Interspeech 2011 Sleepiness Sub-
Challenge authors provide the results reported by the
six accepted papers in (Schuller et al., 2014) and men-
tion that the baseline was highly competitive. Three
of the six performance results were below the official
baseline and the other three obtained scores of 71.0%,
71.3%, and 71.7% UAR. A UAR of 72.3%, which
is 2% higher than the official baseline, is required
to achieve a significant improvement at an α = 0.05
level in a one-tailed significance test (Schuller et al.,
2014). The size of the test set is 2808. Larger
datasets could potentially provide further information
on the significance degree of the performance results.
A state-of-the-art result of 71.9% UAR, reported in
(H
¨
onig et al., 2014a), uses a smaller data subset and
cannot be used for direct result comparison. In light
of the results given above, our performance of 71.2%
UAR is competitive especially considering that our
method is performed as a preprocessing step and im-
provement may still be achieved using further classi-
fication.
6 CONCLUSIONS AND FUTURE
WORK
In this paper, we employ the wrapper-based acoustic
BGFS system for automatic sleepiness classification
and develop two measures for comparing its perfor-
mance results on the SLC test data against two other
systems that use the WGFS and IFS methods. All sys-
tems are evaluated with neutral and strong dimension-
ality reduction modes. The BGFS system achieves
notable dimensionality reduction as well as best per-
formances in both measures using a threshold level of
0.1. The three best performing BGFS systems show
improvement over the official Sub-Challenge base-
line. Moreover, the BGFS system has substantially
smaller time complexity compared with the other sys-
tems, rendering the computationally intensive wrap-
per method more tractable.
Future work includes developing a spoken dialog
system that interacts with drivers and monitors their
sleepiness state. Additionally, using training data col-
lected for a specific driver, a speaker-dependent sys-
tem can be developed to further enhance the classifi-
cation performance.
REFERENCES
Caffier, P. P., Erdmann, U., and Ullsperger, P. (2003). Ex-
perimental evaluation of eye-blink parameters as a
drowsiness measure. European Journal of Applied
Physiology, 89(3-4):319–325.
Chawla, N. V., Bowyer, K. W., Hall, L. O., and Kegelmeyer,
W. P. (2002). Smote: synthetic minority over-
sampling technique. Journal of artificial intelligence
research, pages 321–357.
Cortes, C. and Vapnik, V. (1995). Support-Vector Networks.
Machine Learning, 20(3):273–297.
Dhupati, L. S., Kar, S., Rajaguru, A., and Routray, A.
(2010). A novel drowsiness detection scheme based
on speech analysis with validation using simultaneous
Automatic Driver Sleepiness Detection using Wrapper-Based Acoustic Between-Groups, Within-Groups, and Individual Feature Selection
201

eeg recordings. In Automation Science and Engineer-
ing (CASE), 2010 IEEE Conference on, pages 917–
921. IEEE.
Eyben, F. (2016). Real-time speech and music classification
by large audio feature space extraction. Springer.
Eyben, F., W
¨
ollmer, M., and Schuller, B. (2010). opens-
mile: The munich versatile and fast open-source audio
feature extractor. In Proceedings of the international
conference on Multimedia, pages 1459–1462. ACM.
Flatley, D., Reyner, L., and Horne, J. A. (2004). Sleep re-
lated crashes on sections of different road types in the
UK (1995-2001). Department for Transport.
Hall, M., Frank, E., Holmes, G., Pfahringer, B., Reutemann,
P., and Witten, I. H. (2009). The weka data min-
ing software: an update. ACM SIGKDD explorations
newsletter, 11(1):10–18.
H
¨
onig, F., Batliner, A., Bocklet, T., Stemmer, G., N
¨
oth, E.,
Schnieder, S., and Krajewski, J. (2014a). Are men
more sleepy than women or does it only look like–
automatic analysis of sleepy speech. In 2014 IEEE In-
ternational Conference on Acoustics, Speech and Sig-
nal Processing (ICASSP), pages 995–999. IEEE.
H
¨
onig, F., Batliner, A., N
¨
oth, E., Schnieder, S., and Kra-
jewski, J. (2014b). Acoustic-prosodic characteristics
of sleepy speech – between performance and interpre-
tation. In Proc. of Speech Prosody, pages 864–868.
Horne, J. A. and Reyner, L. A. (1995). Sleep related vehicle
accidents. Bmj, 310(6979):565–567.
Kohavi, R. and John, G. H. (1997). Wrappers for feature
subset selection. Artificial intelligence, 97(1–2):273–
324.
Krajewski, J. and Kr
¨
oger, B. J. (2007). Using Prosodic
and Spectral Characteristics for Sleepiness Detection.
In INTERSPEECH 2007 – 8
th
Annual Conference of
the International Speech Communication Association,
August 27-31, Antwerp, Belgium, Proceedings, pages
1841–1844.
MacLean, A. W., Davies, D. R., and Thiele, K. (2003). The
hazards and prevention of driving while sleepy. Sleep
medicine reviews, 7(6):507–521.
Maycock, G. (1996). Sleepiness and driving: the experi-
ence of uk car drivers. Journal of Sleep Research,
5(4):229–237.
Ng, A. Y. (1998). On feature selection: Learning with ex-
ponentially many irrelevant features as training exam-
ples. In Proceedings of the Fifteenth International
Conference on Machine Learning, ICML ’98, pages
404–412.
Pir, D. and Brown, T. (2015). Acoustic Group Feature Se-
lection Using Wrapper Method for Automatic Eating
Condition Recognition. In INTERSPEECH 2015 –
16
th
Annual Conference of the International Speech
Communication Association, September 6-10, 2015,
Dresden, Germany, Proceedings, pages 894–898.
Pir, D., Brown, T., and Krajewski, J. (2016). Wrapper-
Based Acoustic Group Feature Selection for Noise-
Robust Automatic Sleepiness Classification. In Pro-
ceedings of the 4
th
International Workshop on Speech
Processing in Everyday Environments (CHiME 2016),
September 13, 2016, San Francisco, CA, USA, pages
78–81.
Ruiz, R., Riquelme, J. C., and Aguilar-Ruiz, J. S. (2006).
Incremental wrapper-based gene selection from mi-
croarray data for cancer classification. Pattern Recog-
nition, 39(12):2383–2392.
Schuller, B. and Batliner, A. (2014). Computational par-
alinguistics: emotion, affect and personality in speech
and language processing. John Wiley & Sons.
Schuller, B., Steidl, S., and Batliner, A. (2009). The IN-
TERSPEECH 2009 Emotion Challenge. In INTER-
SPEECH 2009 – 10
th
Annual Conference of the Inter-
national Speech Communication Association, Septem-
ber 6–10, 2009, Brighton, UK, Proceedings, pages
312–315.
Schuller, B., Steidl, S., Batliner, A., Schiel, F., and Kra-
jewski, J. (2011). The INTERSPEECH 2011 Speaker
State Challenge. In INTERSPEECH 2011 – 12
th
An-
nual Conference of the International Speech Commu-
nication Association, August 28–31, 2011, Florence,
Italy, Proceedings, pages 3201–3204.
Schuller, B., Steidl, S., Batliner, A., Schiel, F., Krajewski,
J., Weninger, F., and Eyben, F. (2014). Medium-term
speaker statesa review on intoxication, sleepiness and
the first challenge. Computer Speech & Language,
28(2):346–374.
Schuller, B. W., Steidl, S., Batliner, A., Hantke, S., H
¨
onig,
F., Orozco-Arroyave, J. R., N
¨
oth, E., Zhang, Y.,
and Weninger, F. (2015). The INTERSPEECH 2015
Computational Paralinguistics Challenge: Nativeness,
Parkinson’s & Eating Condition. In INTERSPEECH
2015 – 16
th
Annual Conference of the International
Speech Communication Association, September 6-10,
2015, Dresden, Germany, Proceedings, pages 478–
482.
Shahid, A., Wilkinson, K., Marcu, S., and Shapiro, C. M.
(2012). Karolinska sleepiness scale (kss). In STOP,
THAT and One Hundred Other Sleep Scales, pages
209–210. Springer.
Weninger, F., Eyben, F., Schuller, B., Mortillaro, M., and
Scherer, K. (2013). On the acoustics of emotion in au-
dio: What speech, music, and sound have in common.
Frontiers in psychology, 4:227–239.
VEHITS 2017 - 3rd International Conference on Vehicle Technology and Intelligent Transport Systems
202
