
GIS Open Source Application as a Support to a Hospital
Morbidity Database
Hospital GIS
Lia Duarte
1,2
, Ana Cláudia Moreira Teodoro
1,2
and Alberto Freitas
3
1
Department of Geosciences, Environment and Land Planning, Faculty of Sciences, University of Porto, Porto, Portugal
2
Earth Sciences Institute (ICT), Faculty of Sciences, University of Porto, Porto, Portugal
3
Center for Health Technology and Services Research (CINTESIS), Faculty of Medicine, University of Porto,
Porto, Portugal
Keywords: GIS, Open Source, Hospital Morbidity Database, Administrative Data, PostGIS.
Abstract: Geographical Information Systems (GIS) capabilities are increasing in health area. GIS have been used to
investigate global health studies due to the huge capabilities to manipulation, storage, management, analysis,
modelling and mapping of geographical data. A simple and intuitive graphic interface to represent spatially
an administrative database information would be a great usefulness to the health community. In this work, an
open source application was developed in Python language under a GIS open source software (QGIS). The
application, incorporated in GIS software, is composed by two tabs: Symbology and Mapping. In order to test
the developed application, a zone from Porto Metropolitan Area and a database with administrative data,
hospital morbidity database, was considered. This data was previously added to PostGIS (an open source
database) and automatically connected to the application. The difficulty of health professionals in the creation
of multiple visualizations of tabular data defined by rigorous position, and the maps creation to later analysis
and printing, can be overcome with this application. The large amount of data requires the connection to a
free database in GIS environment enhancing the practical applicability, rapid, safe and efficient data
representation.
1 INTRODUCTION
Spatial epidemiology is the study of geographical
variation in disease risk or incidence (Kelen et al.,
2012). In 1854, John Snow created the first map
relating environmental factors in order to investigate
the base of cholera deaths (Snow, 1855). Nowadays,
Geographical Information Systems (GIS) capabilities
are increasing in health area. GIS have been used to
investigate global health studies due to the huge
capabilities to manipulation, storage, management,
analysis, modelling and mapping of geographical
data. GIS presented new opportunities for researchers
providing the tools required for exploring the
geographic variation in disease risk relating the
geographically indexed health events with
demographic, environmental, behavioural,
socioeconomic and genetic risk factors (Zhang et al.,
2016). The spatial epidemiology takes advantage of
GIS tools combined with Remote Sensing (RS) to
enhance accessibility to spatial data and to measure
the spatial-temporal variation in disease risks (Kelen
et al., 2012; Jeong et al., 2016). For example, Zhang
et al. (2016) review and analyse the types of spatial
measurement errors more commonly encountered
during spatial epidemiological analysis of spatial data
combining GIS, RS, Global Positioning Systems
(GPS) and statistical methodologies. In order to
perform GIS spatial-temporal analysis, other study
conducted by Shiode et al. (2015), prepares their own
data on the estimated number of residents at each
house location along with the space-time data of the
victims. Several studies applied to health spatial-
analysis were performed using GIS tools (Gómez-
Barroso et al., 2016; Ferguson et al., 2016;
Ruktanonchai et al., 2014; Ayres-Sampaio et al.,
2014; Sadler, 2016; Jeong et al., 2016; Makanga et
al., 2016; Panciera et al., 2016). Unfortunately, all
these studies are mainly focused on applying GIS
tools under proprietary software. Other works used
GIS under web environment used PostGIS databases
Duarte, L., Teodoro, A. and Freitas, A.
GIS Open Source Application as a Support to a Hospital Morbidity Database - Hospital GIS.
DOI: 10.5220/0006268901690176
In Proceedings of the 3rd International Conference on Geographical Information Systems Theory, Applications and Management (GISTAM 2017), pages 169-176
ISBN: 978-989-758-252-3
Copyright © 2017 by SCITEPRESS – Science and Technology Publications, Lda. All rights reserved
169

and open servers (Moncrieff et al., 2014; Smith and
Hayward, 2016; Bui and Pham, 2016).
Some GIS applications were developed under free
and open source software such as OpenJump (Fisher
and Myers, 2011) and a new open source tool,
openModeller was created (Muñoz et al., 2011).
There is not an open source application under
QGIS software developed specifically with the
purpose of spatially representing a huge amount of
data storage in a database, and automatically
symbolize and create a map. An open source
application allowing health experts or common users
(not familiarized with GIS environment) to represent
spatially the database information, with a simple and
intuitive graphic interface, would be a great
usefulness to the health community. This research
was addressed to health experts who handle with
spatial geographic data in scientific research field
improving the GIS analysis capabilities in health
spatial information field.
The objective of this work is the development of
a GIS open source application which allows: (i) to
automatically connects to a database in order to
access the (huge amount of) data; (ii) to create maps
for printing with information provided by a database;
(iii) to automatize the vector files symbology:
graduated or categorized; (iv) to connects to Bing
Aerial Maps in GIS environment in order to overlap
the database information; (v) to create a polygon file
with the extension of the study area, and; (vi) to
convert a shapefile to Keyhole Markup Language
(KML) format. This application can be easily used to
improve the studies referred creating the required
maps with an easy connection to an open source
database.
This manuscript is divided into 5 sections:
Introduction, Methodology, Results, Discussion and
Conclusions. The Methodology section is divided
into PostGIS database subsection and Hospital GIS
subsection where are explained the API libraries
(QGIS and Python) used and the application
development.
2 METHODOLOGY
The application was developed under the GIS open
source software QGIS (QGIS, 2016). QGIS is an
open source software developed by Gary Sherman in
2002 which respects the Stallman four freedoms:
freedom to run the program for any purpose, to study
how the program works and modify it, to redistribute
copies and to distribute copies of modified versions
(Stallman, 2007). It is developed in C++ and
complemented with Python extensions or plugins.
QGIS presents several advantages in the plugins
development using Python language, as it had several
libraries to use. Python language is also an open
source language, interpreted, high level, and object
oriented language (Python, 2016). Several libraries
and Application Programming Interfaces (API’s)
were used. QGIS has its own API’s such as QGIS
API, Geospatial Data Abstraction Library
(GDAL)/OGR API and PyQt4 API (PyQt4, 2016;
QGIS API, 2016; GDAL, 2016) and it supports vector
files, raster formats and spatial databases (e.g.,
PotgreSQL and PostGIS; QGIS, 2016). The APIs are
composed by modules, classes and functions which
help to connect the graphic interfaces with the spatial
information manipulation. With the implementation
and use of the algorithms provided by QGIS software,
this application improves the using of GIS
functionalities and connection to databases with
multiple data using a simple and intuitive interface.
2.1 PostGIS Database
PostgreSQL is a Relational Database Management
System (RDBMS) which manages data stored with
relationships. PostGIS is a GIS spatial database which
adds spatial support to PostgreSQL and follows the
interoperability standards from Open Geospatial
Consortium (OGC; PostGIS, 2016). It is open source
and is available through GNU General Public License
(GLP) license. PostGIS supports specified geometries
from OGC: point and polygon, and supports
geographic objects allowing their location through
SQL (SQL, 2016). SQL language is a standard
universal language used in the database manipulation
through RDBMS and allowing several tasks such as
insertion, modification and object creation, user
management, information query, among others. The
most common operation in SQL, the query, makes
use of the declarative SELECT statement which
retrieves data from one or more tables or expressions.
In the work presented, the SELECT command was
used to database queries (SQL language, 2016).
2.2 Hospital GIS
The aim of this work was the creation of HospitalGIS
application which allows to relate the database
information in an intuitive and simple way. The
graphic interface was created through Qt Designer
and all the configurations were applied automatically.
The application is composed by a button added to
QGIS tools.
GISTAM 2017 - 3rd International Conference on Geographical Information Systems Theory, Applications and Management
170
Through the mouse click in the button, a dock
widget opened as a panel incorporated in QGIS
environment in a way that the user can obtain
information from the data visualization. Figure 1
presents the button and the HospitalGIS graphic
interface.
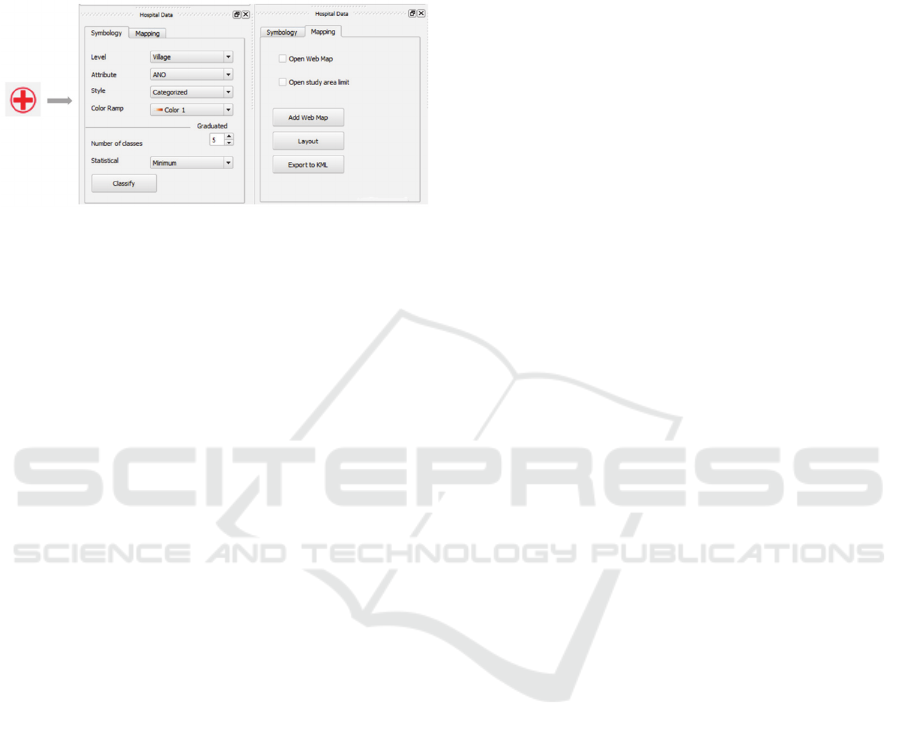
Figure 1: HospitalGIS graphical button and graphic
interface.
HospitalGIS is composed by two tabs with
different functionalities: Symbology and Mapping.
The first one is composed by the symbology
parameters regarding the maps and presents four
combo boxes: the information level (village,
municipality, district, Nomenclatura das Unidades
Territoriais para Fins Estatísticos (NUTS II)
residential, NUTS II hospital, NUTS III residential,
NUTS III hospital); the attribute to visualize; the
symbology style according to the information type (it
can be Categorized when the attribute is discrete or
Graduated when the attribute is numeric); and finally
the ramp color. In Symbology tab, some parameters
from graduated classes are also presented, such as:
number of classes which the user can choose and the
statistical method which can be applied to the study
variable (minimum, maximum, average, mode and
standard deviation). The labels (text) defined in the
combo box Attribute are automatically defined from
the village shapefile attribute table. This shapefile is
automatically incorporated in the application. The
other combo boxes were created with predefined
styles according to the symbology type (Categorized
or Graduated). The color ramp was assigned with a
set of colors and added to the respective color ramp.
The number of classes is defined with value 5, by
default, but can be modified by the user.
The Mapping tab incorporates the auxiliary
cartography and contains several functionalities to
add other types of maps or creation of maps for
printing. The tab is composed by two check boxes and
three buttons. The check boxes allow the addition of
an interactive map from Bing Aerial Maps (Open
Web Map) and the possibility of adding the extension
zone shapefile, so the user can verify the delimited
extension (Open study area limit). These options can
be performed after the map symbology. The user can
create a map for printing (Layout) with the
symbolized map and export the shapefile to kml
format to verify the result through Google Earth or
Google Maps (Export to KML).
2.2.1 API libraries (QGIS and Python)
QGIS API or PyQGIS allows to virtually control the
QGIS graphic environment and it is based on QGIS
C++ API divided by five categories: Core, GUI,
Analysis, Map Composer and Network Analysis
(QGIS API, 2016). The PyQt4 API is composed by
several Python modules developed for Qt framework.
This is a multiplatform framework composed by a set
of C++ libraries built to the development of graphic
interfaces, Structured Query Language (SQL)
databases, Scalable Vector Graphics (SVG), Open
Graphics Library (OpenGL), eXtensible Markup
Language (XML) and other configurations (PyQt4
API, 2016).
Processing Toolbox algorithms were also used in
the developed application. Processing Toolbox
belongs to QGIS and it is a framework composed by
a set of algorithms disposed in a tree (Sextante, 2016).
The algorithms belong to external applications with
geoprocessing capacities, such as System for
Automated Geoscientific Analyses (SAGA),
Geographic Resources Analysis Support System
(GRASS) or R (SAGA, 2016; GRASS, 2016; R,
2016). These algorithms were crucial to the
application development. The plugins development
follows a specified structure provided by QGIS
official page (QGIS, 2016): have an idea, create the
files required, write the code and test while writing,
and in the end publish the plugin in the official page.
Several scripts were developed according to the rules
defined. The graphic interface was created through
the Plugin Builder/Qt Designer extension which
configures all the files needed (Plugin Builder 2015;
Plugin Builder Documentation 2015). Widgets from
Qt API were created, such as combo boxes, check
boxes, push buttons, labels, edit lines, among others.
2.2.2 Application Development
The application architectureis presented in Fig.2. The
application was created based in two classes, the main
class (composed by 15 functions) and a class referred
to the kml conversion. Through the initGui function,
an automatic reading of hospital database is
performed to verify the existent attributes and add
them to the Attribute combo box. In this function the
GIS Open Source Application as a Support to a Hospital Morbidity Database - Hospital GIS
171
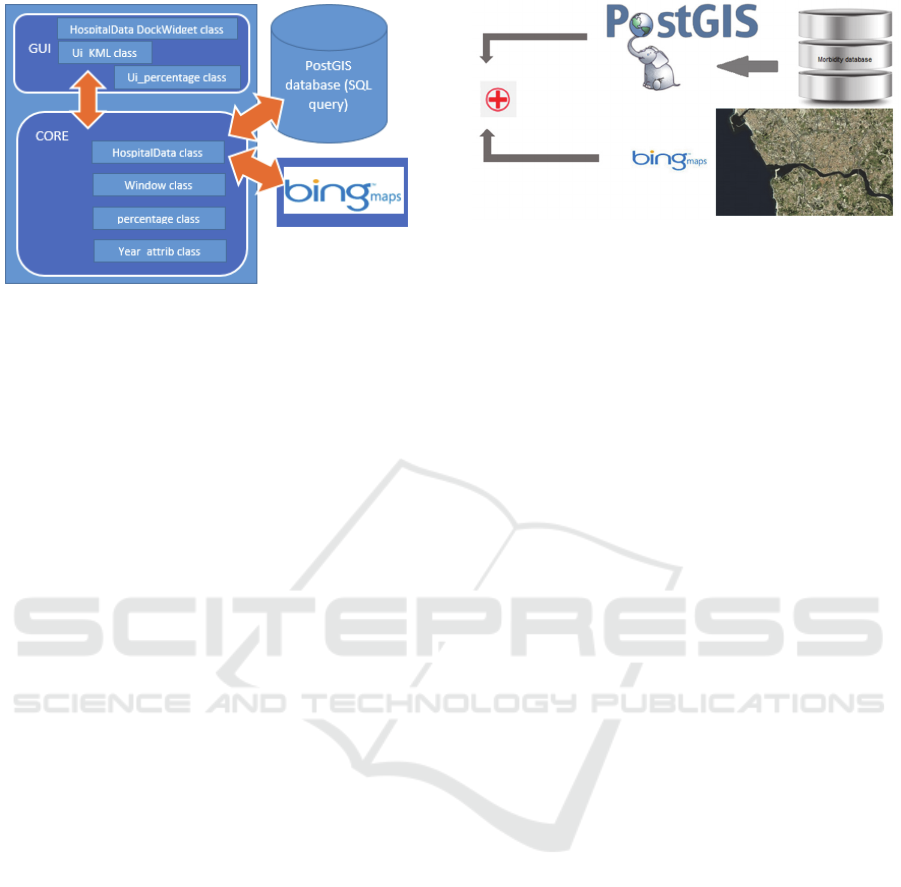
Figure 2: HospitalGIS architecture.
strings to the Level, Style and Color Ramp combo
boxes are also added, such as:
self.dockwidget.comboBox_2.addItems(['C
ategorized', 'Graduated'])
The Color Ramp combo box incorporates an
image. This image is considered as an icon, so QIcon
class was used. The buttons connections through the
clique action are also performed in this function. The
Classify function is called through the clique action
and incorporates the Categorized and Graduated
types of symbology. After that, if the check box Open
Web Map is activated, Bing Map is added to the QGIS
area and then the map is symbolized. If the
symbolization is Categorized,
symbology_categorized is called, and if is
Graduated, symbology_graduated function is called.
Symbology_categorized function connects to
PostGIS database through QGIS API classes which
stored components from the Uniform Resource
Identifier (URI) data source from
PostgreSQL/RDBMS. The structure stored the
information related to the database connection
including server, database, username and password,
scheme and, if exist, the SQL conditions. Then the
database connection is performed and consequently
opens. Through SQL language a code line was
created to join the shapefile and the database through
village code, municipality and district (dicofre), and
the attribute variable mode estimation to each village.
Figure 3 presents a schema with the connections
established.
In order to execute the SQL condition, the
pgsql2shp.exe application from PostgreSQL was
used. This application applies a SQL condition saving
the result into a new shapefile. The new shapefile
should contain two fields, the village name and the
statistical value (estimated) of the chosen variable to
Figure 3: HospitalGIS workflow presenting the
connections.
each village. QGIS functions were used to read these
functions. The second column (statistical variable) is
acquired to use in the symbology.
In the next step, all the occurrences of attribute
column, through a for cycle, were recorded in a new
list. Repeated elements were eliminated through the
set Python function. The categorized symbology
should be built through a specific dictionary with the
column values, the label and the associated color.
Finally the shapefile is added to QGIS environment.
If the Open study area limit check box is checked,
the extent function is used to zoom in the extension
area. Dissolve function from Processing Toolbox was
used to dissolve the extension zone in a unique
polygon and overlap the shapefile. Another condition
was added to verify if interactive map was selected.
If true, the shapefile (European Terrestrial Reference
System 1989 Portugal Transversal Mercator 2006 -
ETRS89 PTTM06; European Petroleum Survey
Group (EPSG): 3763) is projected to World Geodetic
System 1984 (WGS84) Pseudo Mercator
(EPSG:3857) through the QGIS reprojectlayer
algorithm. ETRS89 PTTM06 system is actually
mandatory in Portugal according to Infrastructure for
Spatial InfoRmation in Europe (INSPIRE) directive
(Inspire, 2015). Inspire directive has been in effect
since May 15th 2007. It is composed by several areas:
metadata, geographic data interoperability, network
services, data share, and coordination and monitoring
(Inspire, 2015). The WGS84 Pseudo Mercator
system, also nominated by Web Mercator, Google
Web Mercator, Spherical Mercator or WGS84 Web
Mercator, is the coordinate system used in web
mapping applications and it is associated to Google
Maps, Bing Maps, OpenStreetMap, Mapquest,
Mapbox among others (Web Mercator, 2015; Spatial
Reference, 2015; Spherical Mercator, 2015).
The symbology_graduated function is connected
to PostGIS database where the hospital information is
stored. Several if statements were defined with a SQL
condition according to the attribute and the statistical
GISTAM 2017 - 3rd International Conference on Geographical Information Systems Theory, Applications and Management
172
method chosen by the user. Table 1 presents an
example of a condition which relate the hospital
database with the study area shapefile through the
join operation. The statistic is saved and applied to the
chosen variable into a new shapefile. The following
command line present an example of a SQL
condition.
SELECT freguesia,
sum(totdias)/count(totdias), geom FROM
grande_porto LEFT OUTER JOIN
sample_reside_join ON
grande_porto.dicofre =
sample_reside_join.reside GROUP BY
freguesia, geom ORDER BY freguesia
The Layout button allows the automatic creation
of a map for printing and is connected to the layout
function. In this function, the following layout
elements are defined: title, legend, graphic scale and
north arrow. The shapefile projection system is
verified and if it is ETRS89 PT-TM06, the layout is
created. Other way, the shapefile is projected through
reprojectlayer algorithm. The legend and title are
composed through QgsComposerLegend and
QgsComposerLabel classes, respectively. The north
arrow is added as an image and corresponds to the
cartographic north. Finally, a graphic scale is
automatically created according to the coordinate
system defined. The result is saved in tif format
through the printPageAsRaster function.
The addMap function allows to add the Bing
interactive map to the QGIS environment. The user
can symbolize the shapefile after or before adding the
map.
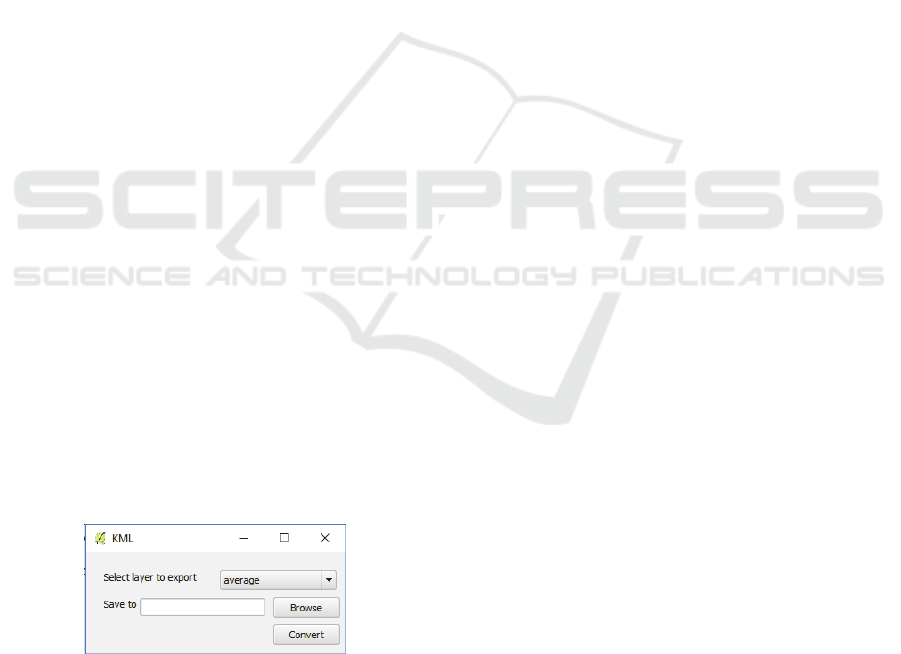
A new graphic interface to the kml conversion
was created. This action is performed when the user
clicks in Export to KML button. The QGIS
environment could have several shapefiles open, so
this graphic interface was created in order to give the
possibility to choose which file would be converted.
Figure 4 presents the graphic interface.
Figure 4: KML button graphic interface.
The new dialog box (Fig. 4) was created through
a new class Window. The function handleButton was
created, allowing to read all the vector files open in
QGIS environment, and to list the names adding them
to the combo box (Select layer to export). Also, in this
function, the Browse and Convert buttons
connections were defined, for the new kml file
directory and to convert the shapefile to kml format,
respectively. This process uses ogr2ogr algorithm
from GDAL/OGR library. This connection is
performed through the Python function subprocess.
3 RESULTS
In order to test the developed application, a zone from
Porto Metropolitan Area (PMA) and a database with
administrative data were used. These data were
previously added to PostGIS. The coordinate system
used was ETRS89 PT-TM06.
The national hospital morbidity database (an
administrative database, in PT, Morbilidade
Hospitalar, previously designated as Grupos de
Diagnóstico Homogéneo – GDH [in EN, Diagnosis
Related Groups]) is very often referred in the hospital
information system context. These databases are
composed by clinical-administrative data related to
hospital discharges (inpatient episodes, ambulatory
surgery and medic ambulatory) and other variables.
These administrative databases can contain incorrect
data and also data with some quality issues, but are
composed by data easily available, inexpensive and
frequently used. In some situations, it can be the only
available data to study a specified clinic question. It
can, for instance, be used as a quality indicators
production to the study and comparison of hospital
activities or in the study of relations between hospital
and environmental variables. In this context, GIS
tools can assume a focus to easily provide the
visualization and comparison of different outcomes
(hospitalization taxes, hospital morbidity) to certain
pathologies in time or in specified geographic areas
with adjustment to population data.
The categorized symbology was tested based on
the variable ADM_TIP attribute which corresponds to
the patients’ admission type (strings 1, 2 or 6). The
string 2 corresponds to urgent admissions and the
remaining strings are related to programmed
admissions. Figure 5 presents the assigned
characteristics in this specific case and the result
obtained.
In this case, the variable is discrete so the
application considers the mode and assign the value
to each village. The second part of the graphic
interface is blocked, so it can be used only with
graduated symbology. In the future, the application
will be improved to estimate the occurrences
percentage beyond the mode. The symbols without
GIS Open Source Application as a Support to a Hospital Morbidity Database - Hospital GIS
173
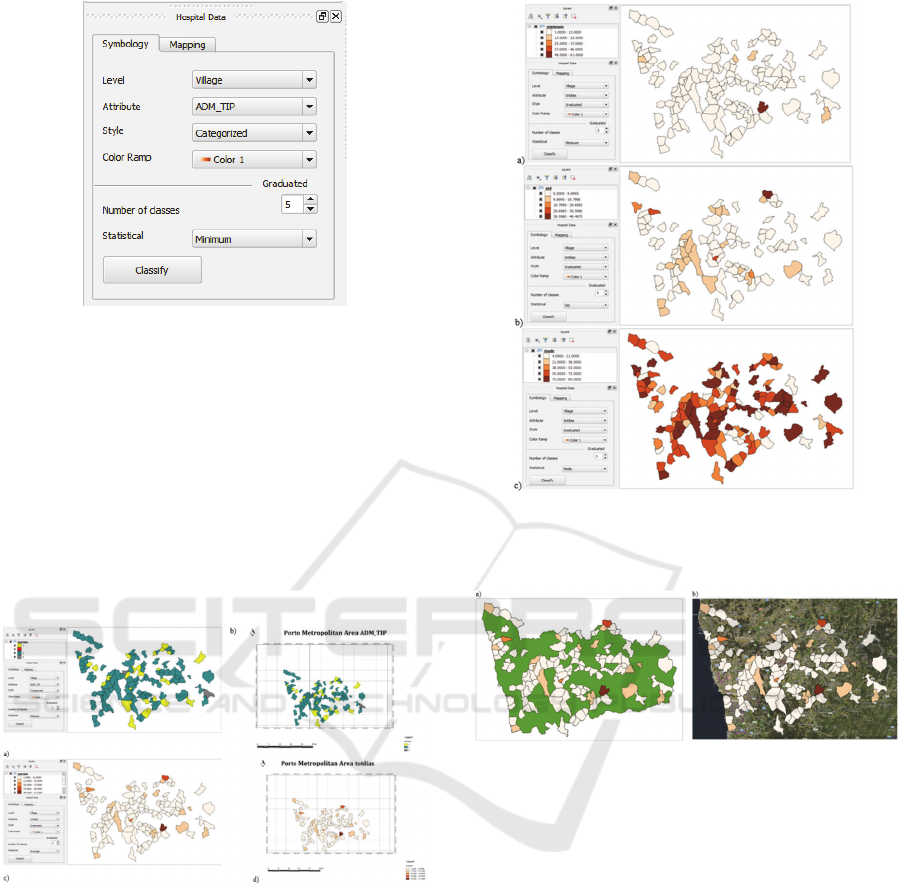
Figure 5: HospitalGIS graphic interface with the ADM_TIP
attribute characteristics.
legend corresponds to village without information.
The map for printing was created in A3 size and the
elements related to Grande Porto zone. A numeric
attribute was also tested, the variable totdias which
corresponds to the total number of inpatient days. The
study was also applied to the villages. The style
chosen was Graduated and the classes number were
defined by default as 5. The statistical method applied
was the average. Figure 6 presents the categorized
and graduated symbology with the respective maps.
Figure 6: a) Categorized ADM_TIP attribute symbology; b)
Categorized ADM_TIP attribute map for print; c)
Graduated tot_dias attribute symbology; d) Graduated
tot_dias attribute map for print.
Figure 7 presents examples using minimum value,
standard deviation and mode related to the inpatient
days variable.
In Figure 8 is presented the symbolized shapefile
overlapped with the limit of study zone and the
interactive map, in order to test the other
functionalities.
Figure 7: Examples considering a) minimum value, b)
standard deviation and c) mode related to the inpatient days
variable.
Figure 8: a) Symbolyzed shapefile overlapped with the limit
of study zone and the b) interactive map from Bing Aerial
Maps.
4 DISCUSSION
The database information was spatially distributed.
Different combinations and possibilities were tested
with the developed application and was concluded
that, in health area, this application could be very
valuable, improving the spatial analysis for the health
professionals. For instance, Figure 6b shows an
example of ADM_TIP attribute representation by
village which corresponds to patients’ admission type
(strings 1, 2 or 6). From the results obtained it can be
concluded that approximately 49% of the villages
don’t have information in the database (and they are
not presented in Figure 6). 12% of the villages of
PMA were classified as containing patients with
programmed admissions (string 1 or 6) and 39% of
GISTAM 2017 - 3rd International Conference on Geographical Information Systems Theory, Applications and Management
174

the villages presented patients urgently admitted in
the hospital of Porto. In this particular study case the
mode of patients in each village was evaluated. If we
consider a quantitative variable, such as the average
total number of inpatient days (Figure 6d), we can
conclude that 42% of the villages contains 1 to 13
patients in the hospital, 8% with an average of 13-25
patients and 1 village has more than 43 patients in the
hospital (Vila Boa de Quires e Maureles (accessed
taking advantage of QGIS tools)). Other type of
relations can be performed with the tool. Also, this
application is based on an open source software, easy
to install and use. The database relationship with a
shapefile allows to locate and visualize
geographically and spatially the data, improving the
data analysis and interpretation. The interaction with
different information layers was also a great
advantage to a user non comfortable with GIS
software, or GIS operations such as PostGIS
connection, shapefiles creation and symbolization,
connections and calculations between several
variables and statistics applications under spatial
information. The application is free, open source,
available for any user that needs a tool easy to use and
understand, allows to create maps with associated
data, and also perform geographic and statistical
analysis from database information.
5 CONCLUSIONS
The developed GIS open source application is a
valuable tool to health area where the user must deal
with geospatial data with future applicability in the
data access and hospital episodes data manipulation
and analysis. The difficulty of health professionals in
the creation of multiple visualizations of tabular data
defined by rigorous position and the maps creation to
later analysis and print can be overcome with this
application. The large amount of data requires the
connection to a free database in GIS environment
enhancing the practical applicability, rapid, safe and
efficient data representation. The presented tool is a
preliminary version of a useful and efficient scientific
tool to produce the maps required to study health
variables, helping in the decision support. Some
improvements will be done in the future automatizing
even more the developed application such as (i)
extending the data visualization to a WebGIS,
through the creation of a web page that allows the
hospital administrative data visualization using
Google Maps or Google Earth as interactive maps, (ii)
performing spatio-temporal statistical analysis,
evaluating the trend prediction of the data with the
creation of plots, (iii) developing functionalities to
compare parameters in different regions, (iv) relating
the information of the database with environmental
risk factors such as temperature, precipitation or even
vegetation indices and (v) the possibility of inserting
satellite imagery will be implemented The application
is easy to install and use in GIS environment and is
available in http://www.fc.up.pt/pessoas/liaduarte
/HospitalGIS.rar. The present application can only be
tested under inside server.
ACKNOWLEDGEMENTS
Project "NORTE-01-0145-FEDER-000016"
(NanoSTIMA) is financed by the North Portugal
Regional Operational Programme (NORTE 2020),
under the PORTUGAL 2020 Partnership Agreement,
and through the European Regional Development
Fund (ERDF).
REFERENCES
A linguagem SQL. Documentação do PostgreSQL 8.0.0.
2015. http://pgdocptbr.sourceforge.net/pg80/tutorial-
sql.html. Accessed October 2015.
Ayres-Sampaio, D., Teodoro, A.C., Sillero, N., Freitas, A.,
2014. An investigation of the environmental
determinants of asthma hospitalizations: An applied
spatial approach. Applied Geography, 47:10–19.
Bui, T.Q., Pahm, H.M., 2016. Webbased GIS for spatial
pattern detection: application to malaria incidence in
Vietnam. SpringerPlus, 5, 1014.
Duarte, L., Teodoro, A.C., Gonçalves, J.A., Guerner Dias,
A.J., Espinha Marques, J., 2015. A dynamic map
application for the assessment of groundwater
vulnerability to pollution. Environmental Earth
Sciences, 74(3), 2315-2327.
Ferguson, W.J., Kemp, K., Kost, G., 2016. Using a
geographical information system to enhance patient
access to point-of-care diagnostics in a limited resource
setting. International Journal of Health Geographics,
15:10.
Fisher, R.P., Myers, B.A., 2011. Free and simple GIS as
appropriate for health mapping in a low resource
setting: a case study in eastern Indonesia. International
Journal of Health Geographics, 10:15.
GDAL. Geospatial Data Abstraction Library. 2015.
http://www.gdal.org/. Accessed September 2015.
Gómez-Barroso, D., García-Pérez, J., López-Abente, G.,
Tamayo-Uria, I., Morales-Pia, A., Romaguera, E.P.,
Ramis, R., 2016. Agricultural crop exposure and risk of
childhood cancer: new findings from a case-control
study in Spain. International Journal of Health
Geographics, 15:18.
GIS Open Source Application as a Support to a Hospital Morbidity Database - Hospital GIS
175

GRASS. The world’s leading Free GIS software. 2015.
http://grass.osgeo.org/. Accessed September 2015.
Inspire. Infrastructure for Spatial Information in the
European Community. 2015. http://inspire.ec.europa
.eu/index.cfm/pageid/48. Accessed October 2015.
Jeong, B., Joo, H.-T., Shin, H.-S., Lim, M.-H., Park, J.-C.,
2016. Geographic information system analysis on the
distribution of patients visiting the periodontology
department at a dental college hospital. Journal of
Periodontal and Implant Science, 46(3), 207-217.
Kelen, P.T.V., Downs, J.A., Stark, L.M., Loraam, R.W.,
Anderson, J.H., Unnasch, T.R., 2012. Spatial
epidemiology of eastern equine encephalitis in Florida.
International Journal of Health Geographics, 11:47.
Luan, H., Law, J., 2014. Web GIS-Based Public Health
Surveillance Systems: A Systematic Review. ISPRS
International Journal Geo-Information, 3, 481-506;
Makanga, P.T., Schuurman, N., von Dadelszen, P., Firoz,
T., 2016. A scoping review of geographic information
systems in maternal health. International Journal of
Gynecology and Obstetrics, 134, 13-17.
Moncrieff, S., West, G., Cosford, J., Mullan, N., Jardine,
A., 2014. An open source, server-side framework for
analytical web mapping and its application to health.
International Journal of Digital Earth, 7(4), 294-315.
Munoz, M.E.S., Giovanni, R., Siqueira, M.F., Sutton, T.,
Brewer, P., Pereira, R.S., Canhos, D.A.L., Canhos,
V.P., 2011. openModeller: a generic approach to
species’ potential distribution modelling.
Geoinformatica, 15, 111–135.
Panciera, R., Khan, A., Rizvi, S.J.R., Ahmed, S., Ahmed,
T., Islam, R., Adam, A.M., 2016. The influence of
travel time on emergency obstetric care seeking
behaviour in the urban poor of Bangladesh: a GIS study.
BMC Pregnancy and Childbirth, 16:240.
Plugin: Plugin Builder. Plugin: Plugin Builder, QGIS
Python Plugins Repository. 2015. https://plugins.qgis
.org/plugins/pluginbuilder/. Accessed October 2015.
Plugin Builder Documentation. QGIS Plugin Builder 2.8.1
documentation. 2015. http://g-sherman.github.io/Qgis-
Plugin-Builder/. Accessed October 2015.
PostGIS. Spatial and Geographic objects for PostgreSQL.
2015. http://postgis.net/. Accessed October 2015.
PyQt4 API. PyQt Class Reference. 2015. http://pyqt.
sourceforge.net/Docs/PyQt4/classes.html. Accessed
August 2015.
Python. Python Programming Language. 2015.
http://python.org/. Accessed August 2015.
QGIS API. Quantum GIS API Documentation. 2015.
http://www.qgis.org/api/. Accessed September 2015.
QGIS. Quantum GIS Project. 2015. http://www.qgis.org/.
Accessed August 2015.
R. The R Project for Statistical Computing. 2015.
https://www.r-project.org/. Accessed September 2015.
Ruktanonchai, C.W., Pindolia, D.K., Striley, C.W.,
Odedina, F.T., Cottler, L.B., 2014. Utilizing spatial
statistics to identify cancer hot spots: a surveillance
strategy to inform community-engaged outreach
efforts. International Journal of Health Geographics,
13:39.
Sadler, R.C., 2016. Integrating expert knowledge in a GIS
to optimize siting decisions for small-scale healthy food
retail interventions. International Journal of Health
Geographics, 15:19.
SAGA. System for Automated Geoscientific Analyses.
2015. http://www.saga-gis.org/. Accessed September
2015.
SEXTANTE. The SEXTANTE framework. 2015.
http://www.sextantegis.com/. Accessed September
2015.
Smith, C.M., Hayward, A.C., 2016. DotMapper: an open
source tool for creating interactive disease point maps.
BMC Infectious Diseases, 16:145.
Snow, J., 1855. On the mode of communication of cholera.
2nd edition. London: Jonh Churchill.
Spatial Reference. sr-org projection 7483 - epsg:3857 --
wgs84 web mercator (auxiliary sphere). 2015.
http://spatialreference.org/ref/sr-org/7483/. Accessed
October 2015.
Spherical Mercator. EPSG:3857. 2015. http://wiki.
openstreetmap.org/wiki/EPSG:3857. Accessed
October 2015.
SQL. SQL Wikipedia. 2015. https://pt.wikipedia.org/wiki
/SQL. Accessed October 2015.
Stallman P. Why ‘Open Source’ misses the point of free
software, GNU Operating System. 2007.
http://www.gnu.org/philosophy/open-sourcemisses-
the-point.html. Accessed February 2011. Accessed
September 2015.
Teodoro, A.C., Duarte, L., 2013. Forest Fire risk maps: a
GIS open source application – a case study in Norwest
of Portugal. International Journal of Geographic
Information Science, 27(4), 699-720.
Web Mercator. Web Mercator Wikipedia. 2015.
https://en.wikipedia.org/wiki/Web_Mercator.
Accessed October 2015.
Zhang, Z., Manjourides, J., Cohen, T., Hu, Y., Jiang, Q.
2016. Spatial measurement errors in the field of spatial
epidemiology. International Journal of Health
Geographics, 15:21.
GISTAM 2017 - 3rd International Conference on Geographical Information Systems Theory, Applications and Management
176
