
News Dissemination on Twitter and Conventional News Channels
Agrima Seth
1,2
, Shraddha Nayak
1
, Josiane Mothe
2
and Sangeeta Jadhay
1
1
Army Institute of Technology, Dighi Hills, Pune, 411015, India
2
Université de Toulouse, ESPE, Institut de Recherche en Informatique de Toulouse, UMR5505 CNRS,
118 route de Narbonne, 31062 Toulouse Cedex 9, France
Keywords: News Dissemination, Twitter Data, News Articles Data, Data Analysis, Data Visualization.
Abstract: Big Data is "things that one can do at a large scale that cannot be done at a small one". Analyzing flows of
news events that happen worldwide falls in the scope of Big Data. Twitter has emerged as a valuable source
of information where users post their thoughts on news events at a huge scale. At the same time traditional
media channels also produce huge amount of data. This paper presents means to compare the propagation of
the same news topic through Twitter and news articles, both important yet varied sources. We present visual
means based on maps to make it possible to visualize the flow of information at different level of temporal
granularity. We also provide an example and how the flow can be interpreted.
1 INTRODUCTION
Opinions are central to many human activities and
are key influencer of our behaviors. The choices that
we make in life depend, to a large extent, on how
other individuals see and evaluate the world. For this
reason, when we need to make a decision we often
seek out the opinions of others.
Opinion mining is the process of extracting from
a set of documents such as social media posts, web
pages, or others, the opinions that are expressed by
people on a certain topic or entity. The existence of
various social media such as, blogs, e-forums or e-
commerce has made it possible for users to express
their opinions on variety of topics, such as economy,
politics, environment, or events. Social opinion
mining relies on exploiting this large volume of
subjective data, mainly by trying to distinguish
positive and negative posts about entities (Khan et
al., 2014).
Although related to opinion mining, our target is
a little different since we aim at analyzing news
dissemination considering various information
sources taking into account information provider
localization. Thus it is not about positive/negative
opinion expressed but rather how information is
spread on a topic worldwide.
For many events, it is likely that “local” people
will have more awareness and will write more. Let
us consider the recent earthquake that happened in
Italy. European people are probably more aware of
this event and talk more about it than about any
other events that injured or killed as many people
but occurred in another part of the word. Moreover,
among European, French people may be more aware
of this event than Irish because of remoteness or
because the same type of event is likely to happen in
the future in France. On the other hand, Britons may
be more aware of events happening in India than
Polish because more people have links with India in
UK. In certain cases, various regions are not aware
about an incident due to the lack of technical
advancement in that area or because authorities try
to hide or minimize an event. By analyzing the
information spreading, an automatic system could
alarm people or decision makers (NGOs, politicians,
marketers, etc.) and help them understanding
situations. Collecting data and finding such patterns
can enable understanding opinion differences and
similarities amongst various countries and maybe to
prevent problem by an adequate communication.
Traditional news channels and social media are
two different and complementary sources of
information. They differ in many aspects mostly
related to the type of information they deliver and
the writers/readers that contribute. On one hand, the
writers are a few journalists, who check the
information, follow an editorial process, as opposed
to a huge crowd with almost no control or checking
of what is said (although some restrictions exist for
both sources in some regions) but reflect what
people think or feel. Another difference is the
Seth, A., Nayak, S., Mothe, J. and Jadhay, S.
News Dissemination on Twitter and Conventional News Channels.
DOI: 10.5220/0006264100430052
In Proceedings of the 19th International Conference on Enterprise Information Systems (ICEIS 2017) - Volume 1, pages 43-52
ISBN: 978-989-758-247-9
Copyright © 2017 by SCITEPRESS – Science and Technology Publications, Lda. All rights reserved
43

instantaneity of posts which is almost simultaneous
at the event in the case of social media while it can
take several hours or days on news channels.
Considering a topic or an event, it can be useful
to know which information channels disseminate it,
as well as the speed of spreading. For example, it
can then be ossible to follow the impact of a piece of
news in the various regions or countries by
considering either the social media or the more
traditional news channel. For example, in the case of
Volkswagen scandal, the information started in the
US then was investigated in Europe. On the other
hand, taking journalism into account, it could be
interesting to know precisely which areas news
channels cover. It is likely that a news channel
covers events happening in its original country,
however, what other countries do they cover and on
what basis do they cover those areas and give more
importance to them are important issues that our
research tackles. The results can be helpful in
predicting foreign policies that will shape the world,
understanding biases of nations which will further
help people who migrate for jobs and studies too.
This is part of what is called the spatial thinking and
citizenship.
In this paper, we focus on means to visualize the
information spreading. We have considered two
main sources from which the data will be exploited
and analyzed:
One of them is Twitter which is a social
networking site. Social media enable users to
create and share content or to participate in social
networking. Social media include web logs,
internet forums, wikis, pod casts, micro blogging
or social networks. We consider here Twitter as
it has brought a new dimension and dynamism to
news gathering. At the time of our research, it is
possible to extract information from Twitter API‚
and in this way get the public opinion of people
in different countries and various events, in
different parts of the world, on what they talk about.
The other ways to get details of events are news
channels such as New York Times, NDTV, or
Times Now. Through web crawling we can
identify what information has been gathered by
journalists and about what regions do these news
channels generally talk about. For that, in this
research, we used Alchemy API by IBM to
gather information.
This paper focuses on analyzing the spread of
users talking about a particular event starting from
the advent of the event, and further using suitable
time-intervals to analyze the graph. Further we
extend it to making a conclusion about the spread
based on media genre and the place of origin of the
topic.
Other work focuses on related problem and is
presented in Section 2. As said previously, we focus
on Twitter and News Channels. Information
gathering from both sources is the first step that is
further presented in Section 3 of this paper. In
Section 4 we explain how we solve the location
identification for both resources. Section 5 presents
the type of visualization we consider. Section 6
presents some results we found. We finally conclude
this paper and present future work.
2 RELATED WORK
Identifying key events from the ever-growing body
of digital media has fascinated researchers for over
twenty years, starting from digital newsprint to blogs
and now social media (Hecht et al., 2011).
In the 1990s and early 2000s, event or topic
detection and tracking (TDT) tracks have been very
active through international evaluation campaigns
(Allan, 1998), (Fiscus, 2002). TDT tracks focused
on new event detection, story clustering about the
same topic, etc. More recently, CLEF evaluation
forum focused on contextualizing tweets ; some of
the participants considered location mentioned in
tweets (Goeuriot et al., 2016).
Fung et al. (2005) built on the burst detection
scheme presented by Kleinberg (2003) by
identifying busty keywords from digital newspapers
and clustering these keywords into groups to identify
busty events. This work succeeded in identifying
trending events and showed such detection tasks are
feasible.
Recognizing that newsprint differs substantially
from social media both in content and velocity, the
research community began experimenting with new
social media sources like blogs, but real gains came
when micro-blogging platforms began their rise in
popularity. One of the most well-known works in
detecting events from microblog streams is Sakaki et
al. (2010) paper on detecting earthquakes in Japan
using Twitter. Sakaki et al. show that not only can
one detect earthquakes on Twitter but also that it can
be done simply by tracking frequencies of
earthquake related tokens. Surprisingly, this
approach can outperform geological earthquake
detection tools since digital data propagates faster
than tremor waves in the Earth crust. Though this
research is limited in that it requires pre-specified
tokens and is highly domain and location-specific
(Japan has a high density of Twitter users, so
ICEIS 2017 - 19th International Conference on Enterprise Information Systems
44

earthquake detection may perform less well in areas
with fewer Twitter users), it demonstrates a
significant use case and the potential of such
applications.
Many researchers have explored motivations for
using platforms like Twitter and have shown
interesting dynamics in human behavior around
events with broad impact (Gonzales et al., 2012).
Lehmann and Cattuto (2012) worked on collective
attention on Twitter and explored hashtags and the
different classes of activity around their use. Their
work includes a class for activity surrounding
unexpected, exogenous events, characterized by a
peak in hashtag usage with little activity leading up
to the event.
Additionally, this interest in burst detection has
led to several domain-specific research efforts that
also target sporting events specifically (Lanagan and
Smeaton, 2012, Zhao et al., 2011, Vasudevan et al.
2013). Lanagan and Smeaton's work is of particular
interest because it relies almost solely on detecting
bursts in Twitter's per-second message volume.
Though naive, this frequency approach is able to
detect large bursts on Twitter in high-impact events
without complex linguist analysis and performs well
in streaming contexts as little information must be
kept in memory. Hence, using keywords to find
relevant tweets served as the baseline for our project
as well. Further, to maintain consistency in the news
headlines extraction using the same keywords have
been used.
3 COLLECTING AND
PRE-TREATING
3.1 Social Media
There are various social networking sites present
today, and one market leader is Twitter. Twitter,
consists of numerous opinions from people across
the world in the form of status, hashtags and
comments. By gathering this data, one can be
familiar about events and this has also been widely
used in previous researches (see Section 2). We too
used this source of information when considering
social media.
3.1.1 Collecting Information
In this work, we used the Twitter API.
Twitter provides two kinds of API’s REST and
STREAMING. For our work we used the
STREAMING API’s. This API has a track
parameter which can be used to perform a match on
keywords. The query executed was:
Twitter.stream('statuses/filter',
track: 'tunisia bombing'});
The output of which was collected in a hbase
database on the OSIRIM machines at the authors’
Lab.
3.1.2 Resolving Geolocations
To resolve the locations of the tweet, we used the
Carmen tool. (Dredze et al., 2013.). Carmel resolves
locations using three primary methods i.e. looking
up directly at the “Place” object, use reverse
geocoding APIs to find the name of place from
latitude and longitude co-ordinates and third look-up
the location from user profile from the four methods
described by Gonzalez and co-workers (Gonzalez et
al., 2012, Oussalah et al., 2012). The locations
obtained were in a tiered format starting from Earth
and followed stepwise to country, then state, county
and finally the city. From the above, we extracted
only the country so as to keep the place data from
tweets consistent with those from the place data for
news channels (discussed in Section 3.2).
3.2 News Channels
3.2.1 Collecting Information
Alchemy API by IBM has provided a Watson
Platform, that uses natural language processing and
machine learning to reveal insights from large
amount of unstructured data. The API provided by
Watson platform is: https://gateway-
a.watsonplatform.net/calls/data/GetNews
There are various parameters associated with the
API which are as follows:
apikey: This is a 40 digit unique key allocated to
every registered user, which enables data
retrieval.
outputMode: It returns the data in desired API
output format such as XML, JSON.
start/end: It determines the time (in UTC
seconds) of the beginning/ending of the query
duration, from when one wants the data.
count: Maximum number of articles to be
retrieved.
q.enriched.url.title: The API streams the URLs
and searches for programmer defined keywords
in the title of articles; for our project we defined
the keyword as “tunisia”.
q.enriched.url.text: The API streams the URLs
and searches for a programmer defined keyword
in the body text of articles; for our project we
News Dissemination on Twitter and Conventional News Channels
45

defined these words to be either “blast” OR
“explosion”.
return: Retrieves specified field only such as in
the case, the API will return URL, title, and date
of publication of articles.
Thus, the streaming is done using keywords
defined by the programmer (in this case, to get the
data on news articles published about Tunisia
Attack, since we used the keywords “tunisia”,
“blast”, and “explosion”).
To make a request to the server we write the
query using the above mention API and its
parameters. The query for Tunisia blast from IBM
Watson platform is written as in Figure 1. Where
apikey=axxxxx refers to the key that programmer
uses to access the Watson platform and is private.
https://gateway-
watsonplatform.net/calls/data/GetNews?apik
ey=axxxxxx0&start=now-
6m&end=now&count=1000&q.enriched.url.title
=tunisia&q.enriched.url.text=O[blast^explo
sion]&return=enriched.url.url,enriched.url
.title,enriched.url.publicationDate.date
Figure 1: The query used to collect information on a
specific event on IBM API.
3.2.2 Resolving Geolocations
In this way, we get a set of 880 articles from various
new channels. We get the responses in the format as
depicted in Figure 2.
{ "id": "NzU4MDQzNjY2OXwxNDU3MTUxNTgy",
"source": {
"enriched": {
"url": {
"publicationDate": {
"date": "20151125T054000"
},
"title": "Tunisia
declares state of emergency after deadly
bus blast",
"url":"http://www.modernghana.com/news/
535946/tunisia-declares-state-of-
emergency-after-deadly-bus-blast.html"
}
}
},
"timestamp": 1457151582
},
Figure 2: Data format for news articles.
The information is retrieved in JSON format. The
URL field mentions the channel that has published a
particular piece of news. To determine the location
of the news article, we have used the http://ip-
api.com/json/ API. Indeed, a DSN contains the IP
address and Geolocation (country, ISP) of the DNS
server the client used.
From the retrieved URL, we get the domain and
that domain can be used as parameter in the above
API to get the location. Using ip-api, we can retrieve
the following terms in JSON format such as, IP,
Country, City, Region, Latitude, and Longitude. For
our study, we kept only the Country information
which corresponds to the country where this article
was published.
After data retrieval and resolving the
geolocation, the data of the news articles was
clustered. Since only 12% of the collected news data
contained the time of publishing of articles,
clustering on date and time of publishing would
have led to false clusters as the articles with no time
are automatically assigned the time 00:00:00 by
IBM Watson and hence would have yielded false
clustering.
4 DATA VISUALIZATION
Data visualization can enable organizers, politicians,
journalists and citizens to make a decision or to get a
picture of the geo-organization of information and
events. Maps are means to display information in a
readable way that help spatial thinking. Users can
visualize the data on a world map, understand the
geo-features more easily and it can also help users to
take actions accordingly.
Tableau is a business intelligence tool
(http://tableau.com by Chris Stolte, Christian Chabot
and Pat Hanrahan).
Tableau is a family of interactive data visualization
products for business intelligence. Tableau makes it
possible for the data to be analysed at various levels
of abstraction. Here we exploit this flexibility.
We use Tableau in order to visualize the
collected data with reference to its time and date of
origin.
The data has to be under the form: date, time,
country, count.
To plot the data:
Use the first, second column of the file as the
column value of the plot.
The third column containing the geo-location
will help in identifying the location on the world
map. Amongst the type of plots, we chose full-
geographic map.
The data visualized is the fourth column
containing the number of tweets.
Hence this field is taken in the count field (i.e.
the field which specifies the values to be plotted on
ICEIS 2017 - 19th International Conference on Enterprise Information Systems
46
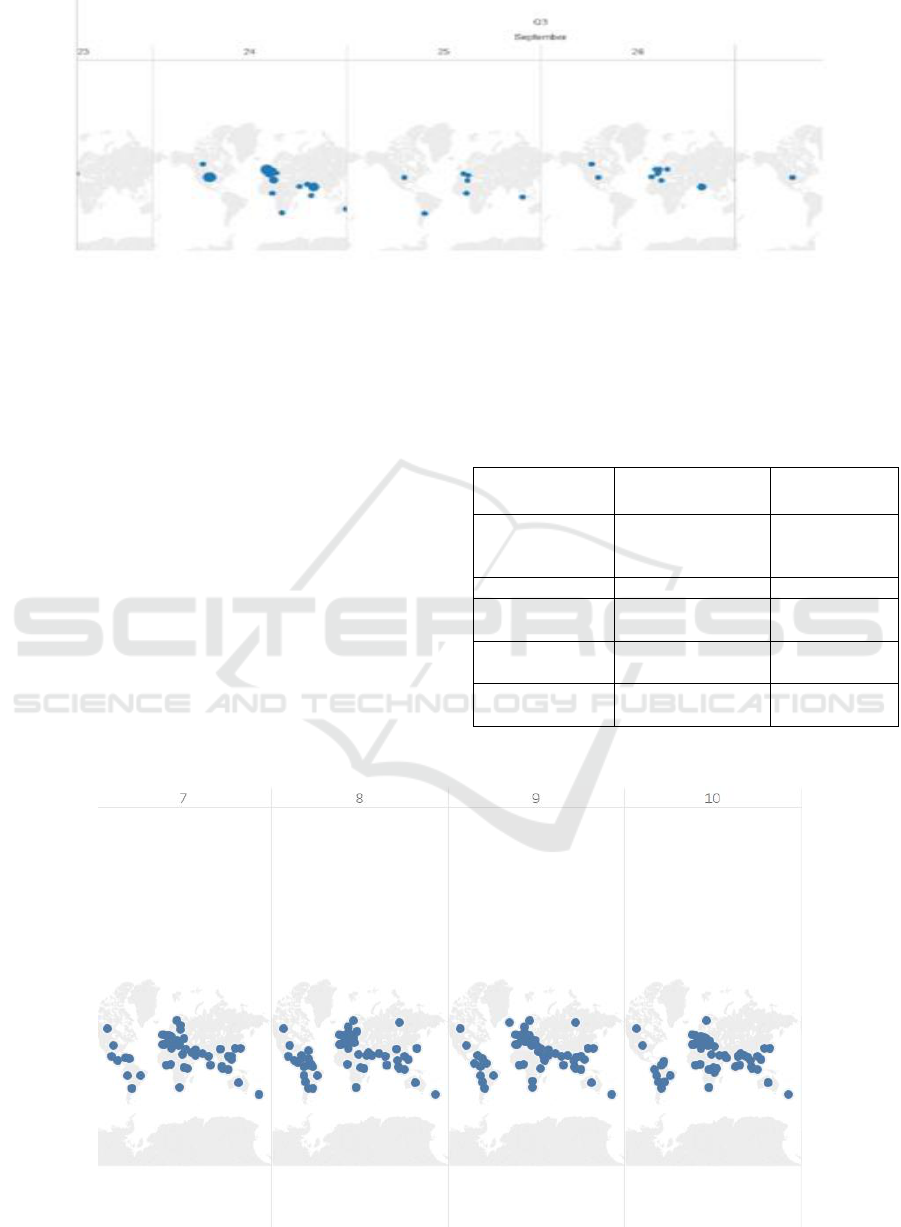
Figure 3: An example of the data plots on the world map.
the graph). The columns in the images denote the
time, date, and year of origin of tweet. The size of
markers (blue) on the map as in Figure 3 denotes the
density of the tweets from the countries. Since the
plotting is done in Tableau, hovering the cursor over
each marking yields the details (country, count of
tweet or news articles) of the marking.
5 BIG DATA PROCESSING AND
PERFORMANCE
In this section, we focus on a case study. We chose
the 24
th
November 2015 Tunis bombing.
The feature of the collections we gathered on this
event is depicted in Table 1.
We then visualize the token on maps. Each plot
represents the world map of either tweets or new
articles on a given date (specified above each map).
The blue markers define the regions from where the
data originated on the given date and its density too
(defined by size).
Table 1: Collection regarding the 24
th
November 2015
Tunis bombing.
Tweet collection
News channel
collection
Query
tunis, explosion,
blast, time >= 24
November 2015
tunisia,
explosion,
attack
# collected posts
1,635,343
881
# of solved
locations
618,035
881
Start date
24 November 2015,
0300 hrs. (UTC)
25 November
2015
End date
31 December 2015,
2200 hrs. (UTC)
22 April 2016
Visualization plots are as presented in Figure 4 to 8:
Figure 4: Tweet pattern in the early stages (24-27 November 2015) of event occurrence.
News Dissemination on Twitter and Conventional News Channels
47
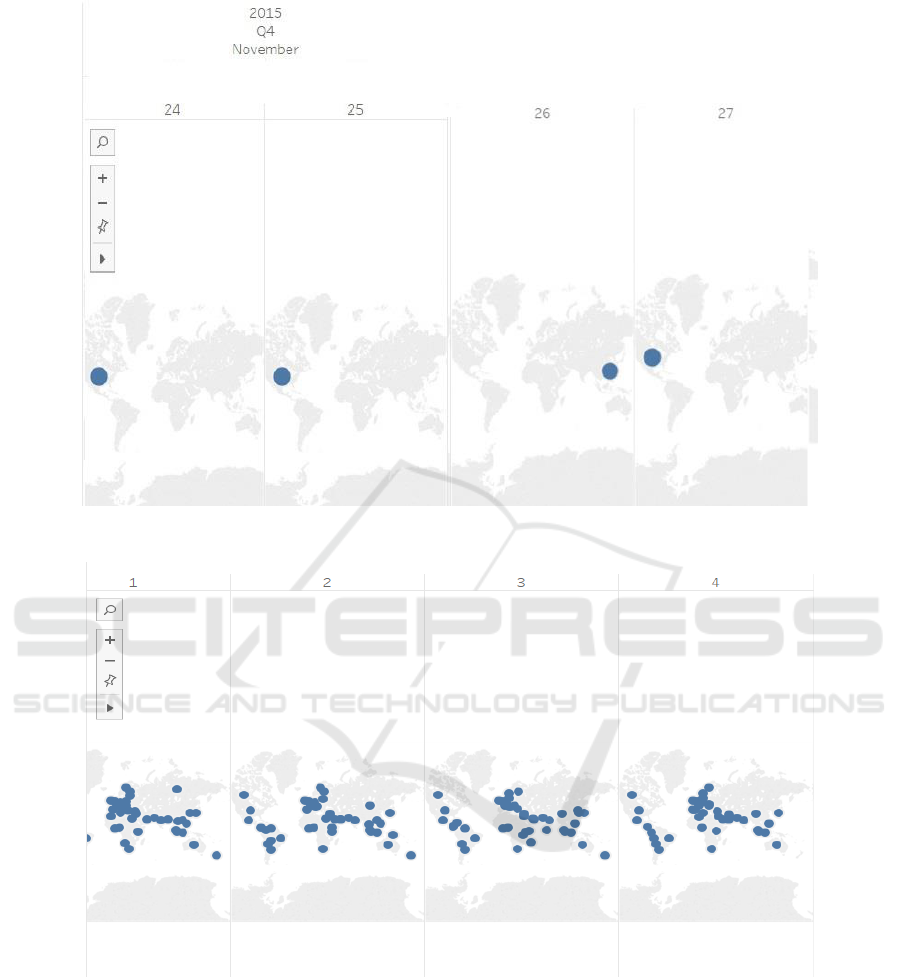
Figure 5: News Channel pattern in the early stages (24-27 November 2015) of event occurrence.
Figure 6: Tweet pattern in the mid (1-4 December 2015) of event occurrence.
ICEIS 2017 - 19th International Conference on Enterprise Information Systems
48
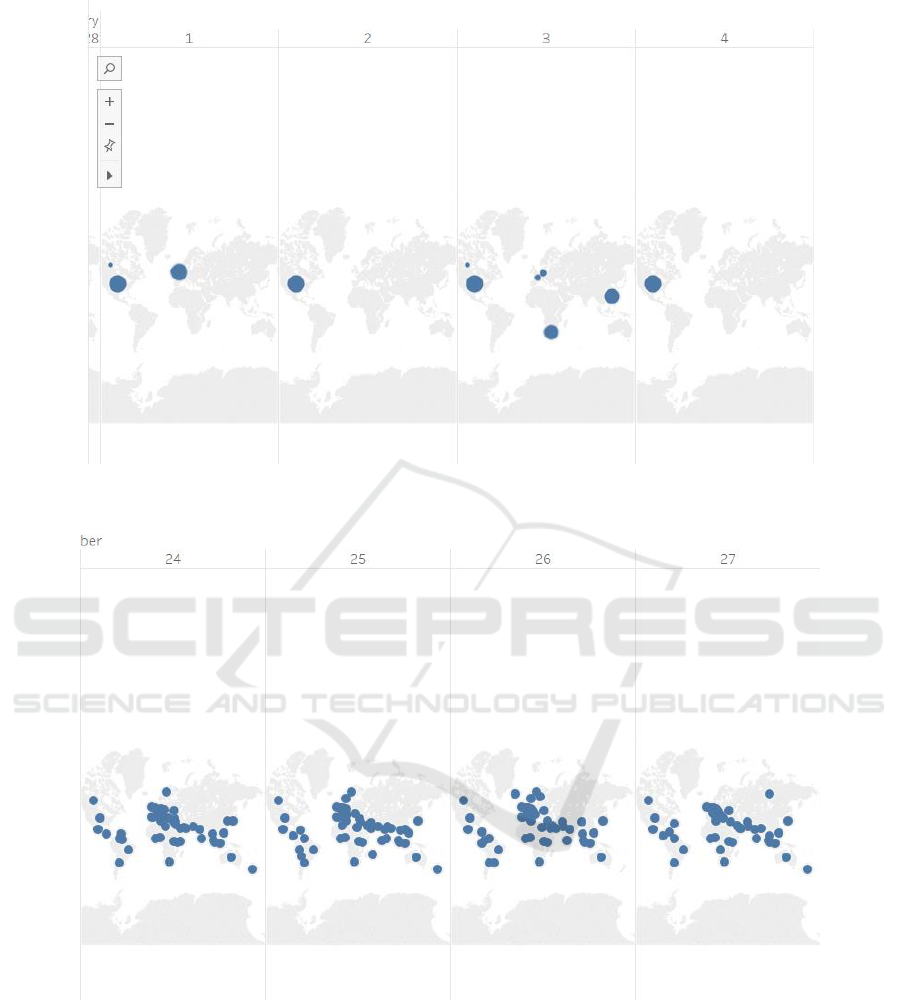
Figure 7: News Channel pattern in the mid (1-4 December 2015) of event occurrence.
Figure 8: Tweet pattern on the end (7-10 December 2015) of event occurrence.
News Dissemination on Twitter and Conventional News Channels
49
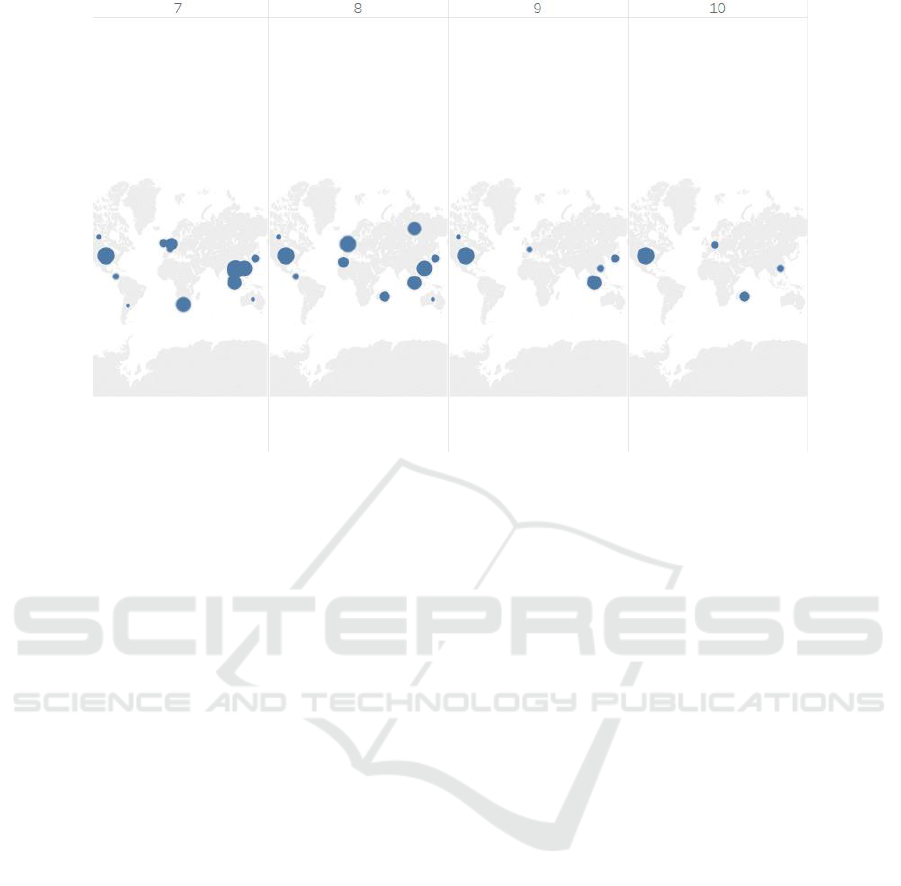
Figure 9: News Channel pattern on the end (7-10 December 2015) of event occurrence.
Map based on Longitude (generated) and
Latitude (generated) were broken down by Year,
Quarter, Month and Day. Size shows distinct count
of number of tweets or news article.
Time interval for grouping tweet data:1 day
Time interval for grouping news data:1 day
Amongst 880 articles published on the news only
109 articles had a publishing time attributed to them;
i.e. 12.8% of the total. Hence we chose to cluster the
news article data based on date of publishing rather
than time. Whereas the twitter data was very widely
spread over a period of time, thus we chose to
cluster it on the basis of hour.
Based on the above plots, the observations of the
data are as follows:
Inferences have been made based on the visual
plots on the world map. The inferences are as
follows:
The event occurred in Tunisia located in northern
region of Africa, however there is hardly any
tweet originating from this continent even though
it was expected that the proximity of this event
would have triggered a burst of tweets from this
region. One of the factors to which this could be
attributed to is that there might be other more
popular forms of micro-blogging sites which
have an upper-hand over twitter. This can form
the basis of a different study altogether.
United States of America has closely been
following the event since its advent. It
contributed to nearly 50% of the tweets and news
channel reporting. Here, a classic example of
news channels shaping the opinions of the
masses has been witnessed as both the tweets and
news-channels have been actively following this
event.
Russia has been indifferent to this event in terms
of both tweets and news channel reporting as
only 5 tweets were found to originate from this
region and no news reporting of the same was
found during the advent of the event. However
the news channels started participating in the
news when the government of Tunisia actively
implemented steps to combat terrorism (i.e. end
of December)
India has contributed to the twitter data (20%)
about the event however no news channel
reporting was found from this country.
Hence it can be concluded that today twitter has
emerged as a powerful micro-blogging site to
express one’s views and the news channels are not
the only factor that shapes the human awareness to
an event.
6 CONCLUSIONS
In this paper, we have mentioned two sources of
news dissemination, Social Media and News
Channels. We have presented methodologies from
which we can extract current news events or an
event that has occurred in the past on the basis of
specific keywords. Using Twitter API, we can
retrieve those tweets that have specific query terms.
ICEIS 2017 - 19th International Conference on Enterprise Information Systems
50

The Meta-data that we get from the tweets enables
us to get the time and the location (using Carmen
tool) of the user. We use the same query terms in
retrieving the URL’s of top news channels. For this
purpose, we have used Alchemy API by IBM. We
can get the time field and location of the URL’s.
Using the data from Twitter and News Channels we
can group the places according to the time of hosting
and plot it on Visualization Tool, Tableau. Hence,
this application is useful in understanding the
relation between various countries and how an event
occurring in a country affects another country. Other
data forms could also be useful for analysis purposes
such as OLAP-based modelling (Kraiem et al.,
2015). Extracting locations could also be based on
more advance methods (Hoang et al., 2017).
ACKNOWLEDGMENTS
This project has been funded by SIG team at Institut
de Recherche en Informatique de Toulouse (IRIT),
France. This work has partially been carried out in
the framework of FabSpace 2.0 project which
received funding from the European Union’s
Horizon 2020 Research and Innovation programme
under the Grant Agreement n°693210.
REFERENCES
Allan, J., Carbonell, J. G., Doddington, G., Yamron, J.,
Yang, Y., 1998. Topic detection and tracking pilot
study final report. In Proceedings of the DARPA
Broadcast News Transcription and Understanding
Workshop (pp. 194-218). DARPA.
Allan, J., Papka, R., Lavrenko, V., 1998. On-line new
event detection and tracking. In Proceedings of the
21st annual international ACM SIGIR conference on
Research and development in information retrieval
(pp. 37-45). ACM.
Bergsma, S., Dredze, M., Van Durme, B., Wilson, T.,
Yarowsky, D., 2013. Broadly Improving User
Classification via Communication-Based Name and
Location Clustering on Twitter, In Proceedings of
NAACL-HLT 2013 (pp. 1010–1019). Association for
Computational Linguistics.
Dredze, M., Paul, M. J., Bergsma, S., & Tran, H., 2013.
Carmen: A twitter geolocation system with
applications to public health. In AAAI Workshop on
Expanding the Boundaries of Health Informatics
Using AI (HIAI), pp. 20-24.
Fiscus, J. G., Doddington, G. R., 2002. Topic detection
and tracking evaluation overview. In Topic detection
and tracking (pp.17-31). Springer US.
Fung, G. P. C., Yu, J. X., Yu, P. S., Lu, H., 2005.
Parameter free bursty events detection in text streams.
In Proceedings of the 31st international conference on
Very large data bases (pp. 181-192). VLDB
Endowment.
Goeuriot, L., Mothe, J., Mulhem, P., Murtagh, F., &
SanJuan, E. (2016). Overview of the CLEF 2016
Cultural micro-blog Contextualization Workshop. In
International Conference of the Cross-Language
Evaluation Forum for European Languages (pp. 371-
378). Springer International Publishing.
Gonzalez, R., Figueroa, G., Chen, Y. S., 2012.
Tweolocator: a non-intrusive geographical locator
system for twitter. In Proceedings of the 5th ACM
SIGSPATIAL International Workshop on Location-
Based Social Networks (pp. 24-31). ACM.
Hecht, B., Hong, L., Suh, B., Chi, E. H., 2011. Tweets
from Justin Bieber's heart: the dynamics of the
location field in user profiles. In Proceedings of the
SIGCHI Conference on Human Factors in Computing
Systems (pp. 237-246). ACM.
Khan, K., Baharudin, B., Khan, A., Ullah, A., 2014.
Mining opinion components from unstructured
reviews: A review. In Journal of King Saud
University-Computer and Information Sciences, 26(3),
258-275.
Kleinberg, J., 2003. Bursty and hierarchical structure in
streams. In Data Mining and Knowledge Discovery,
7(4), 373-397.
Kraiem, M. B., Feki, J., Khrouf, K., Ravat, F., & Teste, O.
(2015). Modeling and OLAPing social media: the case
of Twitter. Social Network Analysis and Mining, 5(1),
47.
Lanagan, J., Smeaton, A. F., 2011. Using twitter to detect
and tag important events in live sports. In Artificial
Intelligence (pp. 542-545). Association for the
Advancement of Artificial Intelligence.
Lehmann, J., Gonçalves, B., Ramasco, J. J., Cattuto, C.,
2012. Dynamical classes of collective attention in
twitter. In Proceedings of the 21st international
conference on World Wide Web (pp. 251-260). ACM.
Murtagh, F., Ganz, A., McKie, S., Mothe, J., & Englmeier,
K. (2010). Tag clouds for displaying semantics: the
case of filmscripts. Information Visualization, 9(4),
253-262.
Oussalah, M.; Bhat, F.; Challis, K.; and Schnier, T. 2012.
A software architecture for twitter collection, search
and geolocation services.Knowledge-Based Systems.
Sakaki, T., Okazaki, M., Matsuo, Y., 2010. Tweet analysis
for real-time event detection and earthquake reporting
system development. In IEEE Transactions on
Knowledge and Data Engineering, 25(4), 919-931.
Thi Bich Ngoc Hoang, Josiane Mothe, Véronique
Moriceau. Predicting Locations in Tweets. 2017.
Computational Linguistics and Intelligent Text
Processing, Budapest, Hungary.
Vasudevan, S. Z. V., Wickramasuriya, J., Zhong, L., 2013.
Is twitter a good enough social sensor for sports TV?
In IEEE International Conference Pervasive
News Dissemination on Twitter and Conventional News Channels
51

Computing and Communications Workshops.
PERCOM Workshops.
Zhao, S., Zhong, L., Wickramasuriya, J., Vasudevan, V.,
2011. Human as real-time sensors of social and
physical events: A case study of twitter and sports
games. arXiv preprint arXiv:1106.4300.
ICEIS 2017 - 19th International Conference on Enterprise Information Systems
52
