
Exploratory Multimodal Data Analysis with Standard Multimedia Player
Multimedia Containers: A Feasible Solution to Make Multimodal Research Data
Accessible to the Broad Audience
Julius Sch
¨
oning
1
, Anna L. Gert
1
, Alper Ac¸ık
2
, Tim C. Kietzmann
3
,
Gunther Heidemann
1
and Peter K
¨
onig
1
1
Institute of Cognitive Science, Osnabr
¨
uck University, Osnabr
¨
uck, Germany
2
Psychology Department,
¨
Ozye
˘
gin University, Istanbul, Turkey
3
Cognition and Brain Sciences Unit, CB2 7EF, Medical Research Council, Cambridge, U.K.
{juschoening, agert, gheidema, pkoenig}@uos.de, alper.acik.81@gmail.com, tim.kietzmann@mrc-cbu.cam.ac.uk
Keywords:
Multimodal Data Analysis, Visualization, Sonification, Gaze Data, EEG Data.
Abstract:
The analysis of multimodal data comprised of images, videos and additional recordings, such as gaze trajecto-
ries, EEG, emotional states, and heart rate is presently only feasible with custom applications. Even exploring
such data requires compilation of specific applications that suit a specific dataset only. This need for specific
applications arises since all corresponding data are stored in separate files in custom-made distinct data for-
mats. Thus accessing such datasets is cumbersome and time-consuming for experts and virtually impossible
for non-experts. To make multimodal research data easily shareable and accessible to a broad audience, like
researchers from diverse disciplines and all other interested people, we show how multimedia containers can
support the visualization and sonification of scientific data. The use of a container format allows explorative
multimodal data analyses with any multimedia player as well as streaming the data via the Internet. We proto-
typed this approach on two datasets, both with visualization of gaze data and one with additional sonification
of EEG data. In a user study, we asked expert and non-expert users about their experience during an explo-
rative investigation of the data. Based on their statements, our prototype implementation, and the datasets,
we discuss the benefit of storing multimodal data, including the corresponding videos or images, in a single
multimedia container. In conclusion, we summarize what is necessary for having multimedia containers as a
standard for storing multimodal data and give an outlook on how artificial networks can be trained on such
standardized containers.
1 INTRODUCTION
Multimodal data analysis applications and software
are usually tailored to a single analysis task based on
a specific dataset. This is because stimulus material
(e.g. images and videos), metadata (e.g. object an-
notations and tags), along with their associated mul-
timodal sensor data (e.g. gaze and EEG) are stored
in separate files. Making things even worse, all ad-
ditional data—gaze trajectories, EEG curves, emo-
tional state descriptors, heart and respiration rates, ob-
ject annotations etc.—are stored in a diversity of for-
mats, e.g. plain text, XML, MATLAB format, or bi-
nary. For the purpose of making these multimodal
datasets public, all files are usually compressed into
a data archive. The data structures of these archives
are also customized and can even be unique. For ex-
perts, the use of these data is quite cumbersome and
time-consuming, as accessing, visualizing and soni-
fying them requires special tools. Accordingly, these
datasets are very difficult or even impossible to access
for the general audience.
Multimedia players can visualize and sonify data.
Therefore, it is feasible to encapsulate stimulus ma-
terial, with multimodal data in a standard multime-
dia container format, which can be then played back.
A similar approach has become common practice for
storing text and data, e.g., in the PDF container. State
of the art video containers like the open container
formats (OGG) (Xiph.org, 2016), MPEG-4 (ISO/IEC,
2003), or MKV (Matroska, 2016) can encapsulate a
diversity of data formats, such that they can be inter-
preted as a single file by standard multimedia players
and can be streamed via the Internet. In doing so,
exploratory multimodal data analysis with a standard
multimedia player is possible. Consequently, multi-
272
SchÃ˝uning J., Gert A., AÃ
˘
gÄ
´
sk A., Kietzmann T., Heidemann G. and KÃ˝unig P.
Exploratory Multimodal Data Analysis with Standard Multimedia Player - Multimedia Containers: A Feasible Solution to Make Multimodal Research Data Accessible to the Broad Audience.
DOI: 10.5220/0006260202720279
In Proceedings of the 12th International Joint Conference on Computer Vision, Imaging and Computer Graphics Theory and Applications (VISIGRAPP 2017), pages 272-279
ISBN: 978-989-758-225-7
Copyright
c
2017 by SCITEPRESS – Science and Technology Publications, Lda. All rights reserved

modal research data become accessible to the broad
audience
1
.
Therefore we argue to store the complete spectrum
of data:
– stimuli like video, images and audio,
– metadata of the stimuli like capturing details, ob-
ject tags, subtitles, and labels,
– additional object or scene data like 3D descrip-
tions, online links, scene maps, and object-object
or object-scene relations, and
– sensor data of one or several subjects like gaze
trajectories, heart rate, and EEG curves
in a single multimedia container. Establishing multi-
media containers as a standard format for multimodal
data will facilitate software applications in various
fields, ranging from exploratory analysis tasks, to de-
veloping deep neural networks trained on both sen-
sor and annotation data for e.g. bio-empowered face
detection or multimedia communication aids for dis-
abled people, like automatic audio scene descriptions
based on a virtual viewpoints for blind persons. Fur-
thermore, a standard format will significantly boost
accessibility and shareability of these data.
Focusing on the exploratory multimodal data anal-
ysis on video and image stimuli with a standard mul-
timedia player, this paper starts with a general sec-
tion on multimedia data, followed by our proposed
methods for storing multimodal data in multimedia
container to provide instantaneous visualizations and
sonifications in Section 3. Two datasets are intro-
duced in Section 4. The first dataset contains short
movies and single frames taken from each movie,
together with the corresponding gaze trajectories of
multiple observers who viewed those movies and
frames in the absence of a specific task. The sec-
ond data set focuses neurophysiological recordings in
a real world environment. It consists of a video along
with gaze trajectories and EEG data from one subject.
Both datasets were converted to our proposed format.
The conversion process, which leads to visualization
and sonification, is described in general in Section 5.
The statements and the impression from expert and
non-expert users, performing explorative multimodal
analysis with a multimedia player, are summarized in
Section 6. Based on their statements, the converted
datasets, and the conversion process, we discuss the
benefits of storing multimodal data including the cor-
responding stimuli in a single multimedia container in
Section 7. In the last section, we summarize what is
necessary for having multimedia containers as a stan-
dard for storing multimodal data.
1
cf. video demonstration https://ikw.uos.de/%7Ecv/
publications/VISAPP17
Header
General Metadata
(images, text files, etc.)
Video
Audio 1
(EEG data 1)
Audio 2
(EEG data 2)
Audio n
(EEG data n)
Subtitle 1
(eye tracking data 1)
Subtitle 2
(eye tracking data 1)
Subtitle n
(eye tracking data n)
Temporal Payload
Static
Payload
time t
Figure 1: General data structure of a multimedia container.
The header and the general metadata, which have no tem-
poral dependencies, are stored before the data with tempo-
ral dependencies, like video, audio, subtitle, and metadata.
For streaming this video, only the non-temporal data have
to be transmitted before playing, while the temporal data
are transmitted during playing. To encapsulate multimodal
data the audio and subtitle tracks were reused to carry sen-
sor data—marked with brackets.
2 STATE OF THE ART
Multimedia content used in the domain of entertain-
ment (ISO/IEC, 2003; Bertellini and Reich, 2010), re-
search (Ac¸ık et al., 2014; Vernier et al., 2016; Petro-
vic et al., 2005), or education (Martin et al., 2015;
Rackaway, 2010) usually consists of multiple parallel
tracks like video tracks, audio tracks, images, subtitle
tracks, and metadata related to its content. For stor-
age, distribution, or broadcasting of these multimedia
content in the domain of entertainment, these tracks
are combined into a single container. To support seek-
ing and synchronized playback of the relevant tracks,
multimedia containers have to account for the tempo-
ral nature of their payload (cf. Figure 1). In compar-
ison to classical archival file format ZIP (PKWARE
Inc., 2016) or TAR (GNU, 2016), the temporal pay-
load handling is a major difference. For converting
and packing multimodal data into a single multimedia
container which is playable with any standard player,
at least the temporal structure, as well as the sup-
ported data formats of the container format, must be
considered. In brief: Not every payload is suited for
every container. Further, various multimedia contain-
ers with their encapsulated formats are mentioned.
For DVDs, common multimedia containers, like
the formats VOB and EVO, are based on the MPEG-
PS (ISO/IEC, 1993, 2015) standard. In MPEG-4
(ISO/IEC 14496, Part 14) (ISO/IEC, 2003), the more
modern MP4 format to hold video, audio and timed
Exploratory Multimodal Data Analysis with Standard Multimedia Player - Multimedia Containers: A Feasible Solution to Make Multimodal
Research Data Accessible to the Broad Audience
273

text data, is specified. Though MP4 is carefully spec-
ified, it handles only the formats introduced in the
other parts of this standard, like MPEG-7 (ISO/IEC,
2001), but does not conform to arbitrary video, audio
and timed text formats.
The non-profit Xiph.Org (Xiph.org, 2016) foun-
dation initiated the free OGG container format for
streaming VORBIS encoded audio files. This con-
tainer becomes a popular format for streaming mul-
timedia content on the web with the ability to encap-
sulate Theora and Dirac video formats. Thus OGG
is nowadays supported by many portable devices.
The open the Matro
ˇ
ska container format (MKV) (Ma-
troska, 2016) aims at flexibility to allow for an easy
inclusion of different types of payload. To establish
a standard for multimedia content on the web, a re-
duced and more restricted version, of MKV serves as
a basis for the WEBM (WebM, 2016) format.
3 MULTIMODAL DATA IN
MULTIMEDIA CONTAINER
For encapsulating multimodal data which multimedia
container format is best? Focusing on the specifica-
tion only, the best solution is to encode all meta, ob-
ject, and sensor data in accordance with the elaborate
vocabulary of the MPEG-7 standard and encapsulate
these encoded data as MP4 containers. Because—
unfortunately—no standard media player (like VLC,
MediaPlayer, and Windows Media Player) seems to
support MPEG-7, an explorative analysis of multi-
modal data stored in MP4 containers is not possi-
ble. To our knowledge, the MPEG-7 support in stan-
dard multimedia players is not available—this might
be caused by the elaborate specification that requires
considerable implementation effort.
However, to provide a solution that makes ex-
ploratory multimodal data analysis possible with stan-
dard multimedia players, and to highlight the advan-
tages of a single multimedia container file—carrying
all multimodal data—a MKV container based ap-
proached is proposed here. One advantage is that
popular video players, like VLC, support this format
well. The flexibility of this multimedia container for-
mat allows utilizing a wide selection of data formats,
which can be used for the sonification, visualization,
and storing of multimodal data. Providing sonifica-
tions, one can use common audio formats supported
by MKV as WAV or MP3 and encapsulate them as an
audio track. By rededicating the subtitle tracks, mean-
ingful visualization of different data streams can be
created on top the of video content. Other scientific
data can be encapsulated into the MKV format, too.
Thus our solution (cf. Figure 1) provides instanta-
neous visualization and sonification on the one hand,
and all data combined in single files on the other hand.
Note that all multimodal data combined in a single
file can also be stored by packing them into a data
archive, but that such an archive does not provide vi-
sualizations, sonifications, and is not streamable via
the Internet.
Following the previous discussion (Sch
¨
oning
et al., 2016b, 2017) to reuse, or more precisely, on
modifying an existing subtitle format for incorporat-
ing visualization of sensor data like gaze trajectories,
two kinds of multimedia container prototypes were
implemented. The first is based on the Universal Sub-
title Format (USF) (Paris et al., 2016) and losslessly
encapsulates the complete sensor data for visualiza-
tion. However, for using this approach a slightly mod-
ified version of the VLC media player is needed
2
. The
second is based on the Advanced Sub Station Alpha
(ASS) (SSA v4.00+, 2016) format and is only able to
carry selected sensor data like viewpoints, which can
be visualized by most current media players.
3.1 Sensory Data as USF
To use USF for encapsulating sensor data, we ana-
lyzed which features of USF are made available in the
latest releases of common multimedia players. The
current version 3.0.0 of VLC already supports a sev-
eral of USF attributes (cf. Listing 1), which are text,
image, karaoke and comment. The latest USF specifi-
cation introduces an additional attribute shape. Note,
the specification is still marked as under development,
although the last modifications happened seven years
ago. Since almost every visualization can be created
out of simple geometric shapes, like ellipses and poly-
gons, the use of the shape attributes for instantaneous
visualization is appropriate.
Since the exact specification of the shape attribute
is, as mentioned, not complete, we extended it with
respect to rectangles, polygons, and points, as marked
in Listing 1. These simple geometric shapes were
taken as first components to visualize a multitude of
different types of elements. Point-like visualizations
are useful to describe locations without area infor-
mation, e.g., for gaze position analysis in eye track-
ing studies. Rectangles are most commonly used for
bounding box object of interest annotations. In con-
trast, polygons provide a more accurate, but complex
way of describing the contour of an object.
The visualization of USF data is handled by VLC
in a codec module. This codec module receives
2
source code, software tools and datasets can be down-
loaded from the project homepage cf.
1
VISAPP 2017 - International Conference on Computer Vision Theory and Applications
274
streams of the subtitle data for the current frame from
the demuxer of VLC. We extended this module with
additional parsing capabilities for our specified shape
data
2
, which is then drawn into the so-called subpic-
tures and passed on to the actual renderer of VLC.
Since the thread will be called for every frame, the
implementation is time-critical, and we decided to use
the fast rasterization algorithms of Bresenham (1965).
Additionally, we added an option to fill the shapes,
which is implemented with the scan line algorithm
(Wylie et al., 1967). In the course of this project,
an open source software
2
is developed which converts
time-depended sensor data files of several subjects to
USF files and encapsulate them together with the orig-
inal video in a single MKV file.
Listing 1: Section of the USF specification (Paris et al.,
2016), * marked attributes are added to the specification and
implemented in our altered VLC player.
...
<subtitle + - su b t i tl e (1 .. N )
st a rt = " hh : mm : ss . m mm " @ - sta rt (1 )
st op = " hh : mm : ss . m mm " @ - st op (0 . .1 )
du r a t io n = " hh : mm : ss . m mm " @ - d u ra t i on (0 . .1 )
ty pe = " S u b t i tl e T y p e "> @ - Ty pe (0 . .1 )
<text></text> + - t e xt (0 .. N )
<image></image> + - i m ag e ( 0. . N )
<karaoke></karaoke> + - k ar a o ke (0 . . N )
<shape> + - s h ap e ( 0. . N ) *
<polygon> + - po l y go n (0 .. N ) *
<points + - po i nt s (2 .. N ) *
po sx = " x " @ - po s x (1 ) *
po sy = " y " /> @ - po s y (1 ) *
</polygon>
<rectangle + - re c t a ngl e ( 0. . N ) *
po sx = " x " @ - po s x (1 ) *
po sy = " y " @ - po s y (1 ) *
wi d th = " w id t h " @ - wid th (1 ) *
he i gh t = " h ei g h t " /> @- h eig h t (1 ) *
<point + - p o in t (0 .. N ) *
po sx = " x " @ - po s . x ( 1 ) *
po sy = " y " @ - po s . y ( 1 ) *
di a m e te r = " d i am e t e r " /> @ - d i am e t er (1 ) *
</shape>
<comment></comment> + - c om m e nt (0 . . N )
</subtitle>
...
3.2 Sensory Data as ASS
Since our extensions in USF require a modified ver-
sion of the VLC media player, the broad audience
is still excluded from watching the visualizations.
Therefore, we provide a prototype multimedia con-
tainer based on ASS subtitles as it already supports
geometric drawing commands. In contrast to USF,
the ASS subtitle format cannot carry all desired data
as it is, is not capable of representing complex data
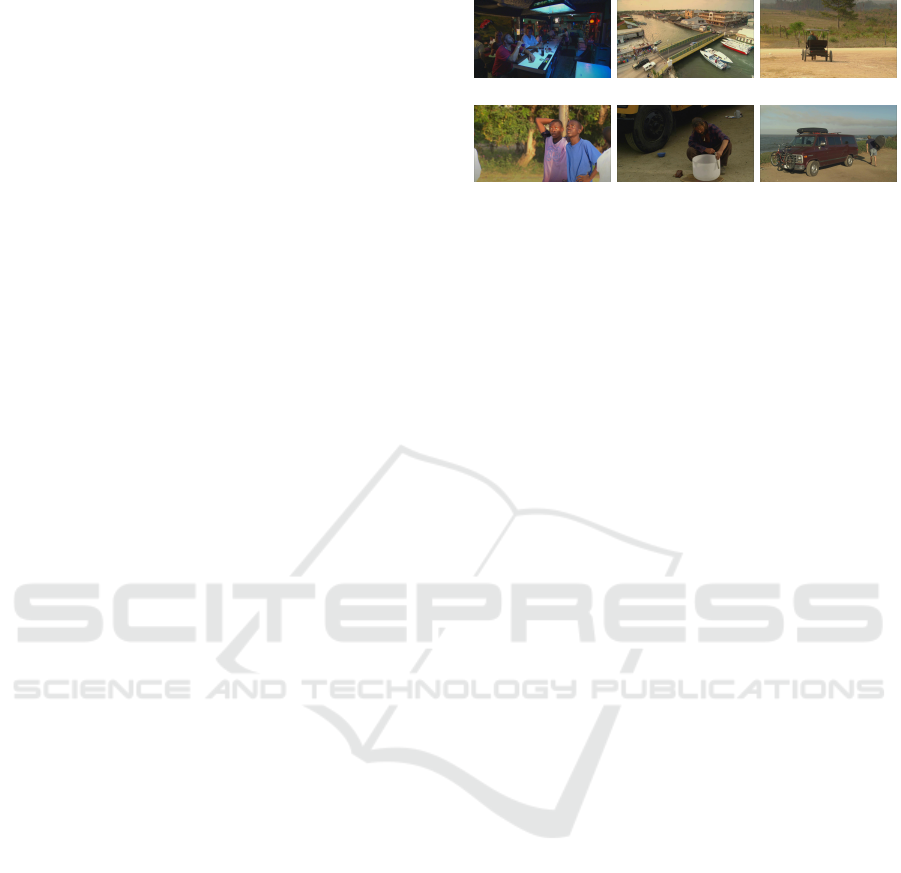
(a) (b) (c)
(d) (e) (f)
Figure 2: Example frames from the movie and frame
dataset— (a) bar scene, multiple persons moving, some
egomotion; (b) bridge, several objects with linear motion;
(c) cart ride, slow continuous movement; (d) street basket-
ball, moving and still persons; (e) musician, slow circular
motion; (f) demounting surfboard, object interaction.
structures, and does not account for non-visualizable
content like non-frame based elements.
From our USF files of the data, one can generate
ASS files using extensible stylesheet language trans-
formations with a simple translation stylesheet
2
. Af-
ter the conversion, a MKV container can be packed
in the same manner as with USF. The resulting con-
tainer with ASS visualizations makes the multimodal
data accessible for a broad audience, as many unmod-
ified players can display these visualizations.
4 DATASETS
For demonstrating that multimodal analysis can be
done with a standard multimedia player, we used
one existing dataset and introduced a new, unpub-
lished dataset preview along with this work. All sci-
entific data—here eye tracking raw data, EEG data,
stills, video stimuli, etc.—are encoded in our pro-
posed MKV based container format.
4.1 Movie and Frame Dataset
This dataset, presented in Ac¸ık et al. (2014), consists
of 216 movie clips featuring a single continuous shot.
The clips were taken from two commercial DVDs,
Highway One and Belize both from the Colourful
Planet collection (Telepool Media GmbH, 2014). The
clips had a duration range of 0.8s to 15.4s. Moreover,
from each movie clip the median frame was taken to
serve as a still image to be presented with a duration
equaling the length of the corresponding clip. Some
of the frames are displayed in Figure 2. These 532
stimuli (216 movies and 216 frames) were shown in
random order to human observers (median age 25)
while their eye position was recorded with an Eyelink
II eye tracker at a sampling rate of 500Hz. There was
Exploratory Multimodal Data Analysis with Standard Multimedia Player - Multimedia Containers: A Feasible Solution to Make Multimodal
Research Data Accessible to the Broad Audience
275
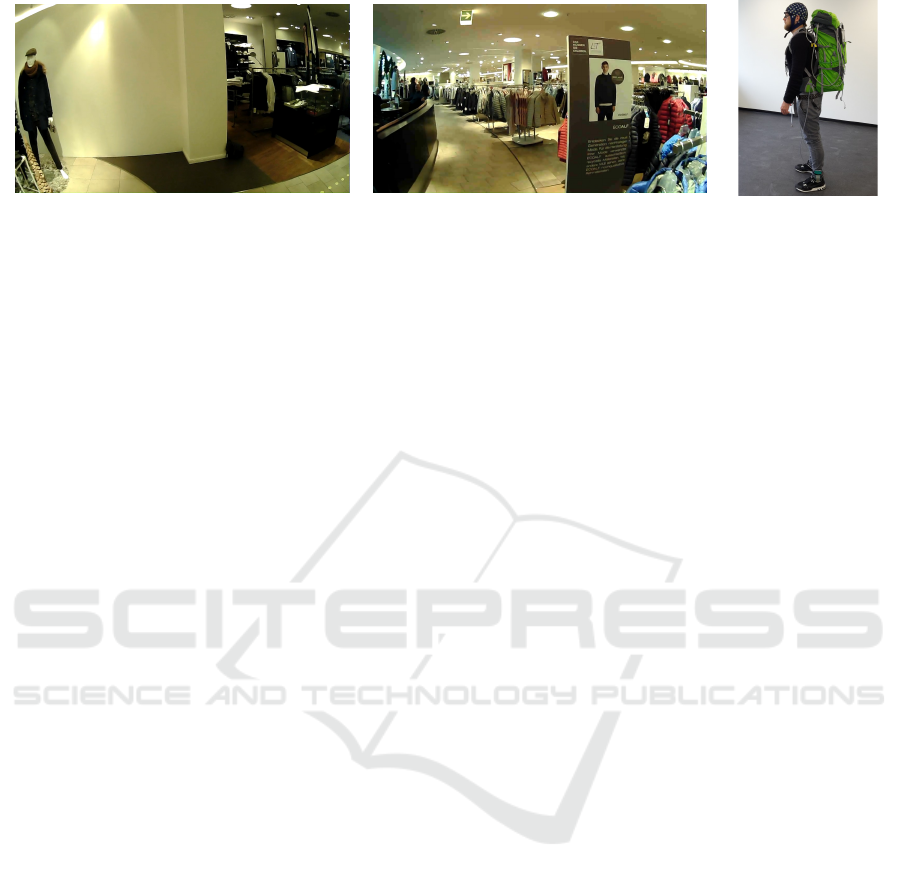
(a) (b)
(c)
Figure 3: Real World Visual Processing example of one subject. (a) first frame, starting point of the subject; (b) last frame,
end point reached; (c) Picture showing the working recording setup using EEG, eyetracking, worldcam and step-sensor.
no explicit task, and the sole instruction given was to
observers was to “study the images and videos care-
fully”. Here we use representative examples of the
movies and frames together with the eye data taken
from single observers.
4.2 Real World Visual Processing
Dataset
These data are part of a larger data set, investigat-
ing electrophysiological markers during free naviga-
tion in a complex, real-world environment. Partici-
pants freely moved and inspected objects in the en-
vironment. No other task was given to the subject.
Together with 128 channel EEG, the recording in-
cludes two custom-made, pressure-sensitive foot sen-
sors, eye tracking data and a scene camera captur-
ing the visual input (cf. Figure 3). EEG data was
recorded at 1024Hz, eye tracking data was recorded
at around 100Hz, and the world camera recorded at
60Hz. Frames taken from the world camera showing
the environment and the complete experimental setup
are presented in Figure 3.
5 PROTOTYPES
The datasets, mentioned above, are used for prototyp-
ing. For providing instantaneous meaningful visual-
izations and sonification, one has to define which at-
tribute of the scientific payload should be used. After
that, one can build the multimedia with these data.
In the following, we describe an example of how
one could create visualizations as well as sonifica-
tions, how these are mixed into the MKV and finally
how non-experts and experts can use these multime-
dia containers.
5.1 Visualization of Data
No matter which subtitle format—ASS or USF—one
uses for encoding the visualization of sensor data, one
has to select which data attributes are to be visualized
and in what way. All datasets introduced in Section 4
provide gaze data, which need to be visualized for
prototyping. As data attributes to be visualized, we
select the subjects gaze position as viewpoint on the
video, their pupil size, and fixations.
Using our open source dataset to USF converter in-
troduced above, we encode the gaze position as point,
where the viewpoints on the video correspond to x and
y attribute of point. Using the diameter attribute, we
visualize the pupil size relative to the average pupil
size of the subject. A visualization of the absolute
pupil size will, due to individual size variations be-
tween subject, not be meaningful in our opinion. Fix-
ations are visualized as squares using the rectangle
shape. The square’s center corresponds to the point
of fixation on the video and width corresponds to the
pupil size. Due to the usually higher sampling rates
of the eye trackers compared to the frames per second
of videos, more than one viewpoint is visualized per
frame, as shown in Figure 4.
The original data content is stored as comment
within the USF file. Note, as described in Section 3,
once the visualization is done in the USF, it can be
easily converted to ASS.
5.2 Sonification of Data
To extract the alpha rhythm from the raw EEG data,
we chose a parietal-occipital electrode (PO3) and
those samples that corresponded to the correspond-
ing frames of the video (61440 samples). Afterward,
the raw signal was band-pass filtered to incorporate
the respective frequency band (8 − 13Hz). We used a
FIR filter with a Hamming window of 1690 samples.
To calculate the power of the resulting filtered sig-
nal, the absolute of the Hilbert transformed data was
VISAPP 2017 - International Conference on Computer Vision Theory and Applications
276
(a) (b)
Figure 4: Visualized gaze data by a reused subtitle track on
a video by a standard multimedia player. The gaze position
on the frames is visualized by a red circle with its diameter
depending on the relative pupil size. Squares visualize fix-
ations. In this example, the sampling rate of the eye tracker
is higher than the frame rate of the video. Thus multiple
points and squares are shown.
squared (Cohen, 2014). The resulting signal repre-
sents the alpha power with respect to the onset of the
video. All preprocessing of the EEG data was done in
EEGlab (Delorme and Makeig, 2004).
We generated the audio signal using MAT-
LAB (The MathWorks Inc., 2014). To sonify the re-
sulting alpha power, two different approaches were
taken. For the frequency modulation, a carrier fre-
quency of 220Hz—corresponding to note a—was
modulated in its frequency by the power of the al-
pha signal. For the volume modulation, the same car-
rier frequency was modulated in its power with re-
spect to the alpha power, with a louder tone meaning
a stronger power. The resulting audio streams were
exported as WAV files.
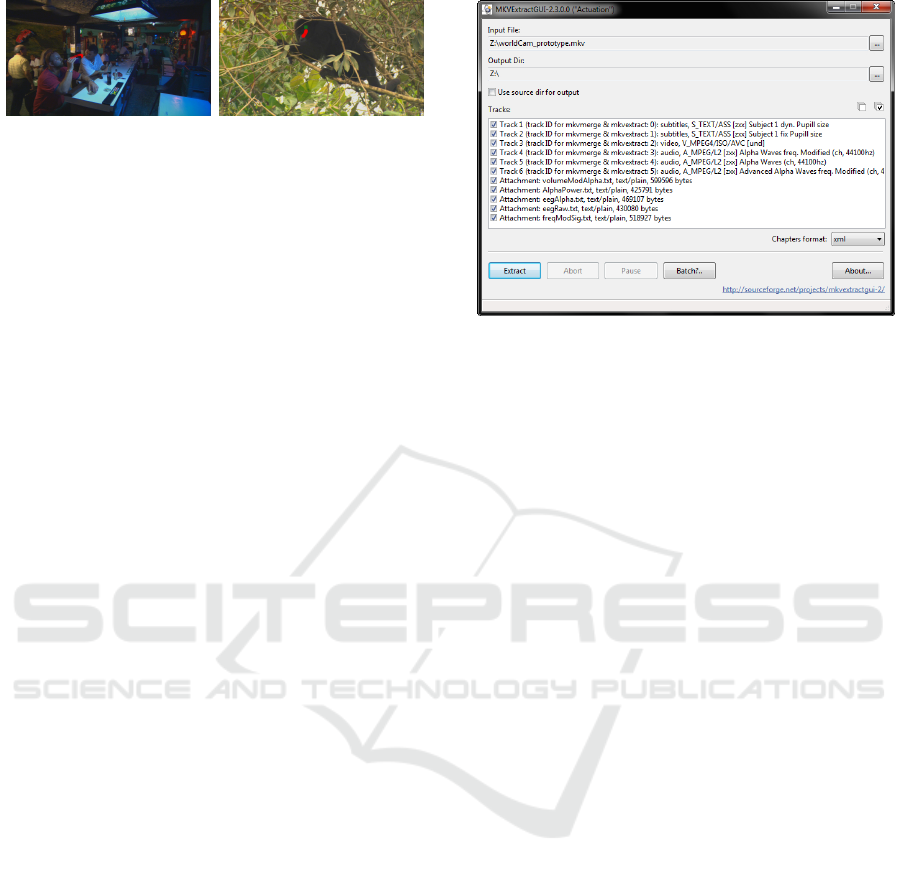
5.3 Creating the MKV Container
Creating, or more precisely muxing, a MKV container
is quite easy and can be done with the command
line or with the graphical user interface version of
mkvmerge (MKVToolNix, 2016). Due to the reded-
icated subtitle formats for the visualizations, all vi-
sualizations are muxed as subtitle tracks, the sonifi-
cations are muxed as audio tracks, and the video or
image stimuli are muxed as video track. As seen in
the track selection of Figure 5, any other data cor-
responding to the multimodal data, like the raw data,
for detailed scientific analysis are muxed as an attach-
ment to the MKV file. In consequence, the whole data
set is archived in one single file, but in contrast to a
data archive, it can be inspected without compiling or
writing any tool.
5.4 Using the MKV Container
The usage of multimodal data presented in a multi-
media container is quite intuitive, as it uses the same
user interface metaphors known from entertainment
content. Hence, the user can change the visualiza-
Figure 5: Demuxing a MKV file, an option for an expert
to extract the raw data for intensive research. In the track
select, one can see the tracks for instantaneous visualization
(video and subtitle tracks), sonification (audio tracks) and
the attachment (general metadata) carrying the raw data.
tions like subtitles as well as the sonifications like
audio languages, shown in Figure 6(a) and (b). Be-
sides this, the user can use built-in visualizations tools
of the media player to enhance the representation of
sonified content (cf. Figure 6(c)). For the expert use,
one can extract all data using mkvextract (MKVTool-
Nix, 2016) as illustrated in Figure 5.
6 USER STUDY
Is multimodal analysis possible with a standard multi-
media player by the use of our multimedia containers?
To answer this, we asked one expert and two non-
experts in the field of multimodal analysis to explo-
ratively investigate these datasets. The major points
of their feedback are mentioned below and discussed
in the next section.
6.1 Professionals
The first response of the expert to this multimodal
data in a multimedia container was “It’s a beautiful
approach because one gets a first expression of the
data without the need to run any scripts or install a
special player”. The expert considers the exploration
of unprocessed data highly useful for several reasons.
First, it allows a plausibility check of the data. Ex-
perimental setups are highly complex and mistakes,
for example in alignment of reference frames or syn-
chronization, might otherwise go undetected. Second,
standard statistical testing often concentrates on low
dimensional subspaces with strong assumptions re-
garding the underlying statistical properties of com-
Exploratory Multimodal Data Analysis with Standard Multimedia Player - Multimedia Containers: A Feasible Solution to Make Multimodal
Research Data Accessible to the Broad Audience
277
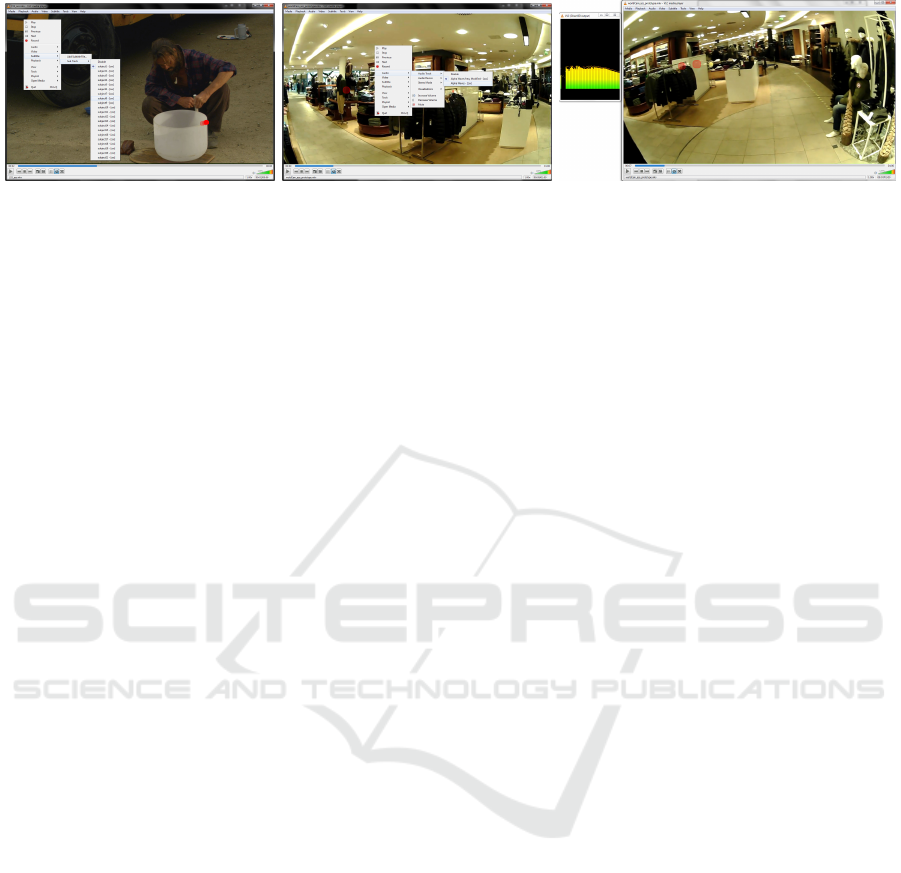
(a) (b) (c)
Figure 6: Exploratory analysis with VLC. (a) one can change the visualizations, here the eye tracking, like subtitles; (b) one
can change the sonification like audio languages; (c) example of sonification. The operator can hear the alpha wave, here
visualized by VLC’s spectrometer.
plex data. Here the visualization and sonification
of high-dimensional data sets is an important tool.
Third, presently the investigation of human sensori-
motor interaction under realistic conditions in natural
environments is largely exploratory (Einh
¨
auser and
K
¨
onig, 2010; Einh
¨
auser et al., 2007). For these cir-
cumstances, the multimodal analysis for the complex
experimental settings is an invaluable tool and guides
the development of explicit hypotheses.
6.2 General Audience
The non-expert users highly appreciated the easy and
interactive demonstration of multimodal data. They
were less interested in complex statistical evaluation
of the data set, but in the generation of a qualitative
look and feel for the data. Furthermore, it “brought to
live” the data and improved understanding of a quan-
titative evaluation. Finally, it served as a helpful back-
drop and means of communication for discussion and
the exchange of ideas. Here, the interactive nature of
data exploration was instrumental. In summary, the
ease of use lowered thresholds to get in close contact
with the data and fostered fruitful discussions.
7 DISCUSSION
Multimodal data, in general, is hard to analyze but
an instantaneous visualization makes selected data
comprehensible to the broad audience, which is in
our opinion, the main advantage of our proposed ap-
proach of storing them in multimedia containers. Ex-
perts might argue that the broad audience is not ca-
pable of formulating the correct assumption from the
data. We, in contrast, think that the broad audience
will understand and agree on assumptions easily if
they can explore the data by themselves. Further,
only selected data and attributes can be visualized or
sonified. Thus, a careful selection by experts must
be made to ensure an objective representation of the
multimodal dataset.
8 CONCLUSIONS
The importance of multimodal datasets in combina-
tion with video and image stimuli as well as their
fields of applications will significantly increase if
they are distributed in multimedia containers, as sug-
gested. Thereby exploratory analysis with com-
mon multimedia players with their well-known user
metaphors is realized and can be performed by both
experts and non-experts. As a result, the datasets
become accessible to the broad audience. The con-
version of multimedia data into the proposed MKV
multimedia container is quite simple as shown in this
work. The converted dataset is a single, streamable
file which still contains all necessary raw data for a
detailed analysis by experts. In a user study, datasets
in the proposed format received almost only posi-
tive feedback. For promoting multimedia containers
as a standard for storing, sharing, representing and
using multimodal data, we published the datasets in
our format and all conversion tools developed in this
project
2
.
In case a significant amount of multimodal dataset
are stored in such standardized format, new fields of
applications can be covered. One of these areas is
cognitive learning using artificial neuronal networks
(ANN). Therefore different kinds of ANNs could be
trained on a specific task like visual search or face
recognition with both kind of data: the stimuli and
the human response. Such training data will lead to
bio-inspired ANNs which help improve current appli-
cations or explain patterns in humans brain by mimic
human-like sensory input. In further work, we are
planning to extend the collection of available mul-
timodal datasets for realizing semantic segmentation
by ANNs.
In conclusion, we believe that the datasets pro-
VISAPP 2017 - International Conference on Computer Vision Theory and Applications
278

vided, shared, visualized and sonified in such a way
will facilitate, besides analysis tasks, applications in
various fields, ranging from sensor improved com-
puter vision (Sch
¨
oning et al., 2016a), over commu-
nication aids in movies for disabled people, to neural
networks with human-like multimodal sensor input.
ACKNOWLEDGEMENTS
This research was supported by H2020-
FETPROACT-2014, 641321 socSMCs.
REFERENCES
Ac¸ık, A., Bartel, A., and K
¨
onig, P. (2014). Real and implied
motion at the center of gaze. Journal of Vision, 14(2):1–
19, doi:10.1167/14.1.2.
Bertellini, G. and Reich, J. (2010). DVD supplements:
A commentary on commentaries. Cinema Journal,
49(3):103–105, doi:10.1353/cj.0.0215.
Bresenham, J. E. (1965). Algorithm for computer control
of a digital plotter. IBM Systems Journal, 4(1):25–30,
doi:10.1147/sj.41.0025.
Cohen, M. X. (2014). Analyzing Neural Time Series Data:
theory and practice. MIT University Press Group Ltd.
Delorme, A. and Makeig, S. (2004). EEGLAB: an
open source toolbox for analysis of single-trial EEG
dynamics including independent component analy-
sis. Journal of Neuroscience Methods, 134(1):9–21,
doi:10.1016/j.jneumeth.2003.10.009.
Einh
¨
auser, W. and K
¨
onig, P. (2010). Getting
real—sensory processing of natural stimuli. Cur-
rent Opinion in Neurobiology, 20(3):389–395,
doi:10.1016/j.conb.2010.03.010.
Einh
¨
auser, W., Schumann, F., Bardins, S., Bartl, K.,
B
¨
oning, G., Schneider, E., and K
¨
onig, P. (2007). Hu-
man eye-head co-ordination in natural exploration. Net-
work: Computation in Neural Systems, 18(3):267–297,
doi:10.1080/09548980701671094.
GNU (2016). Basic Tar Format Version: 1.29
http://www.gnu.org/software/tar/manual/html node/
%53tandard.html.
ISO/IEC (1993). Information technology—coding of mov-
ing pictures and associated audio for digital storage me-
dia at up to about 1,5 Mbit/s—Part 1: Systems (ISO/IEC
11172-1:1993).
ISO/IEC (2001). Information technology—multimedia
content description interface—Part 3: Visual (ISO/IEC
15938-3:2001).
ISO/IEC (2003). Information technology—coding of
audio-visual objects—Part 14: MP4 file format
(ISO/IEC 14496-14:2003).
ISO/IEC (2015). Information technology—generic coding
of moving pictures and associated audio information—
Part 1: Systems (ISO/IEC 13818-1:2015).
Martin, M., Charlton, J., and Connor, A. M. (2015). Main-
streaming video annotation software for critical video
analysis. Journal of Technologies and Human Usability,
11(3):1–13.
Matroska (2016). Matroska Media Container https://www.
matroska.org/.
MKVToolNix (2016). mkvmerge https://mkvtoolnix.
download/doc/mkvmerge.html.
Paris, C., Vialle, L., and Hammer, U. (2016). Ti-
tleVision - USF specs http://register.titlevision.dk/files/
usf-specs-html.zip.
Petrovic, N., Jojic, N., and Huang, T. S. (2005). Adaptive
video fast forward. Multimedia Tools Appl., 26(3):327–
344, doi:10.1007/s11042-005-0895-9.
PKWARE Inc. (2016). ZIP File Format Specifica-
tion Version: 6.3.4 https://pkware.cachefly.net/webdocs/
appnote/appnote-5.2.0.txt.
Rackaway, C. (2010). Video killed the textbook star? use
of multimedia supplements to enhance student learning.
Journal of Political Science Education, 8(2):189–200,
doi:10.2139/ssrn.1547142.
Sch
¨
oning, J., Faion, P., and Heidemann, G. (2016a).
Interactive feature growing for accurate object detec-
tion in megapixel images. Computer Vision ECCV
2016 Workshops, 9913:546556, doi:10.1007/978-3-319-
46604-0 39.
Sch
¨
oning, J., Faion, P., Heidemann, G., and Krumnack, U.
(2016b). Eye tracking data in multimedia containers for
instantaneous visualizations. In IEEE VIS Workshop on
Eye Tracking and Visualization (ETVIS). IEEE [InPress].
Sch
¨
oning, J., Faion, P., Heidemann, G., and Krumnack, U.
(2017). Providing video annotations in multimedia con-
tainers for visualization and research. In IEEE Winter
Conference on Applications of Computer Vision (WACV).
IEEE [InPress].
SSA v4.00+ (2016). Sub Station Alpha v4.00+ Script For-
mat http://moodub.free.fr/video/ ass-specs.doc.
Telepool Media GmbH (2014). Colourful planet collection
courtesy of www.mdr.de.
The MathWorks Inc. (2014). Matlab 2014b.
Vernier, M., Farinosi, M., and Foresti, G. L. (2016). A
smart visual information tool for situational awareness.
In Proceedings of the International Conference on Com-
puter Vision Theory and Applications (VISAPP 2016),
volume 3, pages 238–247. SCITEPRESS.
WebM (2016). WebM Container Guidelines https://www.
webmproject.org/docs/container/.
Wylie, C., Romney, G., Evans, D., and Erdahl, A. (1967).
Half-tone perspective drawings by computer. In Pro-
ceedings of the Fall Joint Computer Conference, AFIPS
’67 (Fall), pages 49–58, New York, NY, USA. ACM.
Xiph.org (2016). Ogg https://xiph.org/ogg/.
Exploratory Multimodal Data Analysis with Standard Multimedia Player - Multimedia Containers: A Feasible Solution to Make Multimodal
Research Data Accessible to the Broad Audience
279
