
Experimental Design and Collection of Brain and Respiratory Data for
Detection of Driver’s Attention
Roman Mou
ˇ
cek
1,2
, Luk
´
a
ˇ
s Hnojsk
´
y
1
, Luk
´
a
ˇ
s Va
ˇ
reka
1,2
, Tom
´
a
ˇ
s Prokop
1, 2
and Petr Br
˚
uha
1,2
1
Department of Computer Science and Engineering, Faculty of Applied Sciences, University of West Bohemia,
Univerzitn
´
ı 8, Pilsen, Czech Republic
2
NTIS – New Technologies for the Information Society, Faculty of Applied Sciences, University of West Bohemia,
Univerzitn
´
ı 8, Pilsen, Czech Republic
Keywords:
Neuroinformatics, Brain Activity, Electroencephalography, Event Related Potentials, Respiration Rate,
Driver’s Attention, Simulated Drive, Data Validation, Deep Learning, Stacked Autoencoder.
Abstract:
Attention of drivers is very important for road safety and it is worth observing even in laboratory conditions
during a simulated drive. This paper deals with design of an experiment investigating driver’s attention, vali-
dation of collected data, and first preprocessing and processing steps used within data analysis. Brain activity
is considered as a primary biosignal and is measured and analyzed using the techniques and methods of elec-
troencephalography and event related potentials. Respiration is considered as a secondary biosignal that is
captured together with brain activity. Validation of collected data using a stacked autoencoder is emphasized
as an important step preceding data analysis.
1 INTRODUCTION
Attention of drivers is a very important factor of road
safety. Inattentive drivers are dangerous to their sur-
roundings and cause a considerable number of acci-
dents. Since decline of attention, especially during
long rides, is natural, it is worthwhile to investigate
it even in laboratory conditions during a simulated
drive. Results from laboratory experiments can be
then used in real environment, e.g. for development of
devices maintaining driver’s attention or development
of autonomous driving systems used at first when the
driver is tired or inattentive.
In this paper we follow experiments and stud-
ies previously provided by our neuroinformatics re-
search group and published in (Mou
ˇ
cek and
ˇ
Re
ˇ
richa,
2012), (Mou
ˇ
cek and
ˇ
Rond
´
ık, 2012), and (Mou
ˇ
cek and
Ko
ˇ
sa
ˇ
r, 2014). A pilot experiment that is in more
detail presented further in this paper partly shares
the same assumption as the already published experi-
ments. However, it differs in design and extends it by
collecting an additional biosignal - data from respi-
ration, and also by validation of collected data using
a stacked autoencoder. Within the presented experi-
ment the experimental design is proposed and the data
and metadata suitable for investigation of influence of
monotonous drive on driver’s attention during simu-
lated drive (a car simulator is used) are collected and
evaluated. Then the basic preprocessing and process-
ing steps used within data analysis are described.
When creating the experimental design the meth-
ods and techniques of electroencephalography (EEG)
and event related potentials (ERP) are used to moni-
tor and analyze brain activity of participating drivers.
Event related potentials measures use stimulation
techniques to investigate brain responses, so atten-
tion of a driver is not only affected by driving on
a monotonous track, but also tested and influenced us-
ing auditory stimulation in our case. It is considered
that the peak latency (peak latency represents a level
of driver’s attention) of the P3 component (the brain
cognitive response described in Section 2) increases
in time as the driver is more tired from monotonous
drive. However, this component has to be first de-
tected in the collected data. Therefore, the data vali-
dation step has to be done. Besides the brain activity
the respiratory rate is also captured and its changes
(most probably its decrease) are anticipated.
University students in the role of tested subjects
participated in the experiment; the captured data were
analyzed and partially interpreted observing particu-
lar trends in them. Due to an assigned page limit,
a more detailed analysis including statistical evalua-
tion and more detailed discussion of the results is not
MouÄ ek R., Hnojská L., VaÅ
´
Zeka L., Prokop T. and BrÅ
´
rha P.
Experimental Design and Collection of Brain and Respiratory Data for Detection of Driver’s Attention.
DOI: 10.5220/0006249504410450
In Proceedings of the 10th International Joint Conference on Biomedical Engineering Systems and Technologies (BIOSTEC 2017), pages 441-450
ISBN: 978-989-758-213-4
Copyright
c
2017 by SCITEPRESS – Science and Technology Publications, Lda. All rights reserved
441

provided. Moreover, since we publicly provide the
collected data, the analysis can be provided by in-
dependent experts. We also realize that the number
of subjects participated in the experiment (15 partic-
ipants) is low for more precise statistical evaluation,
but this number seems to be sufficient for a pilot ex-
periment and for the decision about meaningfulness
of the used experimental design and usability of the
collected data.
The paper is organized as follows. Section 2 gives
a short overview of basic principles of the ERP tech-
nique and assumptions related to amplitude and la-
tency of P3 component. Then some recent exper-
iments dealing with attention of drivers are briefly
presented with respect to the experiments already
presented in papers (Mou
ˇ
cek and
ˇ
Re
ˇ
richa, 2012),
(Mou
ˇ
cek and
ˇ
Rond
´
ık, 2012), and (Mou
ˇ
cek and Ko
ˇ
sa
ˇ
r,
2014). The objectives of the proposed experiment are
given in Section 3. Section 4 deals with experimen-
tal design, used hardware devices and software tools,
participants, environment, and course of the experi-
ment. The collected data and metadata are described
in Subsection 4.5. The validation of the collected data
is provided in Section 5. Sections 6 and 7 describe
data preprocessing and processing. Experimental re-
sults together with final discussion are provided in
Section 8. The last section contains concluding re-
marks.
2 STATE OF THE ART
This section provides a necessary short description of
the ERP technique, the P3 component and the rela-
tion of P3 amplitude and P3 latency to attention. Then
an assumption dealing with respiratory data is given.
Finally, a short overview of EEG/ERP experiments
dealing with driver’s attention is presented.
Electroencephalography (EEG) and event related
potentials (ERP) techniques are used for monitor-
ing brain activity by measuring voltage changes on
a scalp surface. ERPs have two advantages com-
pared to classic behavioral methods: they are useful
for determining which stage or stages of processing
are influenced by a given experimental manipulation
(a detailed set of examples is in (Luck et al., 2000))
and they provide an online measure of the process-
ing of stimuli even when there is no behavioral re-
sponse (Luck, 2005).
The P3 component (also referred to as the P300
component) as one of the event related components
(waveforms) depends entirely on the task performed
by the subject and is not directly influenced by the
physical properties of the stimulus. It is sensitive to
a variety of global factors, such as time since the last
meal, weather, body temperature, and even day time
or the time of year (Luck, 2005). It is not known ex-
actly what the P3 component really means, it is proba-
bly related to a process called context updating (Luck,
2005).
However, there are known factors which influence
the amplitude and the latency of the P3 component.
The P3 component is sensitive to the probability of
a target stimulus. P3 amplitude increases when the
probability of the target stimulus class decreases or
when it is preceded by a greater number of non-target
stimuli. P3 amplitude is also larger when the subject
pays more attention to the task. However, it is smaller
if the subject does not know whether a given stimulus
is / is not a target.
P3 latency is associated with stimulus categoriza-
tion; if stimulus categorization is postponed, P3 la-
tency increases. However, P3 latency does not de-
pend on consequent processes (e.g. response selec-
tion). Thus P3 latency can be used to determine if
a performed experiment influences the processes of
stimulus categorization or processes related to a re-
sponse (Luck, 2005). More detailed information is
available in the literature provided above.
In our case we suppose that stimulus categoriza-
tion is influenced by driver fatigue that is related to
inattention and the time required for low-level sen-
sory processing of incoming stimuli increases with
the level of fatigue. We also consider that respiratory
rate decreases with the level of fatigue.
When omitting behavioral studies, not many ex-
periments dealing with driver’s attention during sim-
ulated drive were performed using the techniques of
electroencephalography and especially event related
potentials.
Suitability of EEG-based techniques is described
in (Schier, 2000); drivers’ activity during a driving
simulation task was recorded. As the result, an in-
crease in alpha activity was interpreted as less atten-
tional activity and a decrease as more attentional ac-
tivity. EEG data as an effective indicator to evalu-
ate driver fatigue are presented in (Li et al., 2012).
The impact of a surrogate Forward Collision Warning
System and its reliability according to the driver’s at-
tentional state by recording both behavioral and elec-
trophysiological data was presented in (Bueno et al.,
2012).
A systematic framework for measuring and un-
derstanding cognitive distraction in the automobile
was presented in (Strayer et al., 2015). Primary,
secondary, subjective, and physiological measures
were collected and integrated into a cognitive dis-
traction scale. Simultaneous recording of EEG and
HEALTHINF 2017 - 10th International Conference on Health Informatics
442

eye-tracking for investigating situation awareness and
working memory load in distracted driving was intro-
duced in (Ichiki et al., 2015).
The ERP technique was used in (Wester et al.,
2008) where the impact of secondary task perfor-
mance (an auditory oddball task) on a primary driv-
ing task (lane keeping) was investigated. The study
showed that when performing a simple secondary task
during driving, performance of the driving task and
this secondary task are both unaffected (Wester et al.,
2008).
Amplitude of the P3 component reflecting individ-
ual differences of navigation performance in a driving
task was investigated in (Bo et al., 2012). Two groups
of navigators with good and poor navigation perfor-
mance participated in a driving task; P3 amplitude
was measured while two types of triggers were pre-
sented (intersections and street signs). Poor naviga-
tors showed larger P3 amplitude than good navigators
on the left hemisphere, right hemisphere, the tempo-
ral, parietal and occipital sites when intersection trig-
gers were presented, and on the occipital site when
street sign triggers were presented, reflecting differ-
ent levels of mental resource needed to process the
spatial information between these two groups.
3 OBJECTIVES OF
EXPERIMENT
The presented experiment was designed and con-
ducted to investigate attention of drivers during sim-
ulated drive. The assumptions described in Section 2
were considered during designing and performing the
experiment and the following objectives were set:
• to construct and implement a monotonous track
where a substantial decrease of attention is sup-
posed,
• to use a car simulator located in our neuroinfor-
matics laboratory,
• to capture the brain activity of drivers during a
simulated drive,
• to use auditory stimuli during experiment to eval-
uate brain activity,
• to capture respiration rate together with drivers’
brain activity monitoring,
• to perform a pilot experiment on a group of at least
ten participants,
• to validate the collected data,
• to annotate, store and made the collected data pub-
lic,
• to compare the latency of averaged P3 compo-
nents and evaluate the respiration waveforms to
give a preliminary view if the results follow the
considerations given in Section 1 and should be
further elaborated.
4 DESIGN OF EXPERIMENT
The design of the experiment is a variant on the clas-
sic odd-ball paradigm in which presentations of se-
quences of frequent (non-target) audio/visual stimuli
are interrupted by infrequent (target) stimuli. Infre-
quent stimuli usually elicit a much larger P3 compo-
nent than frequent stimuli.
Two auditory stimuli were used to elicit the brain
activity of the participants:
• non-target stimulus S1 - the sound of car wipers,
duration time 900 ms, probability of occurrence p
= 0.8,
• target stimulus S2 - the sound of thunder, duration
time 900 ms, probability of occurrence p = 0.2,
Both these stimuli were played from the head-
phones worn by the participants during the whole sim-
ulated drive. The participant had to press the button to
react to each target stimulus. The response button was
located under the steering wheel. Although this re-
sponse event required some movement from the par-
ticipant, it did not cause undesired artifacts. The stim-
ulus onset asynchrony (SOA) was set to 3900 ms (it
means that the interstimulus interval was 3000 ms).
The following rules were applied within the experi-
mental scenario:
• at least two first stimuli are non-targets,
• each target stimulus appears randomly with re-
spect to its probability of occurrence,
• two target stimuli cannot be sequential.
The background sound of drizzling was played
from speakers to imitate the real environment. The
speakers were located inside the car simulator behind
the driver’s seat.
The overall length of the experiment was 60 min-
utes. This length was experimentally verified as a
maximum time frame during which the participant did
not have difficulties (bad feelings) with an EEG cap
placed on his/her head. It was also expected that fa-
tigue would increase approximately after 30 minutes
of driving.
The experiment was divided into three driving ses-
sions, each session lasted 15 minutes and was fol-
lowed by five minutes break. The breaks served both
for relaxation of the participant (from driving and
Experimental Design and Collection of Brain and Respiratory Data for Detection of Driver’s Attention
443

watching the simulation scene) and for preventing
the participant from familiarity with presented stim-
uli (habituation to stimuli was thus limited).
4.1 Hardware Equipment
The experiment was performed in the neuoroinfor-
matics laboratory of the University of West Bohemia,
Czech Republic that was equipped with all necessary
hardware infrastructure for EEG/ERPs and respira-
tory rate recordings. The experimental car simulator
(a front part of a real Skoda Octavia car) was equipped
with the Logitech G27 wheel, accelerator, and brake.
These were connected to the computer via the USB
port.
Three computers were used: the first one for pre-
sentation of auditory stimuli, the second one for stor-
ing recorded data, and the third one for presentation
of the track. The track was projected on the wall in
front of the car simulator. V-Amp produced by the
Brain Products company was used as an EEG ampli-
fier. It served also as an input of the sensor capturing
respiratory rate.
4.2 Software Tools
The stimulation protocol was implemented in the Pre-
sentation software tool produced by Neurobehavioral
Systems, Inc (Neuro Behavioral Systems, 2014). The
sequence of stimuli was generated randomly, but it
always contained the same number of target and non-
target stimuli. All the sounds (including background
drizzling) were recorded using the Audacity software
tool and stored in the .wav format. The track was
prepared using the World Racing 2 game produced
by the Synetic Company (SYNETIC GmbH, 2014).
The same track as in (Mou
ˇ
cek and
ˇ
Re
ˇ
richa, 2012)
was used. The BrainVision Recorder (Brain Products,
2014) was used for recording and storing EEG/ERP
data and respiration rate. MATLAB, EEGLAB, and
ERPLAB software tools were used for processing and
analysis of experimental data.
4.3 Recording System
Common EEG caps (the 10-20 system defining loca-
tions of scalp electrodes) were used depending on the
size of the participants’ heads. The reference elec-
trode was placed approximately 0,5 cm - 1 cm above
the nose and the ground electrode was placed on the
ear. The respiratory rate sensor (produced by the
Brain Products company) as well as the EEG cap were
connected to the V-Amp amplifier.
4.4 Participants and Course of
Experiment
A group of 15 volunteers, university students (thir-
teen men, two women), aged 21-28, participated in
the experiment. The participants got necessary infor-
mation about the experiment in a written form in ad-
vance. Then informed consent was obtained from all
of them.
Before starting the experiment, each participant
was familiarized with basic behavioral rules during an
EEG/ERP experiment (e.g. not to use cosmetic prod-
ucts before the experimental session, or reduce eye
blinking and unnecessary movements to decrease the
number of artifacts). Then the participant was famil-
iarized with all sounds played during the experiment,
with car simulator controls, and with the track. Subse-
quently the participants were allowed to drive around
to get accustomed to the car simulator and simulated
drive.
During the experiment the experimenter was con-
trolling data recording and checking the correct be-
havior of the stimulation program. When the exper-
imental session finished, the participant left the car
simulator. Then the experimenter asked him/her to
fill in the questionnaire containing questions related
to his/her feeling of fatigue during/after the drive.
4.5 Data and Metadata
EEG/ERP data were recorded with the sampling fre-
quency of 1 kHz; no filters were used during data
recording. The resulting signal was stored into three
files:
• .eeg file containing raw data,
• .vhdr file containing metadata that describe raw
data in the related .eeg file,
• .avg file containing the averaged signal around the
used stimuli.
All recorded data and collected metadata were
stored into the EEG/ERP portal (experiments No.
205-209, 225-236) (EEG/ERP Portal, 2016). These
data are publicly available for registered users (regis-
tration is free).
5 DATA VALIDATION
The data validation was based on the main objec-
tive of P3-based experiments: target and non-target
trials are expected to be associated with differently
shaped ERP components, especially P2, N2, and
HEALTHINF 2017 - 10th International Conference on Health Informatics
444

P3 (Blankertz et al., 2011). To validate this objective,
dichotomous machine learning was used. If classi-
fication of a specific dataset from one subject yields
low error rates (defined later), the objective of the
odd-ball paradigm is considered to be fulfilled.
The classifier was trained on a randomly selected
data subset. The training subset contained 730 ERP
trials (described in detail in (Va
ˇ
reka et al., 2014a))
with equal numbers of targets and non-targets. The
trained classifier was subsequently applied to the data
of individual subjects.
The Matlab scripts available in (Va
ˇ
reka et al.,
2014b) and using EEGLAB and BCILAB functions
were used for the implementation. Feature extrac-
tion follows the Windowed Means Method proposed
in (Blankertz et al., 2011). This method includes fea-
ture extraction: low pass filtering and spatial filtering,
and machine learning technique based on one of the
deep learning models - stacked autoencoders. Feature
extraction was described in detail in (Va
ˇ
reka et al.,
2014a). Machine learning was designed as follows.
The Matlab implementation of stacked autoen-
coders was used. The parameters (including number
of layers, number of neurons in each layer, etc.) were
empirically optimized. The experimentation started
with two layers, then either new neurons were added
into the layer, or a new layer was added until the per-
formance of the classifier stopped increasing.
Finally, the following procedure was used to train
the network:
1. The first autoencoder with 100 hidden neurons
was trained. The maximum number of training
epochs was limited to 500.
2. The second autoencoder with 75 hidden neurons
was connected with the first autoencoder to form
a 133-100-75-133 neural network, and trained.
The maximum number of training epochs was
limited to 300.
3. The third autoencoder with 60 hidden neurons
was connected with second first autoencoder to
form a 133-100-75-60-133 neural network, and
trained. The maximum number of training epochs
was limited to 200.
4. The fourth autoencoder with 30 hidden neu-
rons was connected with third autoencoder to
form a 133-100-75-60-30-133 neural network,
and trained. The maximum number of training
epochs was limited to 200.
Furthermore, the following parameters were set
for the network globally: L2WeightRegularization
was set to 0.004, SparsityRegularization was set to 4,
and SparsityProportion was set to 0.18.
After the training of each autoencoder, the input
feature vectors were encoded using that autoencoder
to form input vectors of the next autoencoder.
Using the output of the last autoencoder, softmax
supervised classifier was trained with 200 training it-
erations. Finally, the whole pre-trained 133-100-75-
60-30-2 network was fine-tuned using backpropaga-
tion.
The learned model was first verified on other
P300-based data (Va
ˇ
reka et al., 2014a). Then, for
each subject, error rates depicted by red bars were ob-
tained by applying the classifier in the testing mode.
Let us suppose that we have t
p
- number of correctly
classified targets, t
n
- number of correctly classified
non-targets, f
p
- number of misclassified non-targets,
f
n
- number of misclassified targets. The error rate
was calculated according to Equation 1.
ERR =
f p + f n
t p + tn + f p + f n
(1)
As a result, error rates indicate the extent to which
the classifier was unable to separate target and non-
target single trials. The classification results may
slightly differ with each run because of the indeter-
ministic training process.
6 DATA PREPROCESSING
The recorded EEG/ERP data as well as the data ob-
tained from the respiratory sensor were processed us-
ing the following workflow:
• Channel selection: The following channels cap-
turing brain data were selected for the initial pro-
cessing: Fp1, Fp2, F3, F4, C3, C4, P3, P4, O1,
O2, F7, F8, T3, Fz, Cz, and Pz.
• Driving session selection: Data for each driving
session were processed separately.
• Data filtering: IIR Butterworth filter (frequency
range 0,01 Hz - 20 Hz) was applied to the data.
• Data segmentation: The epochs were extracted
from datasets, data corresponding to each target
and non-target stimulus were selected in the time
interval (-100 ms before the stimulus, 1000 ms af-
ter the stimulus) in the area of occurrence of the
target or non-target stimulus.
• Application of the filter for automatic artifacts de-
tection: The segmented data exceeding the range
(-100 microV, 100 microV) were denoted as pos-
sible artifacts and provided for manual inspection.
• Rejection of corrupted data: The data automati-
cally denoted as artifacts were manually inspected
Experimental Design and Collection of Brain and Respiratory Data for Detection of Driver’s Attention
445

0,00
5,00
10,00
15,00
20,00
25,00
30,00
35,00
40,00
45,00
50,00
0001
0003
0004
0005
0006
0007
0008
0009
0010
0011
0012
0013
0014
0015
0016
Error rate (%)
Participant
Error rates of the P300 component (%)
Figure 1: Results of validation. The error rates for each subject are depicted in bars. Higher error rates mean lower amplitudes
of P3s and/or more distortion in the EEG/ERP signal.
and most of them rejected. Moreover, each dataset
was manually inspected and in case of suspected
artifacts the related epochs were rejected. Arti-
facts were usually caused by eyes blinking, swal-
lowing or movements.
• Baseline correction: The baseline was corrected
using the interval (-100ms, 0ms) before occur-
rence of each target or non-target stimulus.
• Data averaging: The accepted epochs for each
participant and each session were averaged and
stored separately for target and non-target stimuli.
• The data captured by the respiratory sensor were
processed using the following workflow: only the
.vhdr file was read, filtering was applied, and the
scale for respiration visualization was adjusted.
7 DATA PROCESSING
For the next analysis only the channels P3, P4, Fz,
Cz, and Pz (since the occurrence of the P3 compo-
nent is more significant on these channels) were se-
lected. Then grand averages for each driving ses-
sion and each participant were computed (separately
for target and non-target stimuli). The latency of the
P3 component was determined using the technique of
peak latency. It is the simplest way to determine the
latency of the P3 component when the maximum am-
plitude in the time frame of possible occurrence of
the P3 component is searched for. The P3 component
time frame was set to (300 ms, 450 ms) reflecting the
expected location of peak latency values occurrence
in case of auditory stimulation. Finally, the peak la-
tency was determined manually from computed grand
averages.
8 RESULTS AND DISCUSSION
The results from performed experiments are summa-
rized in the figures and tables presented further. The
P3 component for the participant 0010 and the val-
ues of his/her peak latency for the first driving session
and for channels P3, P4, Fz, Cz, and Pz are shown in
Figure 2.
It can be seen that the component P3 is clearly
identifiable and there is a substantial difference be-
tween reaction to target and non-target stimuli. How-
ever, the identification of the P3 component was not
so evident for all participants. This is shown in Ta-
ble 1 where peak latencies for selected channels and
each driving session are available.
The data collected from participant 0002 were
rejected, the resulting values were out of reason-
able range, most probably because of technical fail-
ure during the measurement. The data from partici-
pants 0005, 0006, 0008, and 0009 were also not fur-
ther interpreted since the N2 component (a repetitive,
non-target stimulus elicits N2 deflection that can be
thought of as the basic N2 component) had a very high
amplitude while the component P3 was not clearly ev-
ident (an example for the participant 0006 is available
in Figure 3). It can also easily observed that the am-
plitude of the N2 component decreased in time; the
difference in peak amplitudes of this component is
HEALTHINF 2017 - 10th International Conference on Health Informatics
446
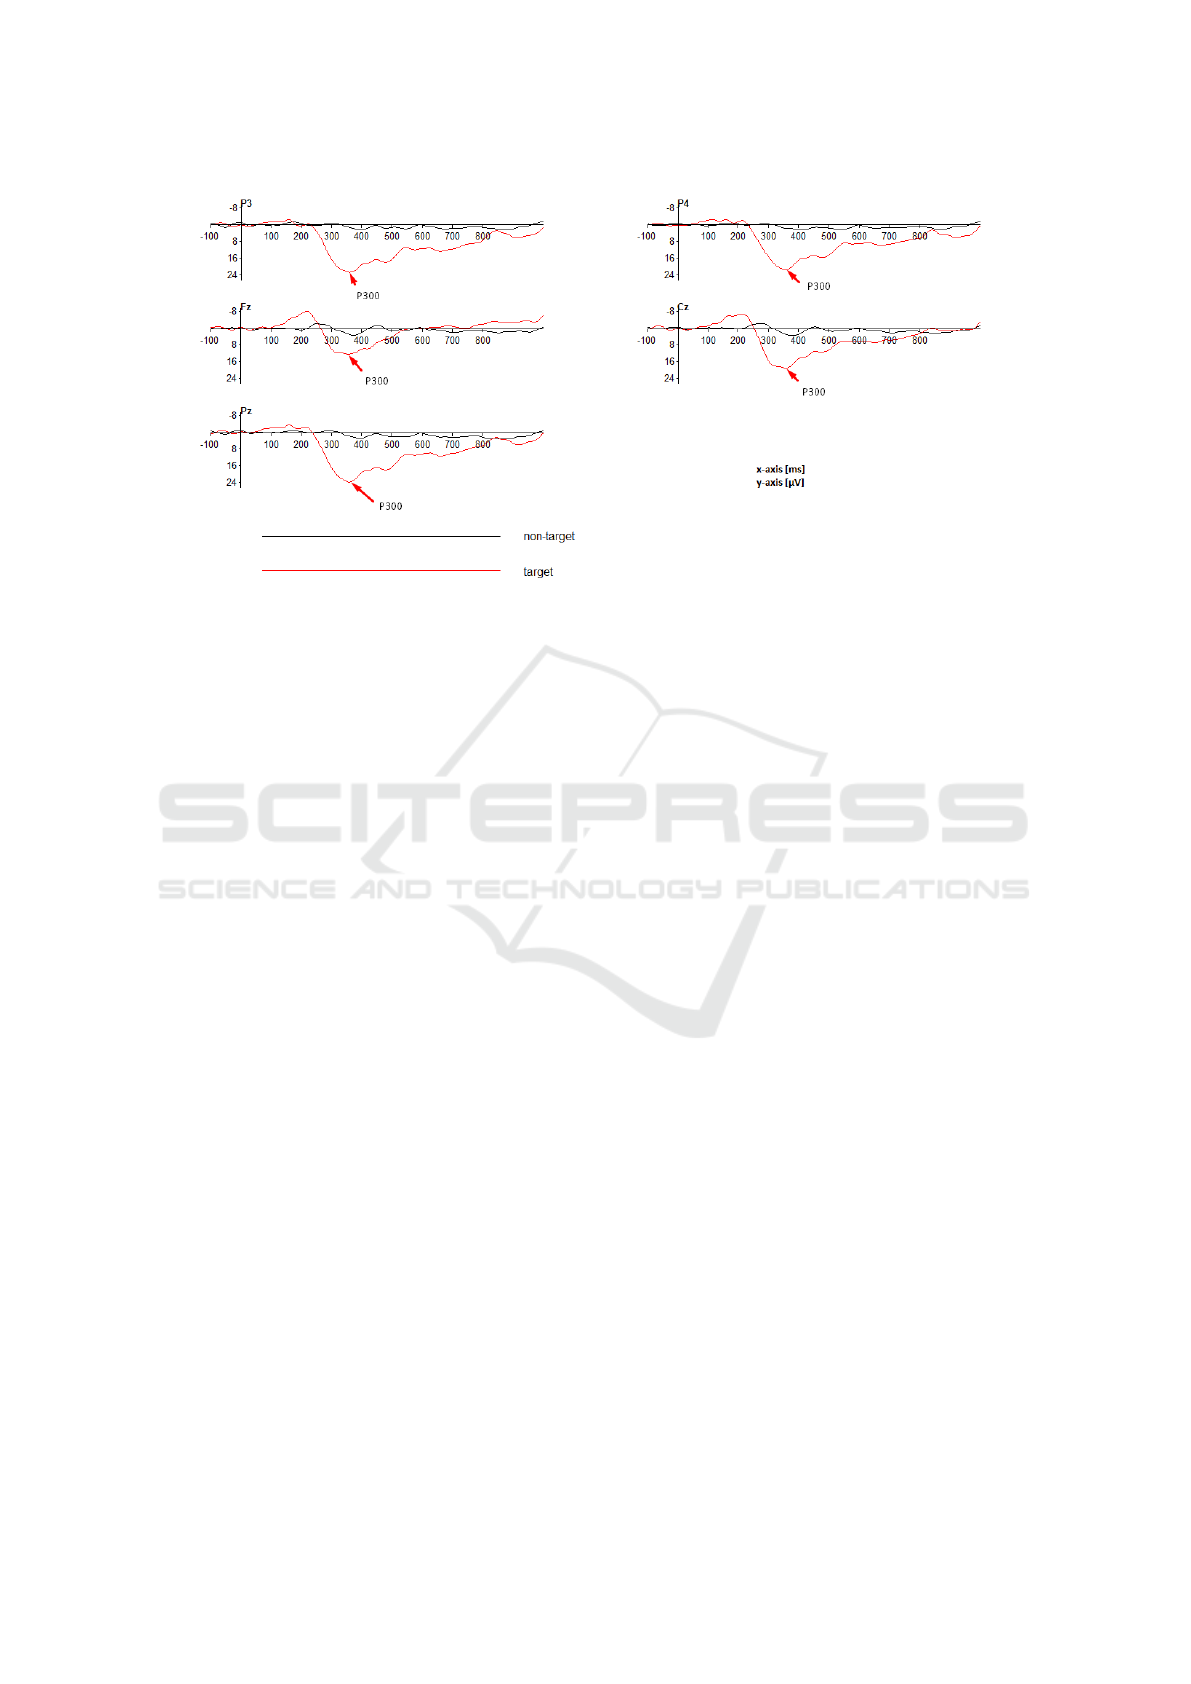
Figure 2: Grand average for participant 0010, the first driving session, channels P3, P4, Fz, Cz, and Pz, peak latency of the P3
component for target and non-target stimuli.
noticeable comparing the waveforms for each driving
session. It was probably caused by habituation of par-
ticipants during the course of the experiment.
However, it does not mean that the data contain-
ing high N2 amplitude and low P3 amplitude are in-
correct. Since we were unsure with their correct inter-
pretation, they were rejected only for this preliminary
analysis. It is reasonably possible that they will be
considered for later analysis after reviewing them by
another expert in the field. The data from participants
0012 and 0013 were not interpreted because of low
amplitude of the P3 component.
It is also evident that peak latencies differ among
the participants in average. This is a natural phe-
nomenon that reveals that the cognitive processing of
stimuli is different for each individual in the consid-
ered time frame. It can be also seen that the aver-
age latency for all participants for each selected chan-
nel increased as the experiment continued to the next
driving sessions.
However, different results we got by computing
grand averages for all epochs containing the target
stimulus and for all participants. It is not an average
of peak latencies as computed above, all waveforms
related to the target stimulus within driving sessions
were averaged. The resulting waveforms are given in
Figure 4. The determined values of peak latency for
averaged waveforms are clearly shown in Table 2. It
can be seen that grand averages for target stimuli, se-
lected channels and all participants differ between the
first and second driving session, while there is no ev-
ident difference between the second and third driving
session.
The respiration rate was computed for each par-
ticipant and for each driving session as it can be seen
in Table 3. The average respiratory rate decreased in
time. Participants 0013 and 0014 had an increased
respiratory rate in all driving sessions in general, but
it also decreased within the course of the experiment.
The values from participants 0002 and 0015 were not
captured correctly due to technical difficulties with
the sensor.
9 CONCLUSIONS
This paper described the experiment dealing with at-
tention of drivers during a simulated drive. Brain ac-
tivity and respiratory rate of the participants of the
experiment were measured and investigated by us-
ing mainly the methods of electroencephalography
and event related potentials. Drivers, university stu-
dents, were stimulated by simple auditory stimuli
while driving a car simulator on a monotonous track.
The collected data were annotated, stored, prepro-
cessed, validated, and partly analyzed. The peak la-
tency of the P3 component was derived from the data
and grand averages for each participant and driving
session as well as grand averages for all participants
and each driving session were computed.
Experimental results showed that the P3 compo-
nent had been identified at most participants during
all driving sessions. However, some experimental re-
sults were not interpreted in this article because of the
high amplitude of the N2 component compared to the
amplitude of the P3 component. Prolongation of the
peak latency of the P3 component was evident in case
of most participants and in case of simple averaging of
Experimental Design and Collection of Brain and Respiratory Data for Detection of Driver’s Attention
447
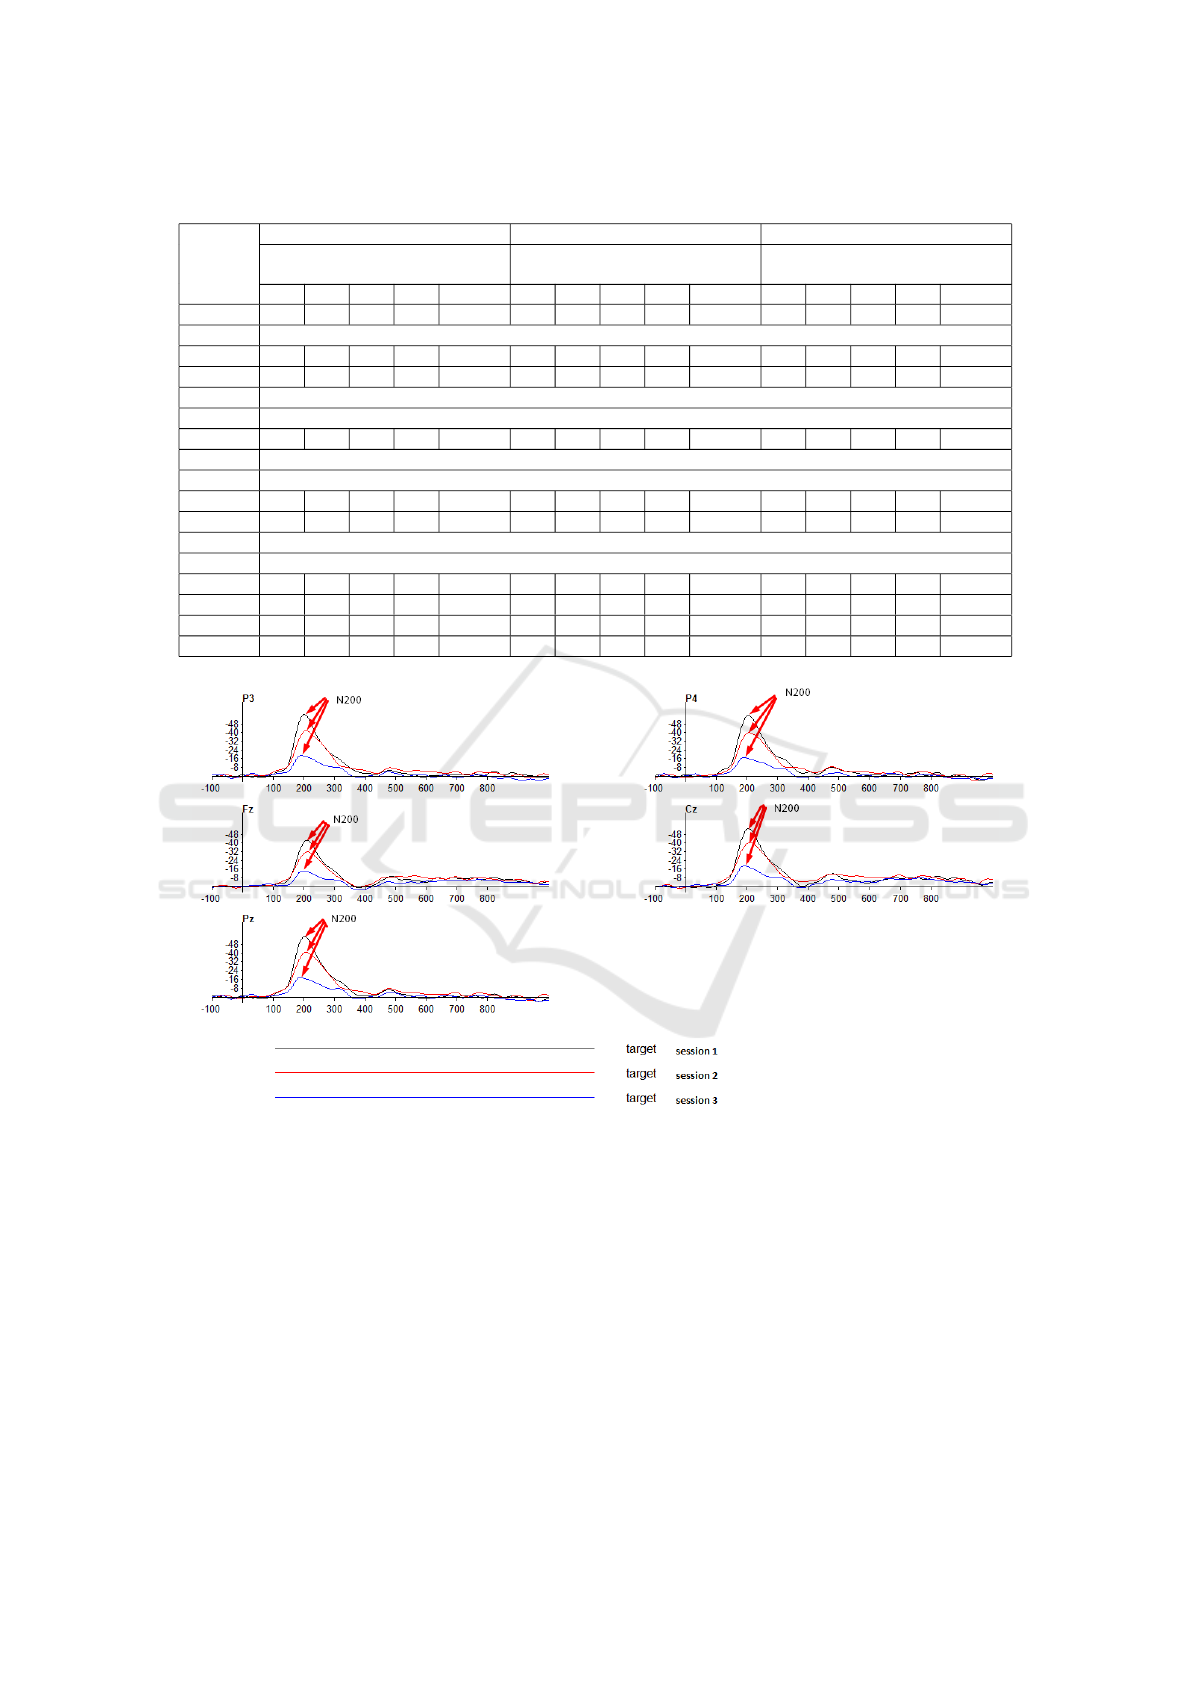
Table 1: Grand averages for driving sessions, participants and selected channels.
Participant
1st driving session 2nd driving session 3rd driving session
Peak latency of P3 component [ms] on
channels
Peak latency of P3 component [ms] on
channels
Peak latency of P3 component [ms] on
channels
P3 P4 Fz Cz Pz P3 P4 Fz Cz Pz P3 P4 Fz Cz Pz
0001 423 421 336 410 418 452 450 404 406 486 497 507 402 400 497
0002 rejected because of technical failure
0003 383 384 382 386 383 390 416 394 399 378 398 431 387 398 346
0004 459 443 422 435 445 464 462 409 456 455 473 476 454 465 469
0005 too high amplitude of N200 component
0006 too high amplitude of N200 component
0007 345 334 323 343 341 356 353 357 356 354 357 355 359 358 356
0008 too high amplitude of N200 component
0009 too high amplitude of N200 component
0010 361 356 357 357 359 389 389 391 389 389 399 397 394 398 396
0011 317 318 347 305 322 319 311 309 303 327 363 410 307 304 407
0012 Low amplitude of P3 component
0013 Low amplitude of P3 component
0014 351 348 358 347 350 399 336 353 337 335 448 359 399 363 365
0015 444 413 404 406 411 428 418 411 415 418 498 505 448 456 449
0016 405 404 392 387 404 418 416 404 406 415 404 389 402 393 399
Avg 388 380 369 375 381 402 395 381 385 395 426 425 395 393 409
Figure 3: Grand average for the participant 0006, channels P3, P4, Fz, Cz, and Pz, peak latency of the N2 component for
target stimulus.
their peak latencies. Despite expectations, prolonga-
tion of peak latency in time was not clearly observed
when grand averages for all participants were inves-
tigated. This prolongation is evident only as a dif-
ference between grand averages of the first and sec-
ond driving sessions. We also supposed that when the
driver expected his/her drive to be almost completed
(during the third driving session), his/her attention in-
creased. The average respiration rate and respiration
rates for most participants showed a decreasing trend
during the course of the experiment.
The results in this article were not statistically
evaluated. However, the trend of increasing latency
and decreasing respiratory rate is clearly visible. The
experimental results were naturally affected by differ-
ent brain reactions of participated drivers and sensi-
bility of captured data to the environmental noise, par-
ticipants’ overall mental conditions, and their move-
ments that caused occurrences of artifacts. Although
there was a big effort to eliminate these circumstances
by experimental design, setting of experimental con-
ditions, and usage of data preprocessing and process-
HEALTHINF 2017 - 10th International Conference on Health Informatics
448
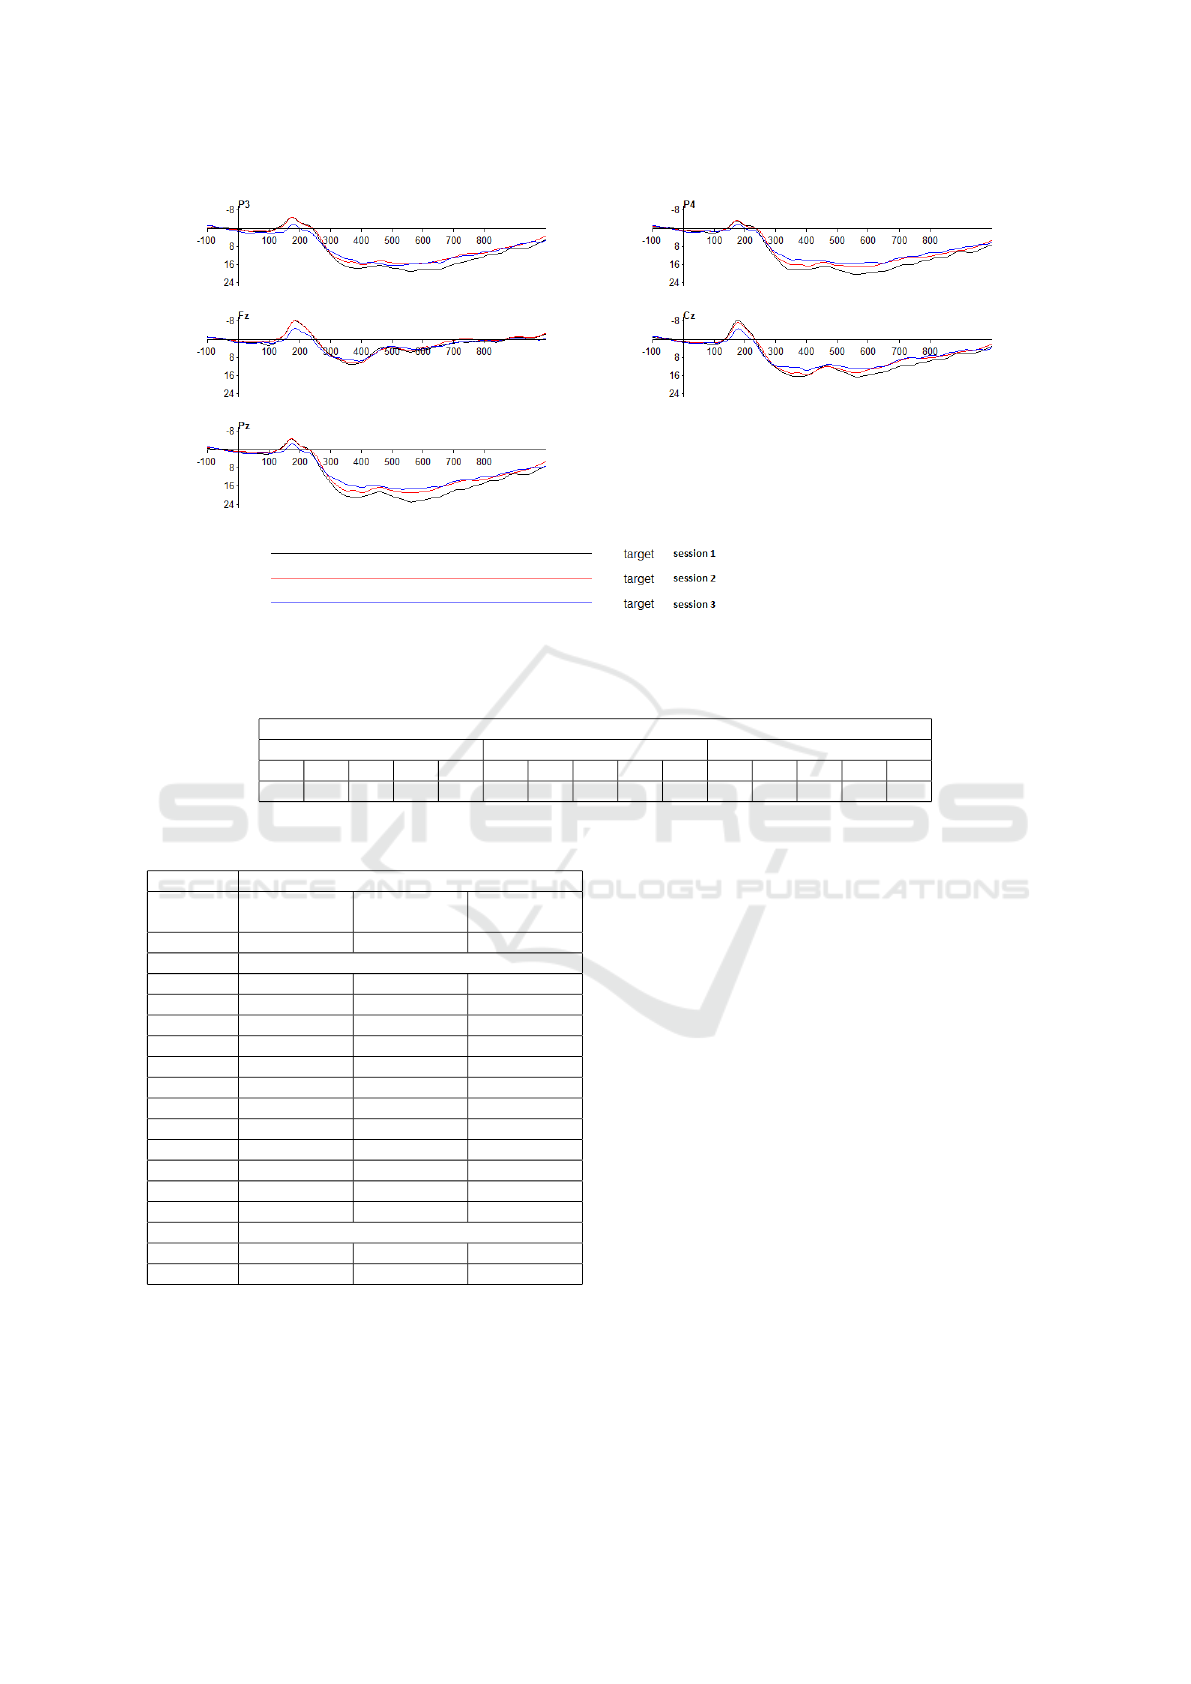
Figure 4: Grand averages for all participants, channels P3, P4, Fz, Cz, and Pz, peak latency of the P3 component for the target
stimulus.
Table 2: Grand averages of peak latencies of the P3 component in [ms] for selected channels, target stimulus.
Grand average
1st driving session 2nd driving session 3rd driving session
P3 P4 Fz Cz Pz P3 P4 Fz Cz Pz P3 P4 Fz Cz Pz
391 391 369 386 389 407 407 395 402 405 406 405 395 402 402
Table 3: Respiration rate for each participant and driving
session.
Respiratory rate
Participant 1st driving ses-
sion
2nd driving
session
3rd driving
session
0001 18 16 16
0002 rejected
0003 16 15 14
0004 15 14 14
0005 19 18 18
0006 16 16 15
0007 16 15 15
0008 18 17 16
0009 17 17 15
0010 16 15 15
0011 14 13 13
0012 18 18 18
0013 23 22 22
0014 26 25 25
0015 rejected
0016 16 16 16
Avg 17,69 17,00 16,62
ing methods, they could not be completely removed.
That is why we also validated the collected data using
the stacked autoencoder.
The observations collected by experimenters from
the participants were also summarized. The partic-
ipants (they filled in the questionnaire) did not re-
port a highly increased level of fatigue after having
finished their experiment. Although the participants
complained about the tedious ride, the stimulation
kept them relatively attentive. One third of partici-
pants pointed out that they would like to drive longer
without any brake. On the other hand, most partic-
ipants complained about unpleasant feelings caused
by the ground electrode placed on their ear. This feed-
back have been used for the design of further ongoing
experiments.
We believe that by using the results of ongoing
research and technological innovations it will possi-
ble to capture biosignals more easily in the future.
It would facilitate recognition of the human attention
level and decrease the number of accidents not only
in transport but also during activities that are directly
influenced by human attention.
ACKNOWLEDGMENTS
This publication was supported by the UWB grant
SGS-2016-018 Data and Software Engineering for
Advanced Applications and the project LO1506 of the
Czech Ministry of Education, Youth and Sports under
the program NPU I.
Experimental Design and Collection of Brain and Respiratory Data for Detection of Driver’s Attention
449

REFERENCES
Blankertz, B., Lemm, S., Treder, M., Haufe, S., and M
¨
uller,
K.-R. (2011). Single-trial analysis and classifica-
tion of erp components – a tutorial. NeuroImage,
56(2):814 – 825. Multivariate Decoding and Brain
Reading.
Bo, O., Changxu, W., Guozhen, Z., and Jianhui, W. (2012).
P300 amplitude reflects individual differences of nav-
igation performance in a driving task. International
Journal of Industrial Ergonomics, 42(1):8–16.
Brain Products (2014). Brain vision recorder.
Bueno, M., Fabrigoule, C., Deleurence, P., Ndiaye, D., and
Fort, A. (2012). An electrophysiological study of the
impact of a forward collision warning system in a sim-
ulator driving task. Brain Research, 1470:69–79.
EEG/ERP Portal (2008-2016). EEG/ERP Portal.
Ichiki, M., Ai, G., and Wagatsuma, H. (2015). Simultane-
ous recording of eegs and eye-tracking for investigat-
ing situation awareness and working memory load in
distracted driving: A prospective analysis toward the
neuro-driving framework. Frontiers in Neuroscience,
(10).
Li, W., He, Q.-C., Fan, X.-M., and Fei, Z.-M. (2012). Eval-
uation of driver fatigue on two channels of eeg data.
Neuroscience Letters, 506(2):235–239.
Luck, S., Woodman, G., and Vogel, E. (2000). Event-related
potential studies of attention. Trends in Cognitive Sci-
ences, 4(11).
Luck, S. J. (2005). An Introduction to the Event-Related Po-
tential Technique (Cognitive Neuroscience). A Brad-
ford Book, 1 edition.
Mou
ˇ
cek, R. and Ko
ˇ
sa
ˇ
r, V. (2014). Attention of driver dur-
ing simulated drive. HEALTHINF 2014 - 7th Inter-
national Conference on Health Informatics, Proceed-
ings; Part of 7th International Joint Conference on
Biomedical Engineering Systems and Technologies,
BIOSTEC 2014, pages 543–550.
Mou
ˇ
cek, R. and
ˇ
Re
ˇ
richa, J. (2012). Driver’s attention dur-
ing monotonous driving. 2012 5th International Con-
ference on Biomedical Engineering and Informatics,
BMEI 2012, pages 486–490.
Mou
ˇ
cek, R. and
ˇ
Rond
´
ık, T. (2012). Influence of mental
load on driver’s attention. Transaction on Transport
Sciences, 5(1):21–26.
Neuro Behavioral Systems (2014). Home page.
Schier, M. (2000). Changes in eeg alpha power during simu-
lated driving: A demonstration. International Journal
of Psychophysiology, 37(2):155–162.
Strayer, D., Turrill, J., Cooper, J. M., Coleman, J. R.,
Medeiros-Ward, N., and F., B. (2015). Assessing cog-
nitive distraction in the automobile. Human Factors:
The Journal of the Human Factors and Ergonomics
Society, 57(8):1300–?1324.
SYNETIC GmbH (2014). World racing 2.
Va
ˇ
reka, L., Br
˚
uha, P., and Mou
ˇ
cek, R. (2014a). Event-
related potential datasets based on a three-stimulus
paradigm. GigaScience, 3(1):35.
Va
ˇ
reka, L., Br
˚
uha, P., and Mou
ˇ
cek, R. (2014b). P3-
validator.
Wester, A., B
¨
ocker, K., Volkerts, E., Verster, J., and Ken-
emans, J. (2008). Event-related potentials and sec-
ondary task performance during simulated driving.
Accident Analysis and Prevention, 40(1):1–7.
HEALTHINF 2017 - 10th International Conference on Health Informatics
450
