
Evaluating Spatial Coverage of Breast Examination with Free-hand
Ultrasound Transducer
Zuzana B
´
ılkov
´
a
1
, Michal Barto
ˇ
s
1
, Jan Schier
1
, Filip
ˇ
Sroubek
1
, Barbara Zitov
´
a
1
, Jan Vydra
2
and Jan Dane
ˇ
s
3
1
The Institute of Information Theory and Automation of the Czech Academy of Sciences, Prague, Czech Republic
2
Medico ltd., Prague, Czech Republic
3
First Faculty of Medicine, Department of Radiology, Charles University, Prague, Czech Republic
Keywords:
Breast Imaging, Ultrasound Examination, Tracking, Examination Quality Assessment, 3D Reconstruction.
Abstract:
Ultrasound examination plays an important role in both breast cancer screening and diagnostics. One of the
drawbacks of the US examination is the uncertainty whether the whole breast was scanned. The proposed
paper addresses the methodology how the completeness of the examination can be efficiently evaluated. We
propose an affordable solution for simultaneously tracking and grabbing a video from a free-hand 2D ul-
trasound transducer during standard breast examinations by means of the probe motion tracking. From the
recorded data we calculate duration in seconds, for which every part of the examined region has been captured
and perform algorithmically local 3D reconstruction. Thus the system can inform the specialist performing
the exam about regions that were insufficiently examined and minimize the risk of not detecting developing
harmful lesions. The measure for the evaluation and comparison of the individual examinations is proposed.
The functionality of the method is illustrated.
1 INTRODUCTION
Breast cancer is the most common malignancy in
women and the second most common cause in cancer-
related mortality. The widespread methodology for
the breast cancer screening is mammography, which
provides almost complete breast pictures at two pro-
jections with high sensitivity to microcalcification.
Breast ultrasound (US) is often used to evaluate breast
problems that are found by a mammogram, especially
for women with palpable lesions on physical exam or
with dense breast. For the latter situation, the study
(Boyd et al., 2007) revealed that extensive mammo-
graphic density, which is the case in more than 50 %
in the age group under 60 (for younger woman this
reaches even 75 %), is reproducibly associated with
an increased risk of breast cancer. Here, the role
of the US exams is hardly replaceable. US aids in
distinguishing normal findings such as cysts or fat
lobules from suspicious breast changes that require
biopsy. It helps to better evaluates the lymph node
involvement. Nevertheless, the US examination can-
not be used as the sole one because of the inappro-
priate high false negative rate. The current trend is to
use a combined set of diagnostic techniques for detec-
tion of breast cancer, usually mammography and US,
recently also magnetic resonance imaging (MRI) or
dedicated breast CT.
The US examination is painless and does not ex-
pose patients to radiation. On the other hand, the use
of US for breast cancer screening is often limited by
experience and skills of examiners, resolution of de-
vice, and, last but not least, by the length of examina-
tion. An important, albeit usually overlooked, draw-
back of the US examination is the uncertainty whether
the whole breast has been scanned. There was an at-
tempt to assess the completeness of freehand breast
ultrasound scans (Andrei et al., 2014) using the breast
phantom in simulated clinical exams.
The purpose of the work presented in this paper
is twofold: first, it is intended as a base for develop-
ment of a system for systematic evaluation of breast
coverage, which will essentially provide feedback on
breast coverage. Second, the system is expected to
provide, using 2D scans and the data from a tracker, a
3D reconstruction of breast examination, with better
depiction of lesions.
There have been numerous attempts to reconstruct
3D data from the handheld US probe, either based on
128
Bà lkovà ˛a Z., BartoÅ ˛a M., Schier J., Å
˘
aroubek F., Zitovà ˛a B., Vydra J. and DaneÅ ˛a J.
Evaluating Spatial Coverage of Breast Examination with Free-hand Ultrasound Transducer.
DOI: 10.5220/0006249101280133
In Proceedings of the 10th International Joint Conference on Biomedical Engineering Systems and Technologies (BIOSTEC 2017), pages 128-133
ISBN: 978-989-758-215-8
Copyright
c
2017 by SCITEPRESS – Science and Technology Publications, Lda. All rights reserved
a solely algorithmic support (Yu et al., 2011) or using
some kind of tracking device for the 3D data compo-
sition (Huang et al., 2005; Huang and Zheng, 2008;
Coup
´
e et al., 2005). Recently, even the 3D volumes
were proposed to be registered by software methods
(Dyer et al., 2014) to obtain more complex represen-
tation of the scanned scene. Very good overview of
existing approaches can be found in (Gee et al., 2003).
Finally, it should be noted that there are 3D ultra-
sound systems working in an automatic manner (au-
tomated breast ultrasonography - ABUS) (Shin et al.,
2015), too. 3D ultrasound is considered as promis-
ing new technology, especially applicable to screen-
ing for breast cancer in women with dense breast tis-
sue. However there are certain limitations in acquisi-
tion geometries and in price level, which could limit
application of such equipment.
The rest of the paper is organized as follows.
Sec. 2 describes the proposed US setup and measures.
Sec. 3 shows first results that were achieved with our
device and Sec. 4 concludes the paper.
2 METHODOLOGY
During a clinical breast exam, we record the ultra-
sound images and the position and orientation of the
ultrasound transducer. For this purpose we use an
off-the-shelf grabbing PC card in combination with
a tracking device.
In the proposed system the probe position data are
collected seamlessly without any need for human in-
teraction so the specialist performing the exam is not
distracted. With the help of the tracking system, we
can estimate the location of the probe and its trajec-
tory through the examined region, and from these data
also the frequency and duration of visits.
The hardware setup used to acquire all the neces-
sary data during ultrasound examination consist of a
computer with a digital video grabber and an electro-
magnetic six degrees of freedom tracking system
(TrakSTAR, Ascension Technology Corp., Shelburne,
VT, USA). The electro-magnetic field generator, the
reference sensor and the sensor mounted on the US
transducer are connected to the computer through a
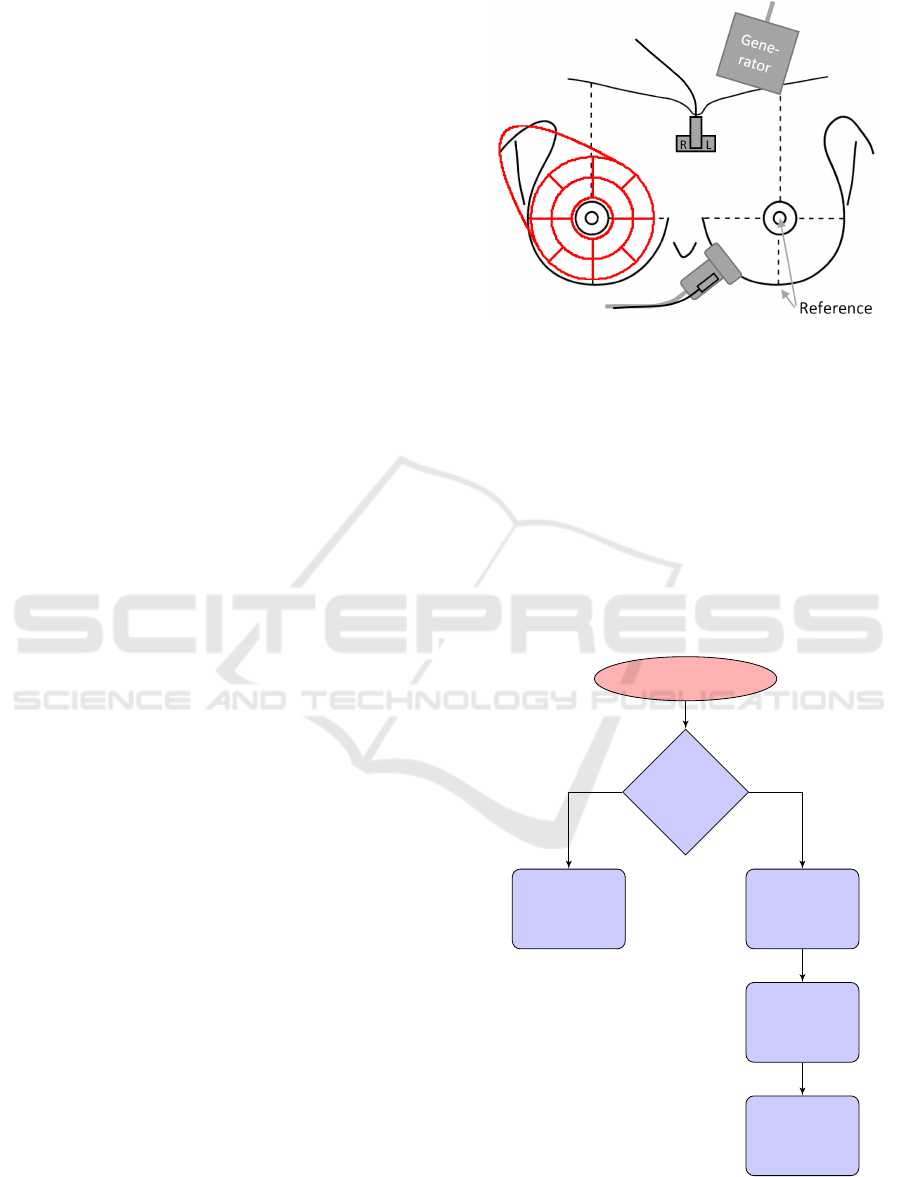
control unit. The arrangement of the tracker sensors
and reference points is outlined in Fig. 1. The accu-
racy of this technology is on par with the resolution
of the ultrasound device.
The video grabber and the tracking system are
controlled using the PLUS open-source software
package (Lasso et al., 2014), which also allows to per-
form the necessary sensor and temporal calibrations
(prior to examinations) and synchronization of video
Figure 1: Outline of the system setup with defined refer-
ence points (two cross marks). Two electro-magnetic track-
ing sensors are used in the setup, one attached to the ultra-
sound transducer and the “Reference” one, placed on pa-
tient’s sternum, which holds a ”Right-Left” plate. Prede-
fined sectors for evaluation of an examination, for which
the average time spent and the entropy are calculated, are
outlined in red color.
and spatial data. The whole process of storing proper
data during examinations is controlled by an in-house
developed software. The software recognizes if the
US image is “frozen” or not, which allows the physi-
cian to simply interact with the system (see Fig. 2).
Image grabber
Freeze
detected?
Record
probe
position
Filter “Not
in touch”
condition
Evaluate
coverage
map
Display
frozen
image
yes
no
Figure 2: Operation modes of the coverage mapping sys-
tem.
Considered from the physician’s perspective, the
Evaluating Spatial Coverage of Breast Examination with Free-hand Ultrasound Transducer
129
Start
Place probe mark
on ref. point 1
(nipple)
Freeze
Place probe mark
on ref. point 2
Freeze
Start
examination
Figure 3: Calibration of the tracker system. Reference
point 1 is located at breast nipple, refernce point 2 is located
on the border between lower part of breast and the chest.
whole examination runs as follows: the physician
places the reference sensor on patient’s sternum un-
der jugulum and using computer, starts the tracking
system. He records the position of the two refer-
ence points (Fig. 1) by placing the “marked” side
of the transducer on each point and pressing the
“freeze” button. This allows us to calibrate the coor-
dinate system for the breast position (see the chart in
Fig. 3). Then the standard examination proceeds dur-
ing which the transducer is continuously tracked and
images are automatically stored with the maximum
frame rate of the ultrasound system (typically around
30 FPS). Locations of potential findings can be easily
stored by pressing the “freeze” button anytime during
the examination. The acquired data sequence (trans-
formation matrices and US images) is pruned to get
only the valid part. Typically, any data corresponding
with the periods when the transducer was not in touch
with the body are removed.
Transducer Trajectory Visualization
The valid data are analyzed in the 3D reference co-
ordinate system (R ) defined by the reference sen-
sor and its axis, which coincides well with standard
anatomical planes. Choosing the coordinate system
of the sensor attached to a patient eliminates respira-
tory or other body motion. Let us denote the coordi-
nate system of US image acquired at time t by I
t
. The
−200
−150
−100
−50
0
50
−100
−50
0
50
100
150
200
−100
−50
0
x (mm)
y (mm)
z (mm)
10 20 30 40 50 60 70
(a) Screening
−200
−150
−100
−50
0
50
−100
−50
0
50
100
150
200
−100
−50
0
x (mm)
y (mm)
z (mm)
20 40 60 80 100 120
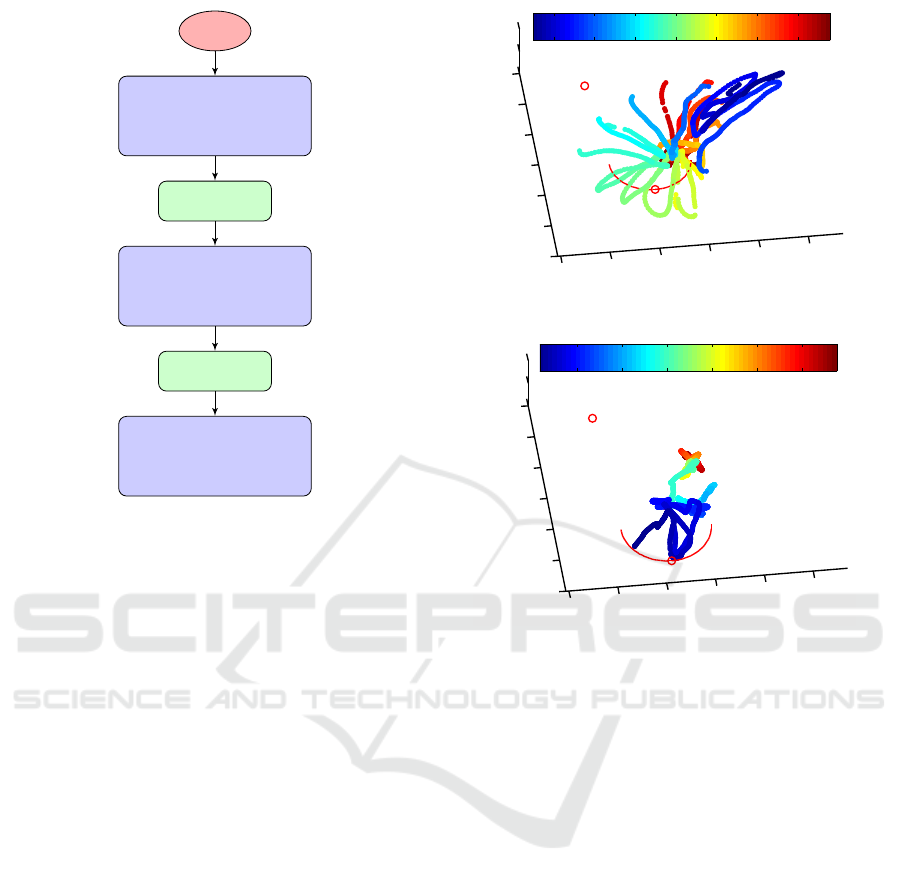
(b) Diagnosis
Figure 4: Color-coded trajectory of the probe center on skin
during (a) screening examination and (b) diagnostic exami-
nation (focused on suspect breast region). Colors show time
in seconds. The coordinate system in millimeters is defined
by the reference sensor (origin denoted by the left-top cir-
cle) and the position of the breast is marked by the semi-
circle curve, which is calculated from the reference points.
tracking device calculates a geometrical transforma-
tion T
t
: I
t
→ R that maps image pixels at time t to
the reference coordinate system. The transformation
T
t
allows us to provide several useful visualizations:
to display the transducer trajectory in R , we apply T
t
to the central pixel of the image in I
t
and plot the 3D
points with color mapping derived from time t. Ex-
amples are given in Fig. 4.
Visualization of Examination Coverage
An important task is the visualization of time spent in
each part of the breast and adjacent tissues. In other
words, we want to know how frequently every loca-
tion of R has been captured in the images. This is
done by voxelization (discretization) of the reference
coordinate system R . Each voxel coordinate is trans-
formed by the inverse T
−1
t
to I
t
, the voxel value is
incremented if it lies in the respective image domain
BIOIMAGING 2017 - 4th International Conference on Bioimaging
130
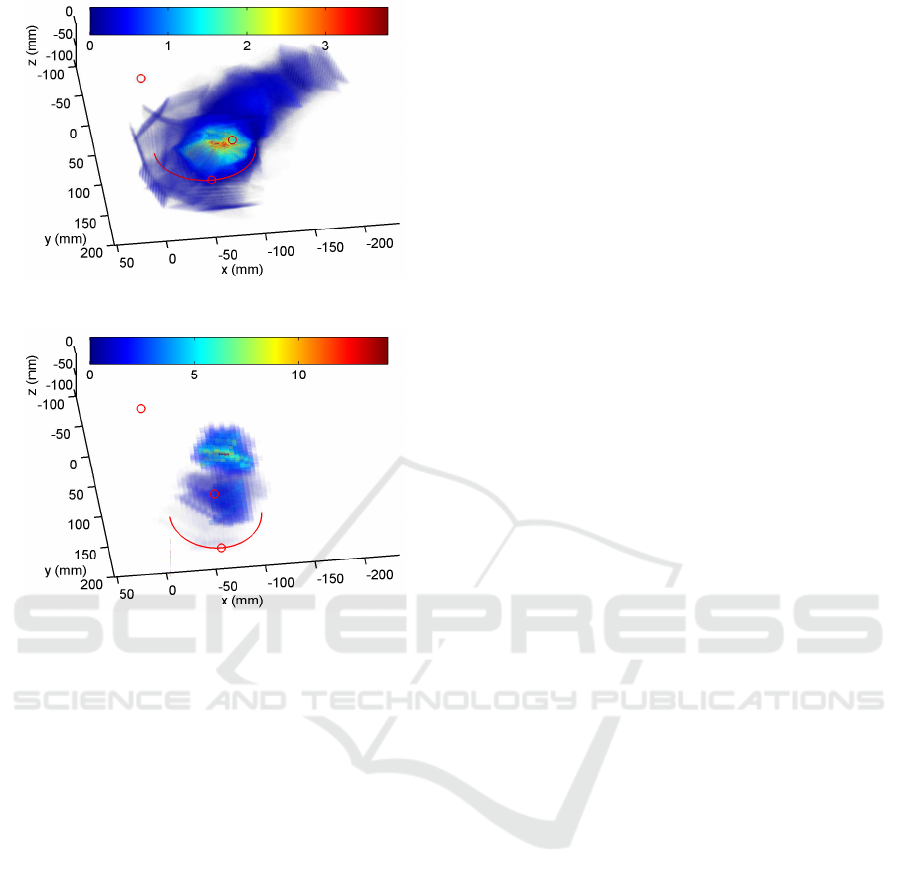
(a) Screening
(b) Diagnosis
Figure 5: Time in seconds (coded in color) spent in breast
and adjacent lymph nodes voxels during (a) screening ex-
amination and (b) diagnosis examination. The coordinate
system in millimeters is defined by the reference sensor
(origin denoted by the left-top circle), the breast position
is marked by the semi-circle curve and by the other two cir-
cles that represent the reference points (cf. Fig. 1).
and this is done for all t. The resulting 3D array, de-
noted as S, represents the number of images crossing
each voxel. To estimate the time spent in each voxel,
we divide the array by FPS; see examples in Fig. 5.
Evaluation of Physicians
We collect data from different physicians perform-
ing screening examinations with an aim to compare
their performance (and diligence). The reference
points are used to co-register different examinations
from the same physician as well as examinations
of various physicians. The proposed method does
not provide full registration but the results demon-
strated enough accuracy for mutual comparison. The
registered surfaces are divided into angular and cir-
cular sectors c
i
(Fig. 1, red structure) and in each
sector the average time spent
¯
S(i) = |c
i
|
−1
∑
x∈c
i
S(x)
(Fig. 6 - left) and density of coverage D (Fig. 6
- right) is calculated, where |c
i
| is the area of the
i-th circular/angular sector. The density of cover-
age is estimated by calculating the entropy in sec-
tors. If S (x) is the time spent in position x, then
D(i) = −(ln |c
i
|)
−1
∑
x∈c
i
S(x)lnS(x). More homoge-
neous coverage in a sector implies higher density D.
Both
¯
S(i) and D(i) is averaged over all examinations
from each physician and then we compare different
physicians by comparing the averaged values.
3D Reconstruction
Finally, using the tracker system, it is possible to per-
form local 3D reconstruction of the breast image. Un-
like in the visualization of the “time-spent”, it is more
convenient here to work with the original transforma-
tion T
t
. For all t, every image pixel in I
t
is transformed
to discrete R . The pixel values in R are calculated ei-
ther with the nearest-neighbor or linear interpolation.
If collisions occur and more than one pixel transforms
into the same voxel, it is possible to apply a maxi-
mum or a mean rule. Holes, i.e. empty voxels, can
be filled by propagating values from neighboring vox-
els, an analogy to inpainting. The US transducer must
be in contact with skin, which causes unwanted tissue
deformation. Due to tissue elasticity it is unrealistic to
perform 3D reconstruction of the whole breast. How-
ever, we are able to run 3D reconstruction on small ar-
eas covering potential findings. The potential findings
are stored as a list of time instances t
f
’s, for which the
”freeze” button was pressed. We assume that in short
time intervals (couple of seconds) the transducer mo-
tion is continuous and the differences in tissue defor-
mation are negligible. We then select such short time
intervals around each t
f
and consider only images in
these intervals for 3D reconstruction.
3 EVALUATION
Our tracking and visualization setup is currently be-
ing tested in a Prague, CZ-based mammography cen-
ter. We are collecting data from different physicians
performing both diagnostic and screening examina-
tions on patients of various ages. Our goal in the first
stage is to collect enough data for statistical analy-
sis of different screening methodologies. In the next
stage, we plan to deliver a solution (computer-aided
diagnosis), which would inform the physician of re-
gions inadequately examined, store the exact position
of potential findings for future references, and per-
form local 3D reconstruction to improve automatic
or semi-automatic detection and classification of the
findings.
Evaluating Spatial Coverage of Breast Examination with Free-hand Ultrasound Transducer
131
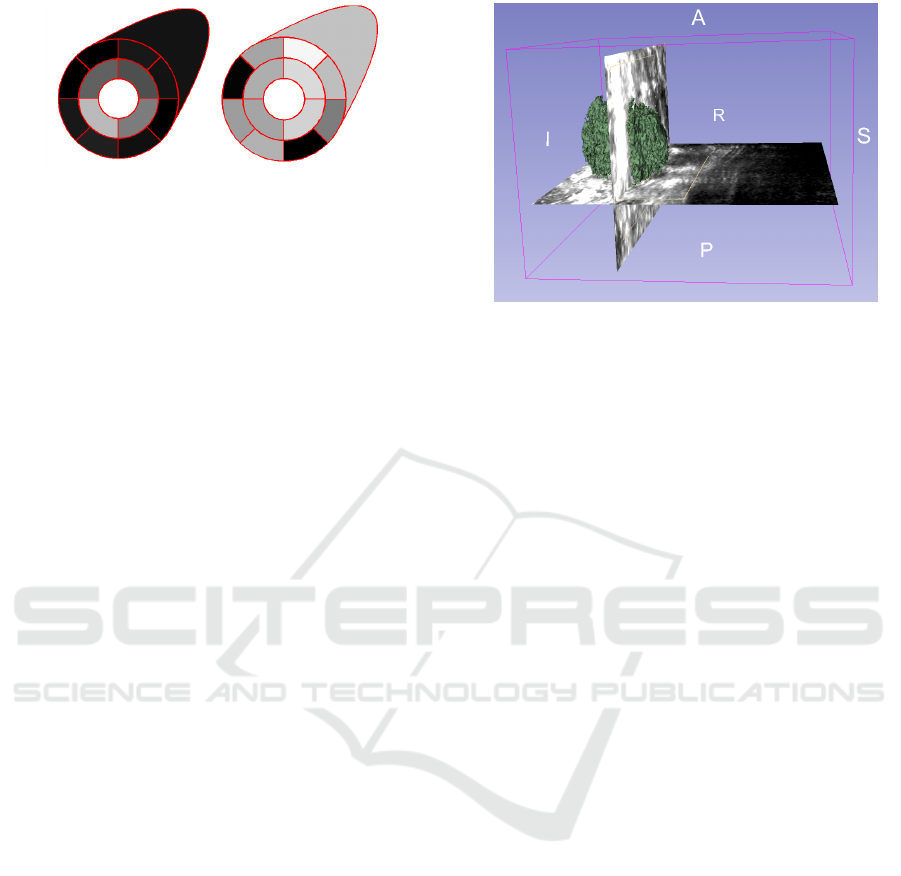
(a) (b)
Figure 6: Evaluation of the screening quality: left - time
spent in sectors - lighter color means longer time; right -
density of coverage in sectors - lighter color means more ho-
mogeneous examination with less holes (neglected regions).
We demonstrate the visualization output of the US
setup on two real examples. The first one is a screen-
ing examination, during which the whole breast and
adjacent lymph nodes should be covered. The sec-
ond one is a diagnostic examination, during which
the physician focuses only on areas with earlier find-
ings. The transducer trajectory for both examinations
has been shown in Fig. 4. The trajectory is rendered
in the reference coordinate system R and the time is
coded in color. In the screening example Fig. 4(a),
the physician started in the axillary lymph nodes and
continued with a systematic examination of the breast
from the areola to its sides. In the diagnostic example
Fig. 4(b), only a small section of the breast is covered.
The differences between both examinations are even
more noticeable in our second type of visualization in
Fig. 5, which shows the time spent in each voxel. The
voxel color denotes the duration in seconds, for which
the corresponding area has been examined. We use
semitransparency of voxels to better visualize the vol-
ume. Note that in the screening example Fig. 4(a) the
most frequently visualized area is the areola, whereas
in the diagnostic example it is the area of the earlier
finding, which in this case is in the upper outer quad-
rant. In addition, we can perform 3D reconstruction
of the area and apply segmentation algorithms to 3D
reconstruction, such as GrowCuts (Zhu et al., 2014),
and visualize present lesions as shown in Fig. 7.
4 CONCLUSION
We have proposed an affordable enhancement of US
devices, which is currently being clinically tested. An
electro-magnetic tracking technology is used to si-
multaneously track the position of a patient and a free-
hand US transducer, which allows us to perform sev-
eral visualization tasks. We can for example display
spatial distribution combined with duration, for which
every location in our 3D space has been examined.
Figure 7: Example of 3D segmentation using GrowCuts.
The advantages of the proposed setup are twofold.
We can perform blind tests and evaluate physicians
during US examinations or we can guide the physi-
cians to regions insufficiently examined and show 3D
reconstruction of lesions.
Possible alternative to using the electro-magnetic
tracker would be to use an optical tracking system,
such as the Microsoft Kinect. In our opinion, how-
ever, the E-M tracker provides more robust opera-
tion with more accurate data, and, with fewer require-
ments on positioning, direct visibility, etc., it imposes
less stress both on the expert performing the examina-
tion, and on patient. Furthermore, using some video
tracking system, additional ethical issues could possi-
bly arise.
Future work includes an evaluation study of exam-
ination procedures over a larger number of specialists
and patients.
ACKNOWLEDGMENTS
This work has been supported by the Technol-
ogy Agency of the Czech Republic (TACR) Project
TA04011392.
REFERENCES
Andrei, S. S., Gao, J., Chiu, J., Turian, J., and Caluser, C.
(2014). Performance evaluation of an automated free-
hand breast ultrasound system for the completeness of
scanning assessment. European Congress of Radiol-
ogy, C-1382.
Boyd, N. F., Guo, H., Martin, L. J., Sun, L., Stone, J.,
Fishell, E., Jong, R. A., Hislop, G., Chiarelli, A.,
Minkin, S., and Yaffe, M. J. (2007). Mammographic
density and the risk and detection of breast cancer.
New England Journal of Medicine, 356(3):227–236.
BIOIMAGING 2017 - 4th International Conference on Bioimaging
132

Coup
´
e, P., Hellier, P., Azzabou, N., and Barillot, C. (2005).
3D freehand ultrasound reconstruction based on probe
trajectory. Medical image computing and computer-
assisted intervention: MICCAI International Confer-
ence on Medical Image Computing and Computer-
Assisted Intervention, 8(Pt 1):597–604.
Dyer, E., Ijaz, U. Z., Housden, R., Prager, R., Gee, A.,
and Treece, G. (2014). A clinical system for three-
dimensional extended-field-of-view ultrasound. The
British journal of radiology.
Gee, A., Prager, R., Treece, G., and Berman, L. (2003).
Engineering a freehand 3d ultrasound system. Pattern
Recognition Letters, 24(4–5):757 – 777.
Huang, W. and Zheng, Y. (2008). MMSE reconstruction for
3D freehand ultrasound imaging. International Jour-
nal of Biomedical Imaging, 2008(1):1–9.
Huang, W., Zheng, Y., and Molloy, J. a. (2005). 3D ul-
trasound image reconstruction from non-uniform res-
olution freehand slices. ICASSP, IEEE International
Conference on Acoustics, Speech and Signal Process-
ing - Proceedings, II:125–128.
Lasso, A., Heffter, T., Rankin, A., Pinter, C., Ungi, T., and
Fichtinger, G. (2014). Plus: Open-source toolkit for
ultrasound-guided intervention systems. IEEE Trans-
actions on Biomedical Engineering, (10):2527–2537.
Shin, H. J., Kim, H. H., and Cha, J. H. (2015). Current sta-
tus of automated breast ultrasonography. Ultrasonog-
raphy, 34(3):165–172.
Yu, H., Pattichis, M. S., Agurto, C., and Goens, M. B.
(2011). A 3d freehand ultrasound system for multi-
view reconstructions from sparse 2d scanning planes.
Biomedical engineering online, 10(1):7.
Zhu, L., Kolesov, I., Gao, Y., Kikinis, R., and Tannenbaum,
A. (2014). An effective interactive medical image seg-
mentation method using fast GrowCut. In MICCAI
Workshop on Interactive Medical Image Computing.
Evaluating Spatial Coverage of Breast Examination with Free-hand Ultrasound Transducer
133
