
Cluster-based Edge Bundling based on a Line Graph
Takafumi Yamashita and Ryosuke Saga
Graduate School of Engineering, Department of Computer Science and Intelligent Systems, Osaka Prefecture University,
1-1 Gakuen-cho, Naka-ku, Sakai, Osaka, Japan
Keywords: Information Visualization, Edge Bundling, Edge Clustering, Line Graph.
Abstract: Information visualization enables simple and intuitive understanding of data. Edge bundling is a visualization
technique and is beneficial for visual analysis. By transforming data into a network diagram, the relationships
among data can be recognized intuitively. In such situation, edge bundling reduces the visual clutter by
bundling the edges on the basis of several approaches. Results show the bundles of edges are organized in a
few relationships. In other words, the bundles can be regarded as clusters of edges. Therefore, we propose a
new bundling method based on edge clustering. By changing a network into a line graph, edges can be
regarded as nodes such that several node clustering methods can be applied to edge clustering. We bundle
edges on the basis of the result of edge clustering. This approach is a novel concept of edge bundling and edge
clustering. Using the proposed method, most edges are clearly bundled whereas a few edges belonging to
different clusters are not bundled.
1 INTRODUCTION
Network diagram is a common technique of
information visualization (Gansner et al., 1993). This
approach can simply represent the relationships
among data through links between nodes such that
observers can recognize these features intuitively.
Network diagram is increasingly being investigated
because of the growth of social networks, such as
Twitter and Facebook. Network diagram can be
applied to social networks and enables observers to
find features by network analysis, such as community
detection (Newman et al., 2004). However, when the
number of nodes and links is large, the visibility of
the graph decreases because of the visual clutter
caused by the complicated structure of the graph. This
issue must be resolved.
To reduce the visual clutter, graph layout
approaches have been proposed (Mueller et al., 2006;
Kamada et al., 1989; Fruchterman et al., 1991;
Michael et al., 2004; Archambault et al., 2007). This
approach rearranges nodes correctly such that the
visibility of the graph increases to a certain degree.
However, this approach cannot solve the problem
when the graph contains many edges.
To address this issue, a new approach called edge
bundling has been proposed (Holten, 2006; Zhou et
al., 2008; Telea et al., 2010). This method enables
observers to easily find the relationships among data
through the mainstream of the edge bundles. The
methods mentioned above are based on several rules,
such as hierarchical structure of nodes, parallel
coordinates, and mechanical models. The model-
based bundling methods presented in previous works
have improved the visibility of the graph based on
each concept.
Bundles are several convergences of edges and
can be classified as clusters of edges. A similar
concept has been proposed (Cui et al., 2008; Telea et
al., 2010); however, this approach only focuses on
geometry-based edge cluster and only bundles edges
to find edge clusters. In other words, this approach
regarded merged edges as a cluster. In the big data era,
data do not always present location information. The
edges must also be classified using other information.
In this paper, we propose a novel concept of edge
bundling. This method is called cluster-based edge
bundling (CBEB). CBEB bundles the edges based on
the cluster information of edges. To detect the clusters
of edges, we replace the problem with community
detection using line graph. Edges can be regarded as
nodes on the line graph such that the community
detection method can be adapted to the edge cluster
detection.
Yamashita T. and Saga R.
Cluster-based Edge Bundling based on a Line Graph.
DOI: 10.5220/0006236003110316
In Proceedings of the 12th International Joint Conference on Computer Vision, Imaging and Computer Graphics Theory and Applications (VISIGRAPP 2017), pages 311-316
ISBN: 978-989-758-228-8
Copyright
c
2017 by SCITEPRESS – Science and Technology Publications, Lda. All rights reserved
311
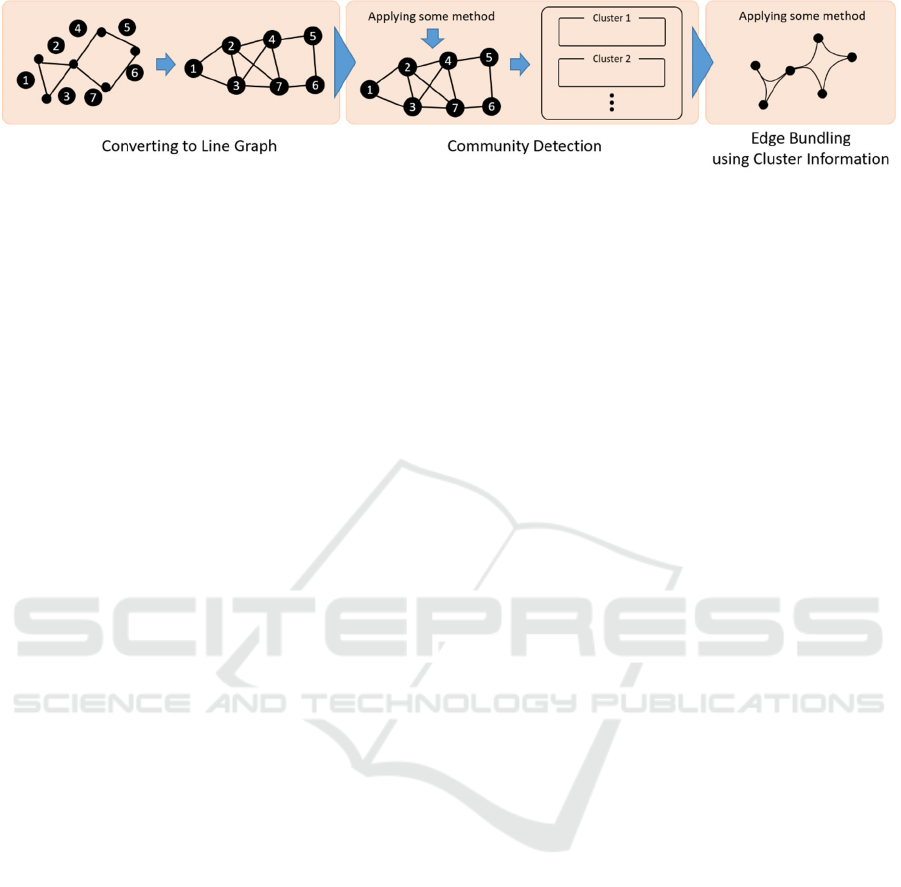
Figure 1: Framework of our CBEB.
The contributions of the study are as follows:
1. A novel concept of edge bundling is
proposed, which can find topological edge
cluster.
2. Edge cluster detection is replaced with
conventional community detection using
line graph.
3. The proposed concept is suitable to other
bundling algorithms or community detection
algorithms.
2 RELATED WORKS
Holten et al. (2009) proposed the force-directed edge
bundling (FDEB) method. FDEB has been applied to
undirected- and single-edge-type graphs. In this
method, the edges are considered a spring with
several control points and are bundled by the spring
force based on Hooke’s law and the electrostatic force
as the attractive force among the points. The bundling
methods can be used to reduce the computational
complexity from O(E
2
C
2
) to O(E
2
C), where E is the
number of edges and C is the number of control
points.
However, when the forces are excessively strong,
the edges are also excessively bundled and the node–
link diagrams present incorrect relationships. To
solve this problem, Holten et al. (2009) introduced a
compatibility measure that works for the force among
the incorrect pairs of edges in consideration of length,
position, angle, or projection overlap (called
visibility); they then filtered the incorrect pairs by a
threshold. Of course this method ignores edge
clusters.
Telea et al. (2010) proposed another concept of
edge bundling, which is called the image-based edge
bundling method. This method helps observers
recognize the coarse-level bundle by emphasizing
such bundles. This approach allows any layouts of
bundles. Given the layout of input graph, this method
classifies edges into some clusters. After clustering,
for each cluster, a compact shape is computed. Based
on each shape and its skeleton, a cushion-like shading
profile is constructed. Finally the graph is drawn by
these process.
Ersoy et al. (2011) proposed the skeleton-based
edge bundling, which is expansion of the image-
based edge bundling. Image-based method utilizes
skeletons, or centerlines of shapes, only to shade
bundles. In this improved method, edges are
iteratively attracted towards its skeleton of the shape
using a feature transform.
These two method adopts edge clustering. Each
edge has a feature vector, which comprises sampling
points of the edge and edge type. All edges are
clustered by the clustering framework for gene data
using these feature vectors. Telea et al. (2010) stated
that the mixing positions and types in one distance
metric can lead to undesirable results even when
feature vectors can include multiple dimensional
types.
Apart from these methods, other concepts of edge
bundling are also available (Lambert et al., 2010;
Zielasko et al., 2016; Bourqui et al., 2016). A few of
them also treat edge cluster or multilayer graph;
however, a method that focuses on topological edge
cluster is unavailable. We assume that the result of
bundling already shows geographical clusters
because edges are attracted based on geographical
information. Therefore, what we have to extract
before bundling is topological clusters of edges.
Certainly, geographical cluster can clearly visualize
data, but from the viewpoint of data-oriented
visualization, detecting topological edge clusters is
more effective.
3 CLUSTER-BASED EDGE
BUNDLING (CBEB)
3.1 Overview
The overall procedure of our CBEB is shown in
Figure 1. First, we convert an input graph into a line
graph. Edges are then converted into nodes and are
linked if a pair of original edges shares the endpoint
with them. After converting the graph, we apply a
IVAPP 2017 - International Conference on Information Visualization Theory and Applications
312
community detection method to the line graph. The
detected communities on the line graph are the
clusters of edges in the original graph. Finally, the
edge bundling method is applied to the original graph.
Using cluster information, the algorithm for bundling
edges can be weighted. Edges belonging to the same
cluster are tightly bundled, and edges belonging to
different clusters are loosely bundled or repelled.
3.2 Line Graph
Line graph is another form of a given graph and is a
simple concept (Harary, 1969).
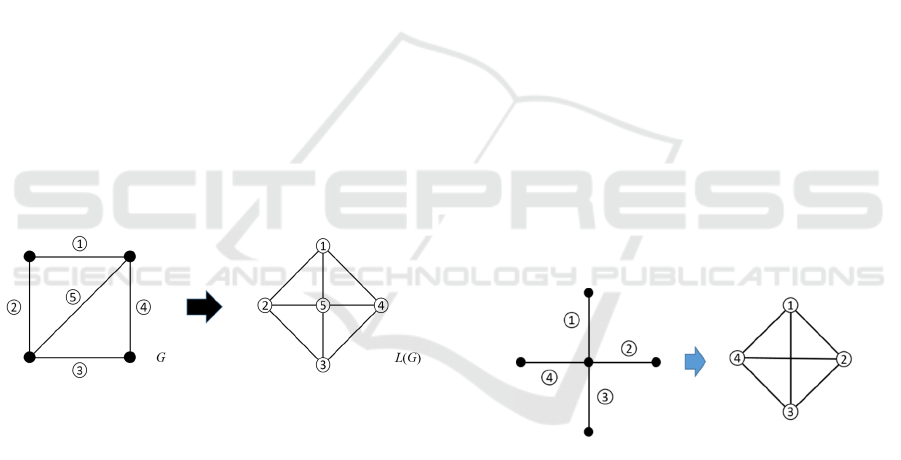
We consider a line graph L(G) of a given graph G.
In L(G), each vertex represents an edge of the original
graph G. If two edges in G share a vertex, then the
corresponding vertices in L(G) are adjacent. An
example of a line graph is shown in Figure 2.
In L(G), the original edges are regarded as nodes
to solve a problem. Node clustering on line graph is
equivalent to edge clustering on an original graph
according to the definition of line graph. That is, we
attach importance to not geographical but topological
relationships. In addition, we assume that edges that
are not connected through any path or are connected
through many edges do not belong to the same cluster.
In this situation, node clustering method is useful
mentioned next.
Figure 2: Example of a line graph.
3.3 Modularity-based Clustering on
Line Graph
Node clustering on line graph is beneficial for edge
cluster detection. Several node clustering methods are
available, such as clique percolation method (Palla et
al., 2005). Among these techniques, we use the
modularity-based clustering method in consideration
of runtime.
Newman and Girvan (2004) proposed modularity,
which is a metric of graph clustering. Generally, a
cluster is “good” when it contains many intra edges
and a few outer edges. Modularity can evaluate
whether the clustering result is good or not according
to this concept. Modularity is presented as follows:
∑
,
(1)
where
is the fraction of edges in the network that
connects vertices in the same community, and
is
the expected value of the same quantity in a network
with the same community divisions but random
connections between the vertices. Based on this
metric, Newman (2004) proposed the agglomerative
community detection method. This method uses ∆,
which is the increment of modularity when two
clusters are combined. ∆ is presented as follows:
∆
2
2
,
(2
)
where
is the number of edges between community
and , and
is the number of edges in community
.
First, all nodes on the line graph are regarded as a
cluster, and the pair of nodes with the highest value
of ∆ are combined. After combining the pair, each
∆ between every pair of nodes are recalculated.
Finally, all communities are detected by repeating
this process until all values of ∆ become negative
numbers.
If the detected clusters on a line graph show
connected original edges, then these clusters contain
edges that share only one of the endpoint of them. An
example of this case is shown in Figure 3. If all edges
in several subgraphs share one node, then the line
graph of the subgraph is a complete graph. A
complete subgraph is treated as a cluster in several
methods such that node clustering on a line graph can
detect edge clusters.
Figure 3: Example of an edge cluster.
3.4 Cluster Compatibility
After clustering on line graph, edges are bundled by
several forces based on a particular model. To bundle
the edges based on cluster information, we now
define an additional compatibility called cluster
compatibility. The cluster compatibility
between
two edges and is defined as follows:
,
,
(3)
where
and is the cluster which and
belong to, and is the number of clusters. If and
belong to the same cluster, then they are bundled
Cluster-based Edge Bundling based on a Line Graph
313
tightly. However, if two edges belong to different
clusters, then the force is weighted low. This
compatibility eases the tight bundling of edges
classified to the same cluster.
If observers aim to significantly tightly bundle
edges or to repel edges using cluster information, the
can adjust the value of
without using . The
suitable value can be obtained empirically because
the visibility depends on the subjective evaluation of
the observer.
3.5 Exchangeability of Algorithms
Our concept is the entire flow of edge clustering and
bundling. The two algorithms for detecting cluster
and bundle edges are not concrete. In other words,
observers can use any algorithms that are suitable to
their data set. If the data present several attributions
on the edges, then observers can detect clusters in
consideration of the attributions. In such a case,
observers can apply a method that can find attributed
clusters to the line graph, such as the SA-cluster
method (Zhou et al., 2009). If the data satisfy the
conditions, then observers can apply multi-type edge
bundling (Yamashita et al., 2015; Saga et al., 2015)
to the original graph. Our method is advantageous in
that observers can choose appropriate algorithms
according to their data.
4 EXPERIMENTS
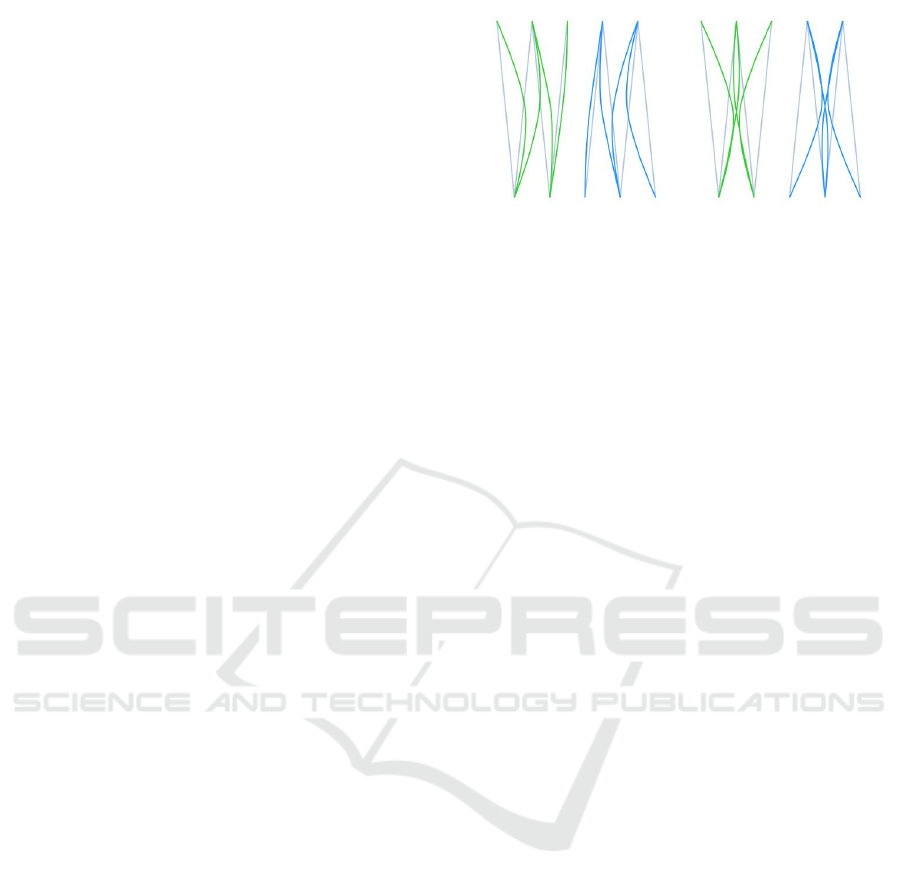
4.1 Simple Case Study
We show the result of the simple case study. We
adopt FDEB (Holten, 2009) and modularity-based
community detection method to implement our
method (Newman, 2004).
We create a sample graph that contains 10 nodes
and 8 edges. The graph can be divided into 2
subgraphs. Each subgraph is composed of 5 nodes
that are connected. No edges exist between the 2
subgraphs.
The result is shown in Figure 4. The light lines
denote the beginnings of edges. The edges classified
to the same cluster are presented in the same color.
By converting the original graph to a line graph, the
clusters of edges are detected on the line graph. Each
edge in each subgraph is classified to the same cluster
on the line graph. As a result, edges belong to the
same cluster are obviously tightly bundled and the
unconnected edges are not bundled.
Figure 4: Bundling for sample graph. Left: Result of FDEB.
Right: Result of our CBEB.
4.2 Application Example for an
Editorial Network
In this study, we choose the 2008 editorial articles
from Yomiuri newspaper as the data set for the graph.
We make co-occurrence graphs of keywords using
the data. The keywords are the top 200 with respect
to TF-IDF score. We use the Jaccard index to measure
the co-occurrence degree, and its threshold is set to be
0.25. We then filter the graph to delete subgraphs that
contain less than 5 nodes. Finally, the graph is
composed of 99 nodes, 259 edges, and 4 clusters of
edges. When drawing the graph, we provide color to
the edges according to their cluster. The edges
classified to the same cluster are presented in the
same color like Figure 4. In addition, we use
FRLayout (Fruchterman et al., 1991), which is a
graph drawing algorithm based on the spring-
embedder model.
Figures 5 and 6 show the results of FDEB and our
CBEB, respectively. FDEB bundles all edges in a few
degrees, but FDEB does not consider cluster
information even when the graph contains edge
clusters.
The results in Figure 6 present a few differences
from those in Figure 5. Specifically, the edges of the
same color are bundled more tightly in Figure 6 than
in Figure 5. Figure 6 also shows that the edges of
different colors are not bundled in several areas
because of cluster compatibility. These edges belong
to different clusters such that the edges do not come
in contact with one another. Therefore, the aim of the
method is achieved.
The results show that edges classified to the same
cluster are located near one another. In other words,
edge clusters are compacted. This finding is due to the
clustering algorithm mentioned above. If another
clustering method is applied or cluster information
such as a tag already exists, then clusters can be
placed sparsely.
IVAPP 2017 - International Conference on Information Visualization Theory and Applications
314
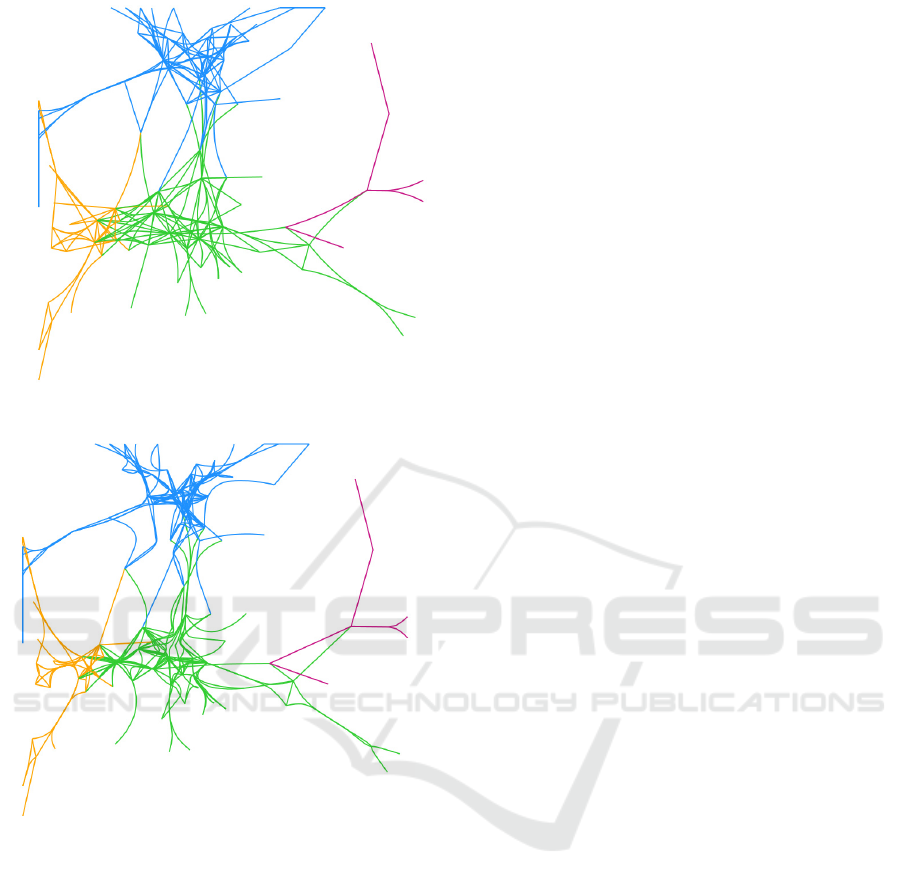
Figure 5: Result of FDEB.
Figure 6: Result of our proposed CBEB.
5 CONCLUSION
In this paper, we propose a novel concept of edge
bundling using edge cluster information. We redefine
edge bundles as edge clusters such that the concept of
line graph can be introduced to the edge cluster
detection. We detect the edge cluster by applying the
node clustering method to the line graph. We then
bundle edges on the basis of the cluster information
using FDEB. Consequently, our approach can reduce
the visual clutter based on our proposed concept.
Future works can focus on the following aspects:
Adjusting Cluster Compatibility. In this paper, we
introduce
to weight the force. However, this
compatibility is not geographical but topological
unlike existing compatibilities. Therefore, the method
for integrating these compatibilities is open to
argument.
Evaluation Index. Saga (2016) proposed the
quantitative evaluation index for edge bundling.
However, this index can only evaluate geographical
information. Although such feature is important, the
method is unsuitable for evaluating our concept. A
metric must be developed to quantitatively evaluate
the result in consideration of the cluster information.
Soft Clustering. An edge with high betweenness
value corresponds to a node with high betweenness
centrality value on a line graph. Soft clustering can
therefore be conducted on a line graph to address this
problem.
ACKNOWLEDGEMENTS
This research was supported by MEXT/JSPS
KAKENHI 25420448 and 16K01250.
REFERENCES
Gansner, E. R., Koutsofios, E. S., North, C., Vo, K. P., 1993.
A technique for drawing directed graphs, In IEEE
Transactions on Software Engineering. 19 (3), 214-230.
Newman, M. E. J., Girvan, M., 2004. Finding and
evaluating community structure in networks. In
Physical Review E. 69 (2), 026113.
Mueller, C., Gregor, D., Lumsdaine, A., 2006. Distributed
force-directed graph layout and visualization. In
Proceedings of the 6th Eurographics Conference on
Parallel Graphics and Visualization. 6, 83-90.
Kamada, T., Kawai, S., 1989. An algorithm for drawing
general undirected graphs. In Information Processing
Letters. 32 (1), 7-15.
Fruchterman, T. M. J., Reingold, E. M., 1991. Graph
drawing by force-directed placement. In Software:
Practice and Experience. 21 (11), 1129-1164.
Michael, B., Ulrik, B., 2004. Crossing reduction in circular
layouts. In Graph-Theoretic Concepts in Computer
Science. 3353, 332-343.
Archambault, D., Munzner, T., Auber, D., 2007.
Topolayout: multilevel graph layout by topological
features. In IEEE Transactions on Visualization and
Computer Graphics. 13 (2), 305-317.
Holten, D., 2006. Hierarchical edge bundles: visualization
of adjacency relations in hierarchical data. In IEEE
Transactions on Visualization and Computer Graphics.
12 (5), 741-748.
Zhou, H., Yuan, X., Qu, H., Cui, W., Chen, B., 2008. Visual
clustering in parallel coordinates. In Computer
Graphics Forum. 27 (3), 1047-1054.
Cluster-based Edge Bundling based on a Line Graph
315

Telea, A., Ersoy, O., 2010. Image-based edge bundles:
simplified visualization of large graphs. In
Eurograhpics/IEEE-VGTC Symposium on
Visualization. 29, 843-852.
Cui, W., Zhou, H., Qu, H., Wong, P. C., Li, X., 2008.
Geometry-based edge clustering for graph visualization.
In IEEE Transactions on Visualization and Computer
Graphics. 14 (6), 1277-1284.
Holten, D., Wijk, J. J. Van., 2009. Force-directed edge
bundling for graph visualization. In Computer Graphics
Forum. 28 (3), 983-990.
Ersoy, O., Hurter, C., Paulovich, F. V., Cantareira, G.,
Telea, A., 2011. Skeleton-based edge bundling for
graph visualization. In IEEE Transactions on
Visualization and Computer Graphics. 17 (12), 2364-
2373.
Lambert, A., Bourqui, R., Auber, D., 2010. 3D edge
bundling for geographical data visualization. In
Proceedings of the 2010 14
th
International Conference
Information Visualization. 329-335.
Zielasko, D., Weyers, B., Hentschel, B., Kuhlen, T. W.,
2016. Interactive 3D force-directed edge bundling. In
Computer Graphics Forum. 35 (3), 51-60.
Bourqui, R., Ienco, D., Sallaberry, A., Poncelet, P., 2016.
Multilayer graph edge bundling. In Proceedings of the
9
th
IEEE Pacific Visualization Symposium. 184-188.
Harary, F., 1969. Graph theory, Addison-Wesley.
Massachusetts.
Palla, G., Derényi, I., Farkas, I., Vicsek, T., 2005.
Uncovering the overlapping community structure of
complex networks in nature and society. In Nature. 435,
814-818.
Newman, M. E. J., 2004. Fast algorithm for detecting
community structure in networks. In Physical Review
E. 69, 066133
Zhou, Y., Cheng, H., Yu, J. X., 2009. Graph clustering
based on structural/attribute similarities. In
Proceedings of the VLDB Endowment. 2 (1), 718-729.
Yamashita, T., Saga, R., 2015. Edge bundling in multi-
attributed graphs. In Proceedings of the 17
th
International Conference on Human-Computer
Interaction. 9172, 138-147.
Saga, R., Yamashita, T., 2015. Multi-type edge bundling in
force-directed layout and evaluation. In Proceedings of
the 19
th
International Conference in Knowledge Based
and Intelligent Information and Engineering Systems.
60, 1763-1771.
Saga, R., 2016. Quantitative evaluation for edge bundling
based on structural aesthetics. In Eurovis 2016. doi:
10.2312/eurp.20161131.
IVAPP 2017 - International Conference on Information Visualization Theory and Applications
316
