
Clinical Risk Groups Analysis for Chronic Hypertensive Patients in
Terms of ICD9-CM Diagnosis Codes
Javier Fern
´
andez-S
´
anchez
1
, Cristina Soguero-Ruiz
1
, Pablo de Miguel-Bohoyo
2
,
Francisco Javier Rivas-Flores
2
,
´
Angel G
´
omez-Delgado
3
, Francisco Javier Guti
´
errez-Exp
´
osito
1
and Inmaculada Mora-Jim
´
enez
1
1
Dept. of Signal Theory and Communications, Telematics and Computing, Universidad Rey Juan Carlos, Madrid, Spain
2
University Hospital of Fuenlabrada, Fuenlabrada, Madrid, Spain
3
University Hospital of Sureste, Arganda del Rey, Madrid, Spain
Keywords:
Hypertension, Chronic Condition, Health Status, Clinical Risk Groups, ICD9-CM Diagnosis Codes.
Abstract:
Hypertension is a chronic condition that has a considerable prevalence in the elderly. Furthermore, hyperten-
sive patients double cost of normotensive individuals. The budget reduction and the increasing concern about
the sustainability of the healthcare system have caused that improving the efficiency and use of resources
are a priority in developed countries. Identification of chronic hypertensive patients, i.e., patients with high
blood pressure, can be performed by means of population classification systems such as Clinical Risk Groups
(CRGs). CRGs classify individuals in health status categories taking both demographic and clinical infor-
mation of the encounters that individuals have with the healthcare system during a defined period of time.
In this work, we determine the characteristic profile and the evolution of diagnosis codes according to the
International Classification of Diseases 9
th
revision, Clinical Modification (ICD9-CM), focusing on healthy
and chronic hypertensive patients at different chronic statuses (CRG). Our data correspond to the population
associated to the University Hospital of Fuenlabrada (Madrid, Spain) during the year 2012, providing about
46000/16000 healthy/hypertensive individuals. We found that profiles associated to different health statuses
have different patterns in terms of ICD-9 diagnosis codes. Furthermore, a prediction method is proposed to
determine the health status of a new patient according to demographic (age and gender) and clinical (diagnosis
codes) data. We conclude that gender is the less informative characteristic, though the combination of age and
diagnosis codes have a great potential when they are non linearly combined.
1 INTRODUCTION
The recent financial crisis has caused an important
concern among the population, both from an econom-
ical and clinical point of view. The budget reduction
in many social areas and the increasing concern about
the sustainability of the healthcare system have been
the reasons for improving the efficiency and use of
resources. In this sense, the health status evolution of
chronic patients is vital for the appropriate allocation
of available resources, and therefore for the sustain-
ability of the health system.
According to (MHSSE, 2011), in Spain life ex-
pectancy increased from about 73 years in 1979 to 81
years in 2008. Since aging leads people to suffer from
chronic conditions (Anderson and Horvath, 2004), it
takes up an important role about public health spend-
ing. In fact, more than 80% of the expenditure of the
healthcare system is related to chronic diseases, and
it is estimated that 75% of the population will suf-
fer from a chronic condition anytime in their lives.
One of the chronic conditions with more prevalence
is arterial hypertension (i.e., blood pressure greater
than 140/90 mmHg), representing 18% of population
who suffer from chronic diseases according to the
Spanish National Statistical Office. More precisely,
nearly 62% of the population aged 65 and older have
at least one chronic condition, and there is a 25%
of general population with prevalence of high blood
pressure (HBP) (Soni and Mitchell, 2016). From a
clinical viewpoint, the importance of controlling ar-
terial hypertension is high, since HBP can be asso-
ciated to the onset of other chronic clinical condi-
tions such as chronic kidney disease. It is also known
Fernández-Sánchez, J., Soguero-Ruiz, C., Miguel-Bohoyo, P., Rivas-Flores, F., Gómez-Delgado, Á., Gutiérrez-Expósito, F. and Mora-Jiménez, I.
Clinical Risk Groups Analysis for Chronic Hypertensive Patients in Terms of ICD9-CM Diagnosis Codes.
DOI: 10.5220/0006218700130022
In Proceedings of the 4th International Conference on Physiological Computing Systems (PhyCS 2017), pages 13-22
ISBN: 978-989-758-268-4
Copyright © 2017 by SCITEPRESS – Science and Technology Publications, Lda. All rights reserved
13

that HBP is also related to diabetes, and their com-
bination is known to have dreadful outcomes (Man-
cia et al., 2007). From an economical point of view,
the average annual expense per hypertensive patient is
about $776, with high costs in dispensation of medi-
cal drugs (Soni and Mitchell, 2016).
Nowadays, developed countries use Patient Clas-
sification Systems (PCSs) as a basic tool for cost man-
agement (Davis and LaCour, 2016), (Marazzi et al.,
2007). PCSs that take into account all patient encoun-
ters with the health system during a period of time are
named Population Classification Systems, and they
are very useful to provide information about the pop-
ulation morbidity. Population groupers identify pa-
tients or groups of patients at high resource consump-
tion, and can be used as a mean to allocate the nec-
essary resources in health centers. There are several
population groupers, among them: Adjusted Clini-
cal Groups, mainly used for reimbursement in pri-
mary care, Diagnosis Cost Groups, and Clinical Risk
Groups (CRGs).
After analyzing different groupers, the University
Hospital of Fuenlabrada (Madrid, Spain) chose CRGs
as the most suitable system for patient classification
(Hughes et al., 2004), (Berlinguet et al., 2005). Since
CRGs are also the most extensively used grouper, we
will consider it for research purposes. CRGs clas-
sify individuals in mutually excluding categories (risk
groups) taking demographic characteristics and clini-
cal data during a defined period of time (usually, one
year). Clinical data can be provided by services of pri-
mary care, specialized care, mental health and phar-
macy dispensation. Since different codification sys-
tems of diagnosis can be available according to the
service, a previous stage of code standardization has
to be performed by a clinical coding expert. The In-
ternational Classification of Diseases - 9
th
revision-
Clinical Modification (ICD9-CM) - has been consid-
ered in this work for diagnosis coding in primary and
specialized care.
The aim of this work is twofold. On the one hand,
to provide an explanatory analysis of both demo-
graphic data and ICD9-CM diagnosis codes related
to healthy and chronic hypertensive patients. On the
other hand, to apply statistical learning tools to pre-
dict the health status of a patient. In the long term, the
goal is to analyze clinical registers for a long enough
period to find patterns identifying potential patients
related to chronic conditions highly prevalent in the
population. The creation of predictive models could
help to improve the health status and quality of life, as
well as to reduce the socioeconomic impact of chronic
conditions. In this sense, the work presented here can
be considered as one of the first stages, since just one
year has been considered.
The rest of the paper is organized as follows. Sec-
tion 2 describes the HBP condition and its importance
from a clinical point of view. The PCSs are presented
in Section 3, and the database in Section 4. Section 5
presents a descriptive population analysis of ICD9-
MC Diagnosis Codes and their evolution for differ-
ent health status. A predictive analysis considering
ICD9-MC codes and demographic data is provided in
Section 6. Finally, conclusions are presented in Sec-
tion 7.
2 WHY CONSIDERING HBP?
Blood pressure is a measurement which forces your
blood against the blood vessel walls. If this force
is higher than certain value (high blood pressure), it
can produce serious damages in blood vessels over
the time. It also can increase the risk of having heart
attacks, strokes and others (Mancia et al., 2007).
HBP means high blood pressure. A person is con-
sidered to be at risk for high blood pressure when the
systolic blood pressure is 140 mm Hg or greater most
of the time, and when diastolic blood pressure is 90 or
greater mm Hg most of the time, i.e., 140/90 mm Hg.
This condition is considered as persistent in its ef-
fects with time, i.e., chronic. Despite this fact, HBP
can be controlled under blood pressure rates below
140/90 mm Hg (NLM, 2016). HBP can also lead to
get other disorders and therefore to other comorbidi-
ties. Because of this fact, it is interesting to analyze
the differences between healthy people and those who
suffer from HBP.
According to (NHLBI, 2016a), patients can be
hypertensive without knowing that they actually suf-
fer HPB, so they are at risk of developing compli-
cations because of this condition. This is the rea-
son why HBP is called the “silent killer”. Patients
do not notice any symptoms caused by HBP, rarely
they have headache. However, this condition leads to
some health problems: stretching of the blood ves-
sels would cause tears and scars that makes places for
cholesterol or blood to build up. It also would lead
to hemorrhagic strokes or aneurysms since stretch-
ing vessels can have spots which are very fragile and
would tend to break (AHA, 2016).
Though anyone could suffer from HBP, there are
some factors which can increase the probability of
having such condition (NHLBI, 2016b): gender, age,
ethnicity, overweight, and lifestyle habits, among oth-
ers. Regarding gender (Banegas, 2005), women who
are older than 55 are more likely to develop HBP than
men, though men younger than 55 have more risk to
PhyCS 2017 - 4th International Conference on Physiological Computing Systems
14

develop HBP. On the other hand, blood pressure in-
creases with age; specifically, nearly 60% of Span-
ish people older than 60 have HBP. Also important is
to remark that HBP can be associated to the onset of
other medical conditions such as chronic kidney dis-
ease, and it is also related to diabetes.
3 PATIENT CLASSIFICATION
SYSTEMS
Developed countries use PCSs for clinical purposes
and also as a basic tool for cost management. PCSs
are built from a set of clinical rules that assign each
patient to one of a limited collection of homoge-
neous groups in terms of resources use and/or health
status. The family based on DRGs (Diagnosis Re-
lated Groups) is the most used to analyze the hospital
case mix, as well as for reimbursement and financ-
ing healthcare processes. DRGs were created in Yale
University at the end of 60’s (Averill et al., 1999) as a
system to classify each healthcare episode at a hospi-
tal, creating groups with clinical coherence and sim-
ilar use of hospital resources (Averill et al., 1999).
Note that every episode of the same patient can be
assigned to a different DRG according to the type of
inpatient medical assistance. Each DRG is a group
with an associated weight reflecting the consumption
of resources respect to an average DRG considered as
a comparison unit. Some countries use this weight,
along with other metrics (hospital stay, and others), to
compare hospital activity and funding them.
One limitation of DRGs is that they only consider
the hospital environment, but in the healthcare system
there is much more activity (primary care, specialized
care, mental health, pharmacy). PCSs that consider
different fields and take into account all the patient en-
counters with the health system are named Population
Classification Systems or population groupers. As
previously indicated in Section 1, population groupers
usually consider age, gender, diagnoses and proce-
dures practiced during a certain period of time (Davis
and LaCour, 2016). Over the last years, pharmacy
dispensation has also been incorporated to the clini-
cal rules of some population groupers to have a more
complete knowledge about the health status.
Note that, since DRGs are based on individual
healthcare episodes, they do not take into account the
information of the same patient during a period of
time. Since chronic conditions tend to be reflected in
certain diagnosis and pharmacy dispensation, DRGs
are not the most appropriate system to identify pa-
tients with chronic conditions. A classification sys-
tem considers all encounters with the health system
is necessary to identify patients with chronic condi-
tions. Population groupers named CRGs (developed
by 3M
TM
) take into account data about the same pa-
tient for a period of time (usually one year (Newhouse
et al., 1997)) and assign the patient to a single mutu-
ally exclusive risk group which relates the clinical and
demographic characteristics of every individual. This
way, CRGs are suitable for identifying patients with
different chronic conditions and severity levels. This
will allow to relate an individual to the amount and
type of healthcare resources that the patient will need
in the future (Averill et al., 1999).
By way of a summary, the main differences be-
tween DRGs and CRGs are the following: (1) CRGs
categorize individuals whereas DRGs classify inpa-
tient medical assistance; (2) DRGs classify the pa-
tient into an inpatient service episode considering data
registered during the stay, whilst CRGs may consider
hospital environment in addition to primary care, out-
patient care, mental health, and pharmacy (Averill
et al., 1999).
Regarding CRGs, there are 9 core health status
groups, which are subdivided into 272 chronic condi-
tion categories (ccc). The core groups are hierarchi-
cally organized as follows: CRG-9 (catastrophic, 11
ccc), CRG-8 (metastatic malignancy, 22 ccc), CRG-
7 (chronic triplet, 21 ccc), CRG-6 (multiple signif-
icant chronic pair, 61 ccc), CRG-5 (single domi-
nant/moderate chronic, 107 ccc), CRG-4 (multiple
minor chronic pair, 1 ccc), CRG-3 (single minor
chronic, 41 ccc), CRG-2 (significant acute, 6 ccc),
and CRG-1 (healthy user and non-user, so 2 ccc). Ad-
ditionally, every chronic condition category is subdi-
vided into severity levels (up to 6, depending on the
type of condition), providing a total of 1080 groups.
A number of 5 digits is considered to code every of
the 1080 groups. First digit is associated to the core
group, next three digits refer to the ccc, and last digit
is associated to the severity level.Thus, CRG-51913
corresponds to the group of single dominant/moderate
chronic diseases (first digit), and specifically refers to
coronary atherosclerosis (next three digits), with the
third level of severity (last digit).
Patients with chronic condition of HBP can be
classified into 34 different groups (of a total of 1080):
lower CRG number refers to lower chronic condition.
Owing to the limited number of patients associated
to some severity levels, we chose to merge groups of
different severity levels when they are related to the
same chronic condition. From a statistical point of
view, it is important the availability of groups of rea-
sonable size. This way, our analysis will be focused
on the kind of chronic condition, and groups with the
same first four digits are merged to create what we
Clinical Risk Groups Analysis for Chronic Hypertensive Patients in Terms of ICD9-CM Diagnosis Codes
15

have called base-CRGs. Thus, base-CRG 5192 en-
compasses patients with HBP and four severity lev-
els (CRG 51921, CRG 51922, CRG 51923, and CRG
51924).
4 DATABASE DESCRIPTION
The implementation of the Electronic Health Record
(EHR) in the current society has become a power-
ful tool in organizational terms (annotation legibility,
content security, paper files removal, etc) (H
¨
ayrinen
et al., 2008). In this work, data from the EHR of Uni-
versity Hospital of Fuenlabrada along the year 2012
have been analyzed. This hospital assists to several
small towns in the south area of Madrid, encompass-
ing about 225.000 inhabitants. Specifically, we con-
sider clinical encounters and demographic data (age
and gender) from individuals categorized by the CRG
system as healthy and hypertensive ones by using
gender, age, clinical diagnoses, procedures and phar-
macy dispensation.
Hypertensive patients are associated to one out of
six different base-CRG, coded by four numbers: base-
CRG 5192 (hypertension), base-CRG 6124 (chronic
obstructive pulmonary disease and hypertension),
base-CRG 6144 (diabetes and hypertension), base-
CRG 6242 (asthma and hypertension), base-CRG
7070 (diabetes, cerebrovascular disease and hyper-
tension), and base-CRG 7071 (diabetes, hypertension
and other dominant chronic disease). Just one base-
CRG related to HBP has been considered per core
group in this work. The chosen base-CRG has been
the one with more individuals: base-CRG 5192, base-
CRG 6144, and base-CRG 7071. Patients classified
in CRG-1 (healthy) have been also considered in our
study, providing a total of 63008 individuals, as de-
tailed in Table 1.
Table 1: Number of individuals in year 2012 per base-CRG.
Healthy status is associated to CRG-1.
base-CRG Individuals in 2012
Healthy 46835
5192 12447
6144 3179
7071 547
TOTAL 63008
Figure 1 shows the age distribution for hyperten-
sive and healthy patients. Note that healthy patients
are younger than hypertensive patients, what is quite
reasonable. Regarding patients with HBP, age of
individuals in the lower base-CRG (no comorbidity)
tend to be younger than individuals with comor-
bidities (base-CRG 6144 and base-CRG 7071).
Figure 1: Age histogram for individuals in CRG-1 (healthy,
upper panel) and the three base-CRGs related to HBP.
Table 2 shows the gender distribution per base-
CRG, both for healthy and hipertensive patients. Gen-
erally speaking, there is a balance between both gen-
ders except for base-CRG 7071, with the highest pro-
portion for women. This fact can be explained by an
increase of chronic conditions as aging, with a higher
life expectancy for women.
Table 2: Gender distribution (in %) for healthy and hyper-
tensive patients according to the corresponding base-CRG.
Men Women
Healthy CRG-1 47.3 52.7
base-CRG 5192 46.9 53.1
base-CRG 6144 54.0 46.0
base-CRG 7071 42.6 57.4
Next, Figure 2 and Figure 3 show the distribution
of patients with an specific number of diagnosis codes
per year and health status. Horizontal axis in both fig-
ures refer to the number of diagnosis codes per pa-
tient: total number of codes (Figure 2) and number
of different codes (Figure 3). Note that healthy indi-
viduals have a lower number of diagnosis codes than
hypertensive patients, what seems quite reasonable.
Additionally, the mode in the number of different di-
agnosis codes per patient increases with the chronic
condition, going from 1 in the healthy group to 6 in
the base-CRG 7071. Note also that the distribution
tends to be heavy-tailed in the right hand side as the
chronic condition worsens. These results are consis-
tent with the comorbidity associated to every base-
CRG.
PhyCS 2017 - 4th International Conference on Physiological Computing Systems
16
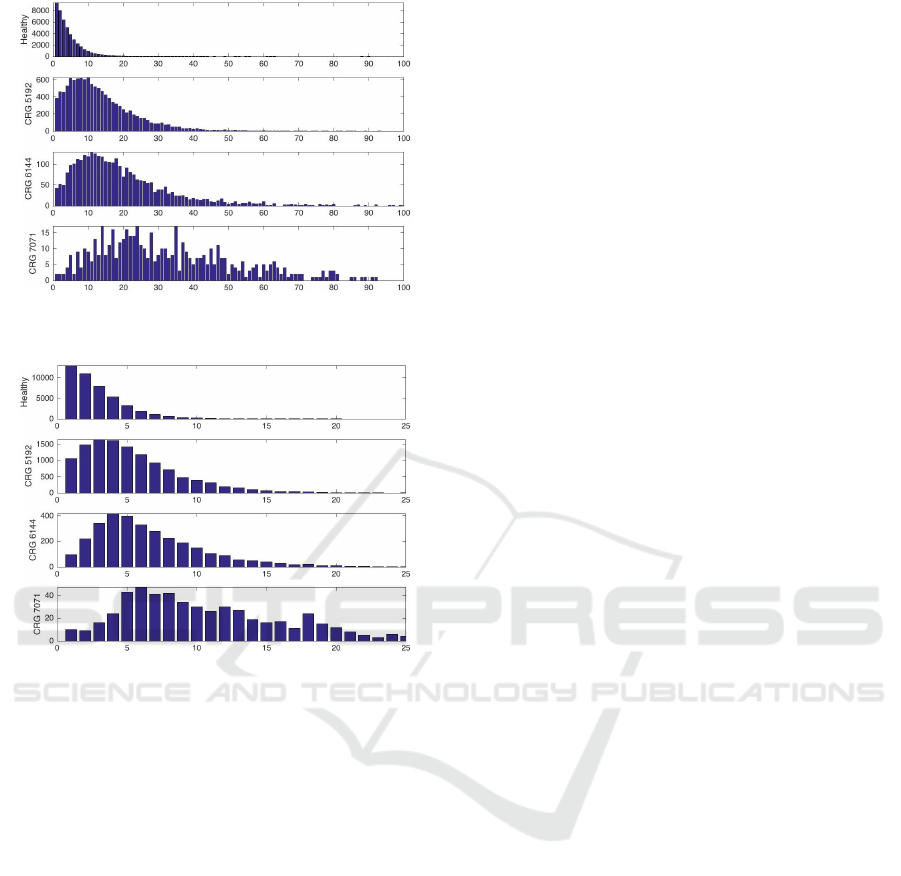
Figure 2: Histogram of the total number of diagnosis codes
per patient and health status.
Figure 3: Histogram of the number of different diagnosis
codes per patient and health status.
5 POPULATION ANALYSIS OF
ICD9-MC DIAGNOSIS CODES
A population analysis to get the average profile of
ICD9-MC codes and the most frequent codes per
base-CRG is first presented in Section 5.1. Then, the
evolution of codes associated to health statuses is an-
alyzed in Section 5.2.
5.1 Average ICD9-CM Diagnosis Code
Profiles
The syntax of ICD9-CM codes is based on categories,
subcategories and sub-classifications of diseases. As
such, the three first digits of the code refer to the cat-
egory. This is followed by a dot and then the sub-
category is represented by the next digit. The second
digit after the dot refers to the sub-classification. For
instance, diagnoses codes (000-999) can be written
as “XXX.XX”, V codes (V01-V89) as “VXX.XX”, E
codes (E800-E999) as “EXXX.X”, M codes (M8000-
M9970), and procedures (00-99) as “XX.XX”, where
X is a digit number between 0 and 9. For simplicity,
from now on we will just consider codes referring to
categories (three digits/values for diagnosis codes).
We define the average profile as a bi-dimensional
graph representing the presence rate of every code for
patients associated to a specific group (base-CRG).
Thus, the average profile is obtained taking into
account the presence/absence of diagnosis codes per
patient in a group. Then, the presence rate per code is
computed, resulting in a number in the interval [0,1].
This number represents the rate of patients having
a specific diagnosis code. We focus on individuals
from CRG-1 (healthy users), base-CRG 5192 (HBP),
base-CRG 6144 (HBP and diabetes) and base-CRG
7071 (HBP, diabetes and other dominant chronic
condition). For each group, we aim to show if there
is a pattern associated to ICD9-MC diagnosis codes.
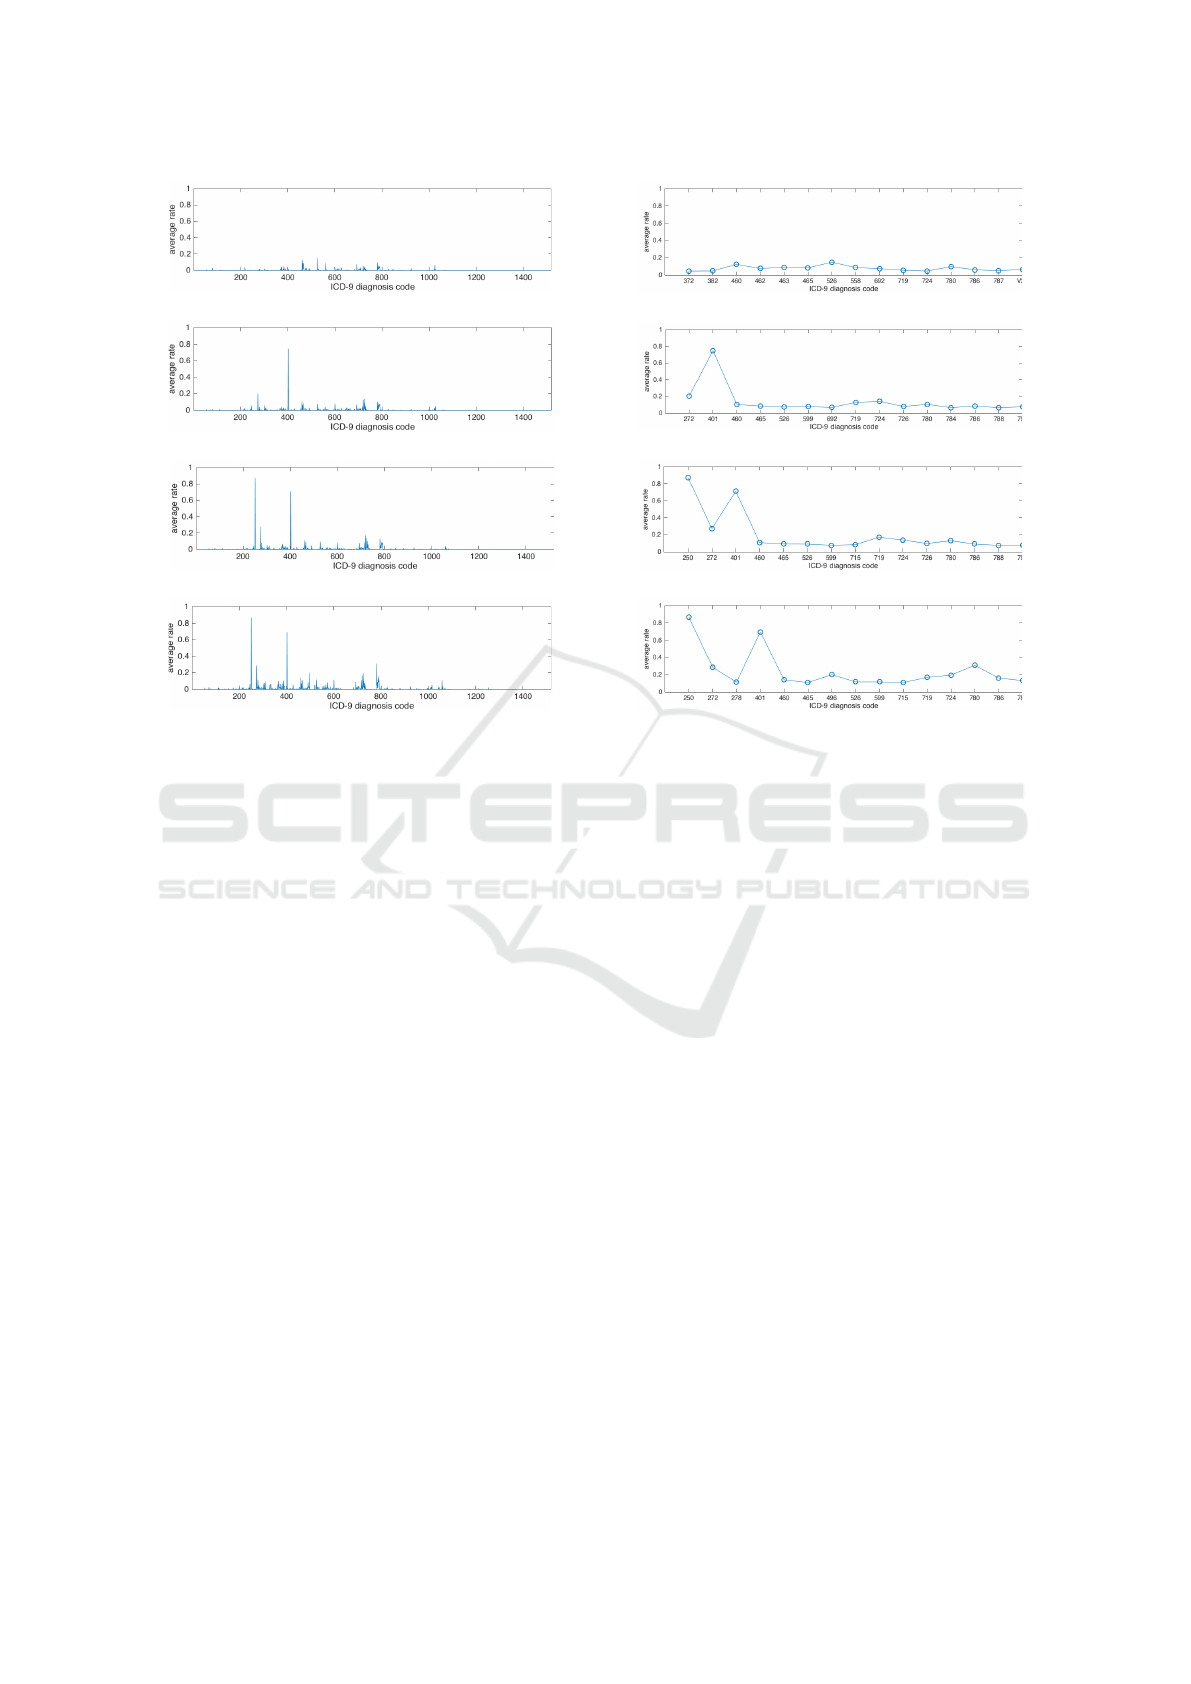
Average Diagnosis Code Profile for the Healthy
Status Group. Figure 4 (a) shows the average diag-
nosis profile of ICD9-MC diagnosis codes for individ-
uals classified as healthy. The horizontal axis repre-
sents the ICD9-MC codes: diseases codes (from 1 to
1000), V codes (from 1001 to 1091), E codes (1092 to
1319) and M codes (1320 to 1517). The vertical axis
represents the rate of patients having a specific diag-
nosis code. For more detail, see Figure 5 (a), where
the 15 diagnosis codes with highest rate are displayed.
According to this figure, there is no prevailing
code, with the highest rate lower than 15% for healthy
patients. The highest rate correspond to jaws issues
(526) at the first place, along with common cold (460)
and general symptoms (780). Other diagnoses with
prevalence are acute tonsillitis (463) and other issues
related with gastroenteritis (558).
These results seem reasonable, since the most
common diagnoses are acute diseases and they can
be considered as normal issues in healthy individuals.
Clinicians validated that these codes are related to
common diseases.
Average Diagnosis Code Profile for base-CRG
5192. Figure 4 (b) presents the presence rate of diag-
nosis codes when considering patients assigned to the
base-CRG 5192. As expected, the most common di-
agnosis is HBP (401), which dominates considerably
above all; followed by excess of low-density lipopro-
tein (LDL) Cholesterol (272) in to a lesser extent. In
fact, HBP and high LDL cholesterol (also known as
“bad” cholesterol) are two of the most common, seri-
ous and treatable medical conditions that lead to car-
diovascular disease (Parks et al., 2006). The average
profile also shows that Back issues (724), joint issues
such as hermarthrosis or synovitis (719) or general
Clinical Risk Groups Analysis for Chronic Hypertensive Patients in Terms of ICD9-CM Diagnosis Codes
17
(a)
(b)
(c)
(d)
Figure 4: Average profile of ICD9-MC diagnosis codes of
individuals classified into: (a) CRG-1 (healthy); (b) base-
CRG 5192; (c) base-CRG 6144, and (d) base-CRG 7071.
symptoms (780) are also relevant. For more informa-
tion, see Fig. 5 (b), where codes associated to 15 high-
est rates are displayed.
Prevalence of the 401 ICD9-MC code (essential
hypertension) for patients assigned to the base-CRG
5192 is a key characteristic on this group. As a
difference from the average profile of CRG-1, the
highest rate is about 80% for hypertensive patients.
Note that the PCS also consider medical drugs to
assign a patient to a CRG, so it is possible that the
remaining 20% of patients are assigned to base-CRG
5192 because they take hypertensive drugs.
Average Diagnosis Code Profile for base-CRG
6144. As we expected, Diabetes mellitus (DM) (250)
and HBP (401) take relevance above other codes in
this CRG (see Figure 4 (c) and Figure 5 (c) for de-
tails), with rates about 80%, which is consistent with
the CRG analyzed. In a lesser extent, the following
rates are related to excess of LDL cholesterol (272),
joint issues (719) and back issues (724). Diagnosis
codes related to common cold (460) and general
symptoms (780) appear in a similar rate to that of
healthy group.
Average Diagnosis Code Profile for base-CRG
7071. As in base-CRG 6144, diagnosis codes related
(a)
(b)
(c)
(d)
Figure 5: Presence rate for the 15 diagnosis codes with
highest rate in: (a) CRG-1 (healthy); (b) base-CRG 5192;
(c) base-CRG 6144, and (d) base-CRG 7071.
to DM (250) and HBP (401) are those with a high-
est rate (see Figure 4 (d)). Note that nearly 80% of
patients in this base-CRG were assigned at least one
of these codes, a similar proportion as in base-CRG
6144. An important difference respect to the profile
of base-CRG 6144 is that codes related to excess of
LDL cholesterol (272), and chronic obstruction of the
airways to the lungs (496) are also predominate (see
Figure 5 (d)). This shows that in this CRG more co-
morbidities are present, being the patient in a worst
chronic condition.
The average profile allows us to validate clini-
cal knowledge, since DM, HBP, and another chronic
dominant condition are the diagnosis codes with most
presence in each patient.
As a summary, Table 3 lists the 5 most proba-
ble diagnosis codes per CRG. Comparing the healthy
status group with other CRGs, we can claim that
healthy patients do not get a high percentage of com-
mon diseases among them, which means that diseases
within the healthy status group have more variabil-
ity. Because of that, the most probable disease has
a prevalence lower than 15% of the healthy individu-
als, which is jaws issues (14.8%). For the other ana-
lyzed CRGs, we can confirm that there is a high prob-
ability to have chronic diseases, being HBP (74.9%
in base-CRG 5192, 71.73% in base-CRG 6144 and
PhyCS 2017 - 4th International Conference on Physiological Computing Systems
18
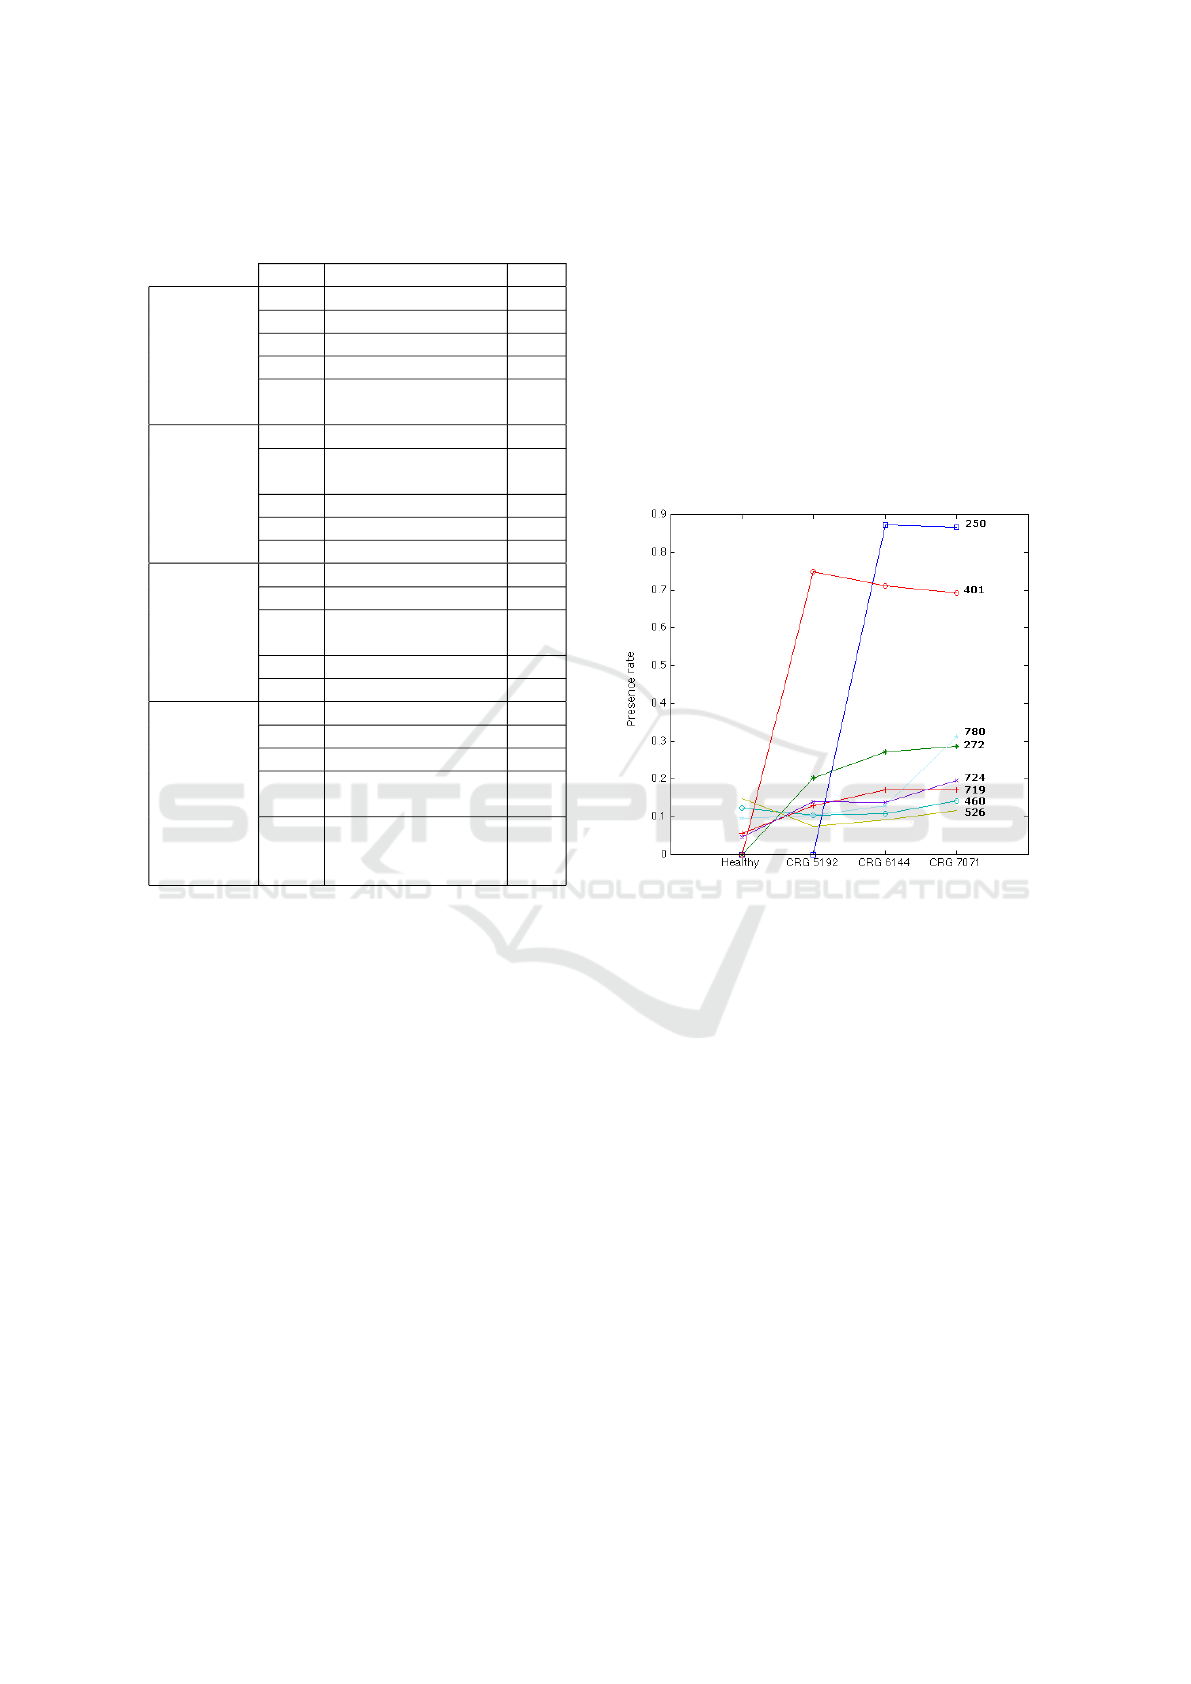
Table 3: More frequent ICD9-MC diagnosis codes ex-
pressed in % in individuals classified into the healthy status
group, CRG 5192, CRG 6144 and CRG 7071.
Code Description %
526 Jaws issues 14.8
460 Common cold 12.3
Healthy 780 General symptoms 6.1
463 Acute tonsillitis 8.8
558
Other issues related
with gastroenteritis
8.6
401 Essential HBP 74.9
272
Excess of LDL
(cholesterol)
20.3
CRG 5192 724 Back issues 14.0
719 Joint issues 12.9
780 General symptoms 10.5
250 DM 87.4
401 Essential HBP 71.3
CRG 6144 272
Excess of LDL
(cholesterol)
27.3
724 Back issues 13.8
719 Joint issues 17.1
250 DM 86.8
401 Essential HBP 69.2
780 General symptoms 31.1
CRG 7071 272
Excess of LDL
(cholesterol)
28.7
496
Chronic obstruction
of the airways
to the lungs
20.1
69.2% in base-CRG 7071) and DM (87.4% in CRG
6144 and 86.8% in CRG 7071) the most probable dis-
eases found within those groups.
5.2 Evolution of ICD9-CM Codes in
Terms of Health Status
Figure 6 shows the evolution of the diagnosis codes
with higher presence rate according to the health sta-
tus (CRG) in 2012. Note that nearly 75% of the hyper-
tensive patients have the diagnosis code 401 (HBP),
while DM is present in more than 85% of patients as-
signed to base-CRG 6144 and base-CRG 7071. It is
clear from Figure 6 how excess of LDL (cholesterol,
diagnosis code 272) increases its prevalence with the
number of the health core status (from groups 5192
to 7071). It is in base-CRG 7071, associated to the
worst chronic condition among those considered here,
where excess of LDL takes the highest presence rate
(about 30%). Code with the highest presence rate in
the group of healthy patients (jaws issues, 526) have
a similar rate in all base-CRGs (presence rate lower
than 15%). General symptoms (780) is also present
in every group, having the highest rate in base-CRG
7071 (about 30%), nearly tripling its presence regard-
ing healthy patients. This fact can be justified by the
fact that patients in the seventh core group have a high
number of comorbidities and so the general symptoms
code is quite frequent when attending to the doctor.
We conclude stating that the evolution of codes over
different CRGs was as expected prior the analyses:
HBP presents a high margin over acute diseases in
base-CRGs 5192, 6144 and 7071, getting a similar
behaviour for DM in the last two CRGs. Besides, we
verify the relationship between healthy patients and
acute diseases, these being present in a low rate.
Figure 6: Evolution of the ICD9-CM diagnosis codes with
the highest presence rate in terms of health status (CRG).
6 HEALTH STATUS PREDICTION
The population analysis of ICD9-MC diagnosis codes
supports that patients classified according to different
health status (CRG) are characterized by a different
diagnosis code profile, as presented in Fig. 5. This
suggests that a predictive model can be built to pre-
dict the base-CRG of a new patient. Towards that end,
we evaluate linear and nonlinear models constructed
by using a Support Vector Machine (SVM). The se-
lection of this method is motivated by its theoretical
properties, which make it an attractive approach for
a great number of medical data problems (Soguero-
Ruiz and et al., 2016a), (Soguero-Ruiz and et al.,
2016b).
Both linear and nonlinear SVM classifiers require
free parameters tuning (Steinwart and Christmann,
2008). The linear ν-SVM algorithm requires the tun-
ing of a single free parameter ν ∈ (0, 1), while the
spread parameter (σ) has to be also adjusted for the
Clinical Risk Groups Analysis for Chronic Hypertensive Patients in Terms of ICD9-CM Diagnosis Codes
19

Figure 7: Average presence rate for the 200 diagnosis codes
with the higher values.
nonlinear SVM when a Gaussian kernel is considered.
We adopted a cross-validation strategy for tuning the
free parameters.
In this work, demographic (gender and age) and
clinical data (ICD9-CM diagnosis codes) have been
considered as input features to classify a patient into
one of the following status groups: CRG-1, base-
CRG 5192, base-CRG 6144 or base-CRG 7071.
Since classes are highly unbalanced (see Table 1),
the data set was constructed using an undersampling
strategy in order to get balanced classes. Towards that
end, a random subset of 547 samples were selected for
each group, achieving a total of 2188 samples when
considering the four groups. Note that the number of
samples per group is limited by the minority group,
i.e. base-CRG 7071. On the balanced data set, 80%
of the samples were randomly chosen for training, be-
ing the remaining 20% for testing. We repeated this
process 50 times and evaluated results in terms of ac-
curacy (mean ± standard deviation).
We have checked that when all features (demo-
graphic and diagnosis codes) were considered as in-
put features in the SVM, the model accuracy was
low. Therefore, results are not presented in this paper.
This low accuracy can be motivated because there are
many diagnosis codes with a very low presence rate
in all groups (see Fig. 4). To tackle this shortcoming,
we averaged the profiles presented in Section 5.1 to
get an average presence rate, regardless the number
of patients per group. Figure 7 shows the average rate
of the 200 diagnosis codes with the highest average
presence rate.
To enhance the prediction results, and according
to Figure 7, the 50 diagnosis codes with higher aver-
age presence rate were evaluated (see Figure 8 for de-
tails). Using these diagnosis codes, a binary classifi-
cation was fitted for: (1) CRG-1 vs. base-CRG 5192;
(2) CRG-1 vs. base-CRG 6144; (3) CRG-1 vs. base-
CRG 7071; (4) base-CRG 5192 vs. base-CRG 6144;
(5) base-CRG 5192 vs. base-CRG 7071; and (6) base-
CRG 6144 vs. base-CRG 7071. In general, the best
performance (mean accuracy of 97%) was achieved
when classifying patients from CRG-1 vs. base-CRG
7071. This is an expected result since healthy pa-
tients are characterized by having different diagnosis
codes with respect to chronic triplet ones (see profiles
in Figure 4). Accuracy decreases significantly when
just comparing patients with chronic conditions. For
example, a mean accuracy value of 76% is obtained
when classifying patients with chronic triplet (base-
CRG 7071) from patients with a chronic pair (base-
CRG 6144).
On the way to predict the health status evolution,
a multiclass SVM was trained, evaluating four classes
(one for each group in Table 1). Table 4 shows the ac-
curacy (mean and standard deviation) when using de-
mographic and clinical data as input features, both in-
dividually and jointly for linear and non linear SVM.
Results suggest that a non linear approach provides
better performance than a linear one. On the other
hand, clinical features provide more knowledge than
demographic data (first and second rows in Table 4).
Note that accuracy is improved when age and clinical
features are jointly analyzed, with gender being the
less informative feature.
7 CONCLUSIONS
Nowadays, HBP plays an important role in a clini-
cal and economic context, with a high incidence and
prevalence among mid-aged and older people (Soni
and Mitchell, 2016). Besides, treatment and control
of this particular disease can be expensive (Soni and
Mitchell, 2016).
This work aims to provide knowledge which can
support clinicians decisions as well as improve the
resources allocation devoted to the specific chronic
condition of HBP. For that purpose, we analyzed the
evolution of ICD9-CM diagnosis codes, focusing on
healthy and hypertensive patients at different chronic
status. Furthermore, we predict the base-CRG for
a new patient. To that end, we analyzed data from
EHRs of UHF. These data refer to ICD9-MC diag-
noses codes, along with demographic variables asso-
ciated to 63.008 individuals in the year 2012.
Firstly, an exploratory analysis of these individu-
als was performed. There is a fair similar number of
individuals of each gender in every CRG. We verify
that women’s life expectancy is higher than that of
men by taking gender distribution of different hyper-
PhyCS 2017 - 4th International Conference on Physiological Computing Systems
20

Figure 8: Average presence rate and ICD9-CM description for the 50 codes with higher values.
Table 4: Accuracy values considering the 50 diagnosis codes with highest presence rates. Both linear and non linear SVM
have been considered for classifying patients into one of four health status (CRG-1, base-CRG 5192, base-CRG 6144 and
base-CRG 7071).
Feature Linear Non linear
Demographic Gender 0.25 ± 0.02 0.26 ± 0.02
Age 0.35 ± 0.10 0.49 ± 0.02
Gender & Age 0.32 ± 0.10 0.50 ± 0.02
Clinical CIE9-CM codes 0.55 ± 0.05 0.75 ± 0.01
Demographic Gender & CIE9-CM 0.55 ± 0.06 0.75 ± 0.01
and Age & CIE9-CM 0.62 ± 0.04 0.76 ± 0.02
Clinical Age & Gender & CIE9-CM 0.63 ± 0.04 0.76 ± 0.02
tensive groups into account. We also check that the
older the patients, the more comorbidities they have
(Figure 1 shows that age increases from base-CRG
5192 until base-CRG 7071).
We also analyzed the number of diagnosis codes
per patient and health status by means of a population
analysis, claiming that individuals belonging to CRG-
1 have much less diagnosis codes per patient than hy-
pertensive ones. According to the average ICD9-CM
diagnosis code profile for CRG-1, the most probable
code has a prevalence rate lower than 15%, whereas
the most probable code in the hypertensive-related
CRGs is around 70-80%. The most relevant codes
in the studied chronic groups are HBP and DM, as
expected prior to perform this work.
Furthermore, a health status prediction method is
proposed to predict the base-CRG of a new patient.
Specifically, linear and non linear SVM classifiers
are trained to evaluate demographic and clinical data
both individually and jointly. The highest accuracy
is obtained when a nonlinear SVM is run in a sub-
set of ICD9-CM codes with age and gender. These
results are promising, since the considered gold stan-
dard (health status group) has been achieved by also
feeding the PCS with medical drug data, not stud-
ied in this paper. As a future work, we will include
also information about medical drugs, which will en-
hance classifier performance and report more knowl-
edge about chronic condition in modern societies.
In conclusion, our analysis has allowed us to de-
scribe and verify the relationship that demographic
and standardized clinical data, collected from patient
encounters with primary and specialized care, have
with the patient health status.
ACKNOWLEDGEMENTS
This work is partially supported by Spanish Research
Project TEC2016-75361-R. Cristina Soguero-Ruiz is
supported by FPU grant AP2012-4225 from Spanish
Government. The authors would like to thank the staff
of Healthcare Iberia 3M for their support and assis-
tance with this project.
REFERENCES
AHA (2016). American health association.
http://www.heart.org [Accessed: 27/05/2016].
Clinical Risk Groups Analysis for Chronic Hypertensive Patients in Terms of ICD9-CM Diagnosis Codes
21

Anderson, G. and Horvath, J. (2004). The growing burden
of chronic disease in america. Public health reports,
119(3):263–270.
Averill, R. F., Goldfield, N., Eisenhandler, J., Hughes, J.,
Shafir, B., Gannon, D., Gregg, L., Bagadia, F., Stein-
beck, B., Ranade, N., et al. (1999). Development and
evaluation of clinical risk groups (crgs). Wallingford,
CT: 3M Health Information Systems.
Banegas, J. B. (2005). Epidemiology of arterial hyper-
tension in spain. present situation and perspectives.
Hipertensi
´
on, 22(9):353–362.
Berlinguet, M., Preyra, C., and Dean, S. (2005). Com-
paring the value of three main diagnostic-based risk-
adjustment systems (dbras). Technical report, Cana-
dian Health Services Research.
Davis, N. A. and LaCour, M. (2016). Foundations of Health
Information Management. Elsevier Health Sciences.
H
¨
ayrinen, K., Saranto, K., and Nyk
¨
anen, P. (2008). Def-
inition, structure, content, use and impacts of elec-
tronic health records: a review of the research liter-
ature. International journal of medical informatics,
77(5):291–304.
Hughes, J. S., Averill, R. F., Eisenhandler, J., Goldfield,
N. I., Muldoon, J., Neff, J. M., and Gay, J. C. (2004).
Clinical risk groups (crgs): a classification system
for risk-adjusted capitation-based payment and health
care management. Medical care, 42(1):81–90.
Mancia, G., De Backer, G., Dominiczak, A., Cifkova, R.,
Fagard, R., Germano, G., Grassi, G., Heagerty, A. M.,
Kjeldsen, S. E., Laurent, S., et al. (2007). 2007 guide-
lines for the management of arterial hypertension. Eu-
ropean heart journal, 28(12):1462–1536.
Marazzi, A., L, G., and HD, D. (2007). New approaches
to reimbursement schemes based on patient classifica-
tion systems and their comparison. Health Serv Man-
age Res, 20(3):203–210.
MHSSE (2011). National health system annual report.
Technical report, Ministry of Health Social Services
and Equality. Sistema Nacional de Salud.
Newhouse, J. P., Buntin, M. B., and Chapman, J. D. (1997).
Risk adjustment and medicare: taking a closer look.
Health Affairs, 16(5):26–43.
NHLBI (2016a). National Heart, Lung, and Blood Institute.
http://www.nhlbi.nih.gov/ [Accessed: 27/05/2016].
NHLBI (2016b). Risk Factors for High Blood
Pressure. http://www.nhlbi.nih.gov/health/health-
topics/topics/hbp/atrisk [Accessed: 29/05/2016].
NLM (2016). National library of medicine. high blood pres-
sure. www.goo.gl/Lkhkkc [Accessed: 27/05/2016].
Parks, J., Svendsen, D., Singer, P., Foti, M. E., and Mauer,
B. (2006). Morbidity and mortality in people with
serious mental illness. Alexandria, VA: National As-
sociation of State Mental Health Program Directors
(NASMHPD) Medical Directors Council, 25.
Soguero-Ruiz, C. and et al. (2016a). Predicting colorec-
tal surgical complications using heterogeneous clini-
cal data and kernel methods. Journal of Biomedical
Informatics, 61:87 – 96.
Soguero-Ruiz, C. and et al. (2016b). Support vector fea-
ture selection for early detection of anastomosis leak-
age from bag-of-words in electronic health records.
IEEE Journal of Biomedical and Health Informatics,
20(5):1404–1415.
Soni, A. and Mitchell, E. (2016). Expenditures for com-
monly treated conditions among adults age 18 and
older in the u.s. civilian noninstitutionalized popula-
tion, 2016. Statistical Brief, 487. May 2016. Agency
for Healthcare Research and Quality, Rockville, MD
[Accessed: 22/02/2017].
Steinwart, I. and Christmann, A. (2008). Support vector
machines. Springer Science & Business Media.
PhyCS 2017 - 4th International Conference on Physiological Computing Systems
22
