
Development of a Lab on a Chip Flow Cytometer
Portable and Affordable Flowcytometer for Point of Care Diagnostics
in Rural Areas
A. Mohan
1
, N. Marshkole
2
, A. P. Nair
2
, A. Bharadwaj
2
, A. Prabhakar
1
and T. Saiyed
2
1
Indian Institute of Technology Madras, Chennai, India
2
Center for Cellular and Molecular Platform, Bangalore, India
Keywords: Flow Cytometer, Forward Scatter, Side Scatter, Hydrodynamic Focusing, Flow Control, Lensed Fiber.
Abstract: We have developed a lab prototype of a microfluidic flow analyzer, which is capable of quick and efficient
analysis of biological samples. Low cost and portability makes it suitable for point of care diagnostics in
rural area of developing countries. A significant size reduction has been achieved by choosing a
microfluidic flow and pumping system, micro-electronic components, integrated circuits boards, and fiber
optics. A two dimensional microfluidic chip fabricated with nanolithography technique integrates the
fluidics and optics into a single platform. Forward scatters (FSC), side scatter (SSC) and fluorescence (FL)
are measured from polystyrene beads as well as from different live cells. Overall dimension achieved for the
final prototype is 39 cm x 22 cm x 10 cm.
1 INTRODUCTION
Among the existing methods for biological fluid
analysis, flow cytometry is always preferred for its
functionality and capability of detailed analysis
(Shapiro 1995). It is a non destructive way of
knowing the physical and biochemical properties of
biological samples based on optical detection. In
addition to applications in biomedical research field
for immunology (Chattopadhyay et al. 2006; Mohan
et al. 2015), single cell analysis (Chattopadhyay and
Roederer 2012; De Rosa 2012; Telford et al. 2012)
and molecular biology (Nunez 2001; Chattopadhyay
et al. 2006), it is also being availed in a clinical
environment (Glencross et al. 2002). As far as
haematological diseases are concerned, it is very
important to check the status and progression of
disease in a regular basis. Taking the case of rural
areas in developing counties, many of them are
struggling with communicable and non
communicable diseases of severe nature like AIDS,
leukaemia etc. Lack of proper diagnostics and
treatment facilities is one of the major reasons for
unsolved health issues. This has been a motivation to
researchers in the field of biomedical devices for the
past few decades (Martinez et al. 2008; Martinez et
al. 2010). There have been many efforts to develop a
portable and cost effective flow cytometer, which
can be used in primary health care centres in rural
area (Tung et al. 2004; Wang et al. 2004;
Chattopadhyay et al. 2006; Mao et al. 2009; Mao et
al. 2012). Numerous studies have proved that the
transportation and handling of blood sample can
significantly affect test results while on spot tests
can improve reliability. In addition to rural
communities in need of testing for HIV health
monitoring, many urban localities throughout India,
will benefit from access to a low-cost and more
instrument.
Conventional models of a flow cytometer are as
expensive as $10,000 and work only in centralised
facilities of major health care centres (Shapiro
1995). Bulkiness and complexity of the instrument
demands proper maintenance and well trained
expertise to operate the machine. Qualified people
have to go through special training for using the
machine, analyzing the data and make reports. In
addition to that, fixing any functional failure and
troubleshooting requires access to technicians. All
these add a considerable cost to the maintenance.
Our approach for designing a portable and low
cost flow cytometer involved understanding the
major factors that cause the bulkiness and
complexity of the conventional system, and methods
Mohan A., Marshkole N., P. Nair A., Bharadwaj A., Prabhakar A. and Saiyed T.
Development of a Lab on a Chip Flow Cytometer - Portable and Affordable Flowcytometer for Point of Care Diagnostics in Rural Areas.
DOI: 10.5220/0006175301790185
In Proceedings of the 10th International Joint Conference on Biomedical Engineering Systems and Technologies (BIOSTEC 2017), pages 179-185
ISBN: 978-989-758-216-5
Copyright
c
2017 by SCITEPRESS – Science and Technology Publications, Lda. All rights reserved
179

to reduce them. A conventional flow cytometer
design encompasses three major disciplines of
technology, namely are fluidics, optics and
electronics. Fluidics deals with guiding the sample
inside the machine once it is loaded. Around 2-5 mL
of the sample fed into the inlet of the machine is
sucked in by fluidic pumps through the respective
tubing. This sample is then subject to a 3
dimensional fluid focusing technique, called
hydrodynamic focusing (HDF). A guiding fluid will
flow around the sample keep the flow focused to a
certain diameter. Pumping of the sheath fluid is
controlled such that the sample stream makes a
single file flow of cells or particles down the flow.
This flow then undergoes optical interrogation with
one or more lasers. Collection of various signals
from the sample is achieved with the detectors kept
at different angles with respect to the incident laser.
Most of the incident light gets scattered in the
forward direction, without much interaction with the
internal structures of the cell. This signal collected
between 0
º
and 20
º
gives information regarding the
cell size and is called forward scatter (FSC). Internal
complexity information of the cell is given by the
scatter at larger angles 45
º
-90
º
, called side scatter
(SSC) (De Rosa et al. 2001). While the FSC and
SSC data together described the physical and
structural properties of cells, we can label the cells
with specific fluorescent tags and identify them by
detecting the emitted fluorescence (FL). Many of
them have multicolour detection for which a bunch
of additional lasers and detectors are used. Although
the functionality is high, bulkiness, complexity and
cost is also high because of the design. The optical
unit working in free space domain consumes
considerable amount of space and it also requires
several components like lenses, prisms etc. to guide
the light in a desired way. Such a system would also
be highly sensitive to dust and other disturbances in
a primary health care (PHC). Use of several detector
units such as photomultiplier tubes (PMT), and
Avalanche photo diodes (APD) with high gain,
again increases both the complexity as well as power
consumption.
In this work, what we describe is a miniature
flow analyser as a lab-on-chip; combining principles
of optics, flow cytometry, microfluidics device
fabrication, and nano electronics to allow rapid cell
analysis and quantification. After minimal
preparation, the sample flows through a microfluidic
device in which a chosen laser detects the presence
of specific biomarkers e.g. CD4 in case of HIV
immune health monitoring. Data is collected and
processed on a small electronics board. The device
gives the user a clear, concrete measure of the level
of these biomarkers in patient samples. This
technology can be adapted to cell culture assays,
detection of water contamination, platelet and other
blood cell counts and oncology tests. The proposed
device will need an investment of only USD 5000,
uses a smaller sample volume, is highly portable and
is cheaper and easier to maintain and upgrade.
2 DESIGN AND FABRICATION
Reduction of size and cost being the major concerns
of the design, we have carefully chosen each
component for fluidics, optics and electronics.
Microfluidic pumps and chip have played a role in
reducing the physical volume considerably.
Microfluidics is generally chosen for the fact that its
channel dimensions are well suited to the
dimensions of cells being analyzed (El-Ali et al.
2006; Young and Beebe 2010; Thompson et al.
2014). The heart of the design is a microfluidic chip
with rectangular flow channels and grooves for
optical fiber insertion. Devices were fabricated with
the commonly used PDMS (Poly dimethyl Siloxane)
(Tung et al. 2004) as well as PMMA (Polymethyl
methacrylate). PDMS based devices were fabricated
using the photolithographic technique on silicon
wafer. Mixture of PDMS and cross linking agent in
10:1 ratio was poured onto the Silicon master and
baked in a hot oven at 70
ºC
for 6 hours. The mould
(Figure 1a) was peeled off from the silicon and
bonded with onto a glass slide after plasma
treatment. Inlets and outlets for tubing were punched
at the respective positions before the bonding.
Sample fluid and the sheath fluid are fed into their
respective inlets through silicon tubing. Once the
flow is started from the respective micro pump,
(Dolomite) the fluids will get into the main fluidic
channel of width 130 µm. Flow rates are controlled
such that the sample stream attains a desired width
depending on the size of the particle being
investigated. The sheath fluid guides the sample
sideways by developing a laminar flow. Required
volume of samples and reagents are tested to be 100
to 500 µl in such a device. The microfluidic chip
also has grooves meant for inserting optical fibers
for light illumination and detection. These groves
are located at a distance of 2 mm from the fluidic
junction (x) in a direction normal to the main flow
channel. Particles in the flow will undergo the
optical interrogation at specific locations in this
manner. Customised optical fibers with tapered/ len
sed tips (Lase Optics Inc.) serve to illuminate and
BIODEVICES 2017 - 10th International Conference on Biomedical Electronics and Devices
180
(a) (b)
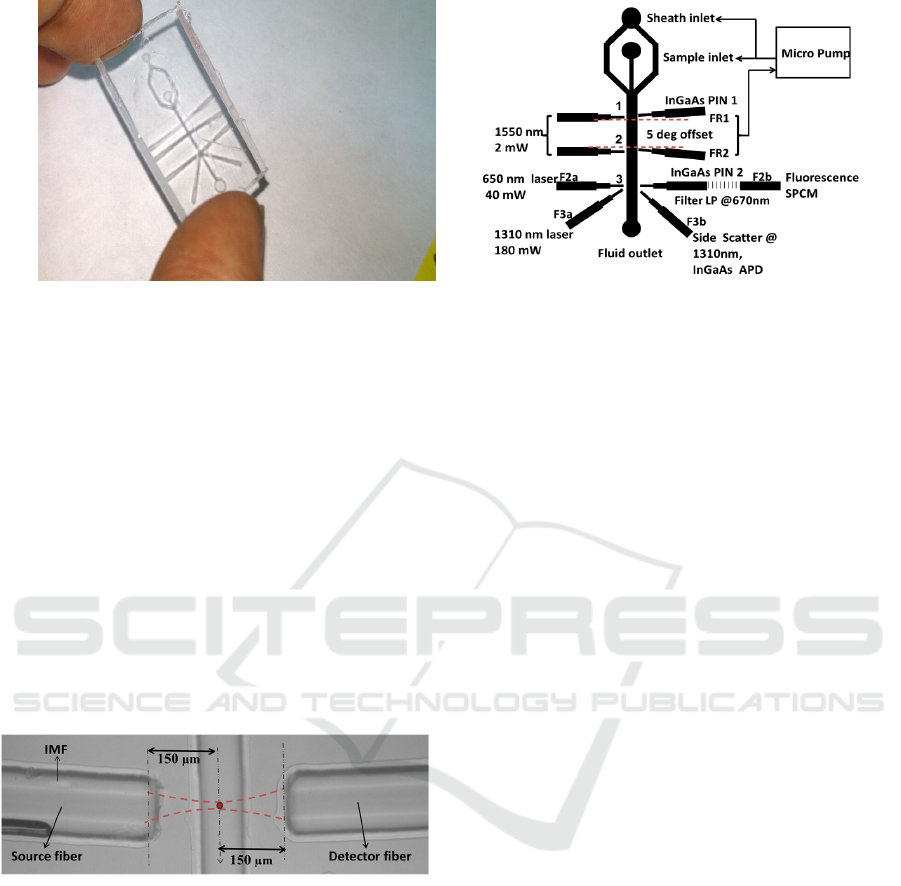
Figure 1: (a) Microfluidic device fabricated with PDMS (b) Micro flow analyser setup design describing the functions of
each fiber channels. The fluidic channel and fiber grooves are sown as thick lines.
collect light. The lensed single mode fiber helps to
focus the light to 15-20 µm dia. at a distance of 150
µm, which is the distance from the fiber groove
inner end to the centre of the fluidic channel as
shown in Figure 2. Fiber at the collection end has a
hemispherical lens with a higher numerical aperture,
to increase the collection efficiency. Detection fibers
are chosen to be multimode, since it is required to
maximize the amount of light being collected.
Losses due to presence of an air gap were eliminated
by filling the fiber groove with an index matching
fluid (IMF) of refractive index 1.4. The complexity
with free space optics and components was thus
avoided by availing of lensed fibers and self-guided
fiber grooves.
Figure 2: Top view of the microfluidic chip depicting
optical interrogation of particles in flow channel.
Figure 1b, shows the complete design of the
instrument including three lasers and four detectors.
First two pairs of fiber grooves FR1 and FR2 are
meant for collecting the FSC signal at +50 and -50
respectively. A diode laser at 1550 nm with fiber
coupled output was used as a common source for
FR1 and FR2. Output power of 2 mW is split into
nearly equal powers by using a 50:50 fiber splitter
and fed to the tapered fibers that were fit into the
grooves. A cell passing through the fluidic channel
gets interrogated at point 1 and 2, and the FSC is
collected by separate fiber coupled InGaAs p-i-n by
correlating PIN1 and PIN2 outputs during the flow.
A feedback system connected to the micro pump is
designed to monitor and control the flow rates. Point
3 in figure 1b is the junction where FL and SSC are
being collected. Our choice laser and detector for
fluorescence excitation were according to the
biomarker being used. In this work we have used a
650 nm source at 2 mW, and a single photon
counting module (SPCM - Perkin Elmer) for
detection of fluorescence signal at 5
º
. SSC is also
detected at the same point in the device using a 1310
nm, 180 mW laser source. Fiber grooves F3a and
F3b are used to make 90
º
between the source and
detector. We have used an avalanche photodiode
(APD), as the scattered signal is too weak to be
detected with a PIN diode. The design is such that
one can customize the combination of lasers and
detectors to be used for a given experiment. Desired
combinations of F2a, F2b, F3a and F3b can be used
for measuring different parameters of interest.
3 EXPERIMENT AND RESULTS
3.1 Flow Control and Manipulation
Having established hydrodynamic focusing in the
microfluidic chip, and interrogated cells at different
locations down the channel, it was important for us
to know the extent of correlation between the events
different sizes (Sigma Aldrich). Original samples of
1 million/mL concentration were fed to the sample
inlet and DI water was used as the sheath fluid.
Sample and sheath were flowed at the rate of 10
µL/min and 30 µL/min respectively. The lag time of
the particle, as it travels from FR1 to FR2 was
observed for different flow rates. A reduction of lag
time was found as the flow rate as increased as
Development of a Lab on a Chip Flow Cytometer - Portable and Affordable Flowcytometer for Point of Care Diagnostics in Rural Areas
181
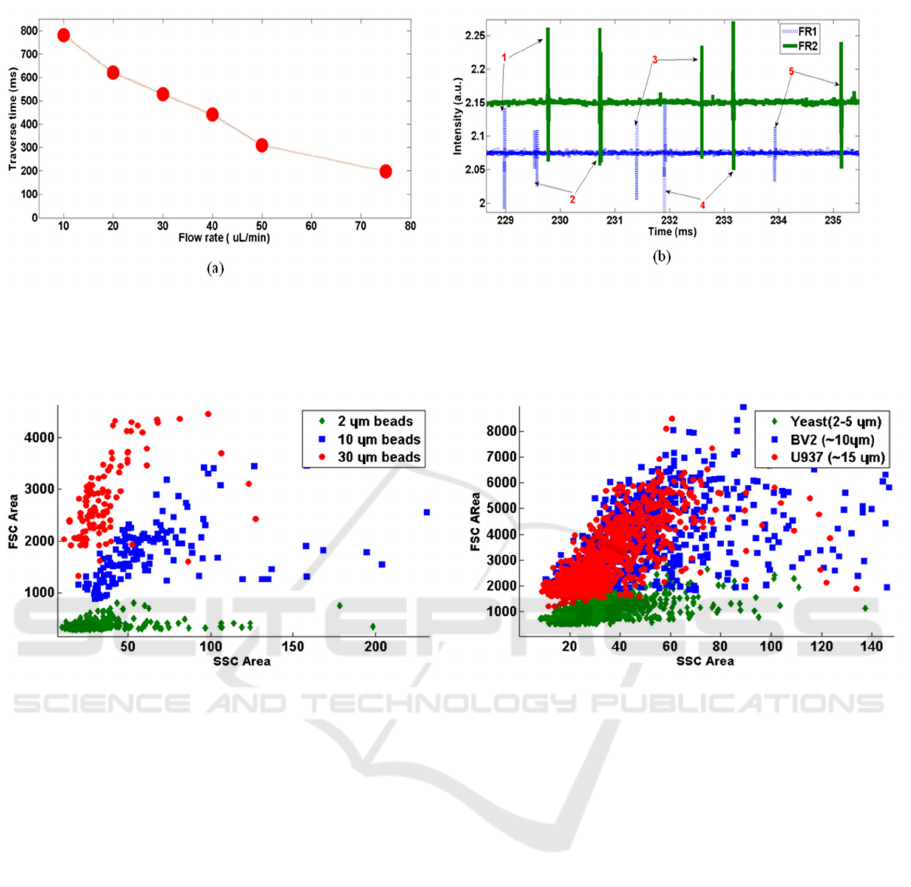
Figure 3: (a) Experimentally observed traverse time (time delay) between FR1 and FR2, as a function of flow rate. (b)
Intensity versus time plot showing the correlation of events occurring in FR1and FR2 channel. 5 pair of events are
identified and marked.
Figure 4: (a) SSC versus FSC scatter plot of different size beads. (b) Scatter plot for cells of different sizes. Area of FSC
signal is plotted against the area of SSC signal in both cases.
shown in Figure 3a. Observing the trend between the
two parameters also helped in validating the concept
of flow control using the velocity measurement and
feedback system. FSC events detected at both the
channels are found to be reasonably correlated.
Figure 3b shows an instance of flow with
polystyrene beads. We have FR1 and FR2 locations
separated by a distance of 2 mm, and the
corresponding time delay observed in the data is
around 1ms. Time delay measured from this data
allows one to estimate the flow rate of the sample.
Correlation measure between FR1 and FR2 yield a
reliable metric for use as flow control.
3.2 Size based Isolation of Beads and
Cells
The primary testing of the FSC and SSC detection
was carried out with commercially available
polystyrene beads of 2 µm, 10 µm and 30 µm
standard sizes. Therefore, we validated the detection
of scattering from different sized live cells such as
yeast (3-5 µm), U937 (~10 µm) and BV2 (~15 µm).
Figure 4a shows the isolation of different sized
beads plotting the area of FSC signal with that of
SSC signal. We can see that the beads are
reasonably separated in terms of FSC amplitude. A
similar plot of different types of cells is shown in
figure 4(b). We could see a considerable difference
in the FSC area of the yeast cells from the other two
cell groups which are not properly resolved. The
sample stream is flowing under a two dimensional
(2D) flow focusing condition in which the sample
fluid is getting focused only in the lateral directions.
This lateral focusing also allows the particles to
distribute along the height, 150 µm of the flow
channel. Hence it never achieves a complete single
file flow in a 2D device. Studies have shown to have
improved results when we use 3D flow focusing
methods (Rosenauer et al. 2011; Shivhare et al.
2016) (Mao et al. 2009).
BIODEVICES 2017 - 10th International Conference on Biomedical Electronics and Devices
182
3.3 Cell Labelling and Detection of
Fluorescence
Our setup for fluorescence detection system consists
of a 650 nm laser source which can yield 30 mW of
power. Collection of the signal was made at 135
0
with respect to the source direction. The choice of
laser wavelength and filter (670 nm long pass) was
optimized for APC - Cy5.5 dye, which has a
maximum excitation at 650 nm and emission peak at
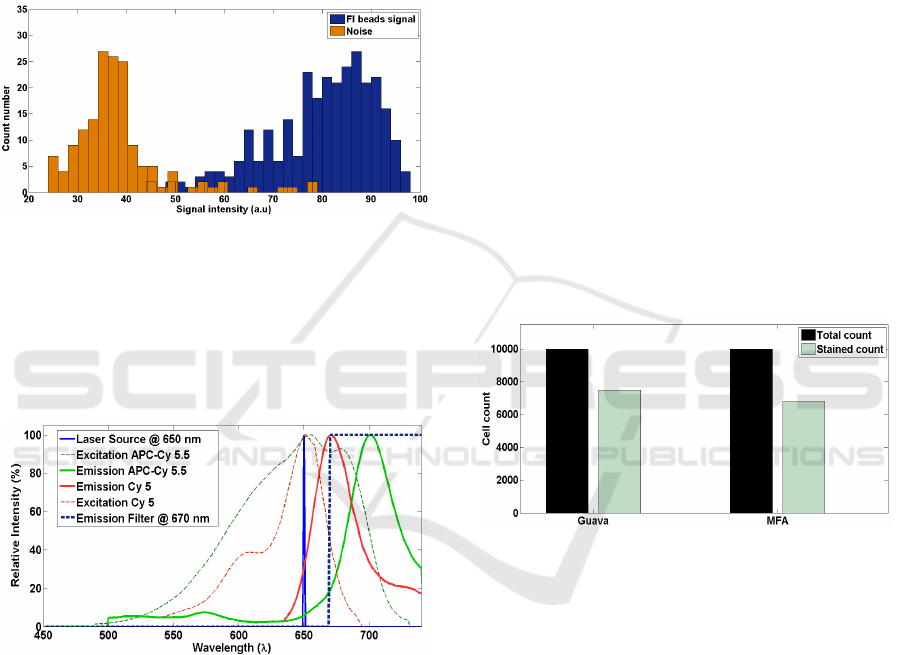
Figure 5: Spectrums of Cy 5 fluorophore and APC - Cy
5.5 used for beads and cells respectively.
680 nm. Figure 5 shows the spectra of Cy5 and APC
– Cy 5.5. Fluorescent beads (Bangs Laboratory)
were customized to have Cy5 dye which has
excitation and emission at 630 nm 670 nm
respectively. Figure 6 is showing the capability of
Figure 6: Histogram of fluorescent beads detected over the
noise. The fluorescent signal intensity is well separated
from the noise histogram.
the system to separates out the intensity of
fluorescent beads from the noise. Having detected
the fluorescence signal from beads, we moved on to
measure the FSC and FL signals simultaneously
from live cells.
3.3.1 Sample Preparation – Staining of
Peripheral Blood Mononuclear Cells
with CD4- AP - Cy 5.5
We prepared a both stained and unstained samples
of PBMC (Himedia laboratory) with a concentration
of 1 million /100 µl. The sample was spun down at
1500 rpm and 4
ºC
for 3 minutes. Blocking buffer
(1% BSA, 0.01 % Azide and 1X PBS) was added to
it after removal of media. One million cells were
counted, washed and kept for 10 minutes of room
temperature incubation on adding 2.5 µg of true
stain. It was taken and washed again in blocking
buffer. 15 µl of CD4 APC Cy 5.5 were then added
into 100 µl of reaction volume. After doing one
more incubation for 20 minutes in ice, the cells were
washed in buffer (1X PBS, 0.01 % Azide). Same
count of cells was taken for unstained sample after
doing the washing. Both the samples were tested in
Guava analyzer and the micro flow analyser
simultaneously. Figure 7 shows the comparison of
counts obtained in Guava and our micro flow
analyser. Out of 10000 events in the Guava, 7500
were giving positive staining results, making the
Figure 7: Comparison of detection efficiency of MFA and
Guava with CY5 stained PBMC cells.
ratio 1.33. We have compared this number to the
ratio of FSC events to FL events detected in micro
flow analyzer. And it came to be as close as 1.4.
Results with PBMC were found to be encouraging to
continue the experiments with human blood, since
the system has proved it’s the ability to pick up the
staining levels of PBMCs. In the following section
we showcase the hardware of lab prototype which
includes the optics, fluidics and electronics parts of
the system.
3.4 Product Packaging
We have been able to encase the entire setup of our
micro flow analyzer in the form of a portable
instrument (Figure 6(d)) along with user friendly
software. Lasers with infrared wavelengths being
Development of a Lab on a Chip Flow Cytometer - Portable and Affordable Flowcytometer for Point of Care Diagnostics in Rural Areas
183
available at a lower cost, we decided to use them for
FSC and SSC detection. The fluorescence
wavelengths being dependent on the sample
(fluorophore) being used, the current version was
designed for APC Cy 5.5, and we used a 650 nm
laser for excitation. To test any other sample, the
excitation wavelength and filters can be changed. A
wavelength tunable laser will also serve this purpose
for testing variety of samples. All the lasers and
detectors were integrated onto a single board as
shown in figure 8(b). Use of optical fibers to guide
light has helped in saving physical space. All the
sources and detectors were spliced with lensed fibers
and were guided right till the point of interrogation.
The specially designed grooves for fibers in the
microfluidic chip kept the fiber in place well aligned
to the microfluidic channel. Microfluidic piezo
pumps (Dolomite) greatly contributed to the
reduction of sample volume as well as the
instrument size. Electrical signals from the detectors
were converted by a 10 bit analog to digital
converter (ADC) and digital data was transferred to
the 16 bit micro-controller. Data communication
with the computer was achieved over a UART
interface. We have demonstrated a compact
packaging method for the instrument which is
enclosed with a black acrylic box as shown in Figure
8(d). The components were arranged in two stacks
supported by acrylic plates and metallic posts. The
bottom plate consists of the electronic board with
lasers and detectors, microcontroller board and
power supply. Top plate has the microfluidic chip,
micro pump and controllers etc. (Figure 8(c)).
Optical fibers spliced to the detectors of bottom
plate are brought to the top plate through given slots.
The whole package has been finally covered with a
compatible lid of same material. Containers for
sample, sheath and wash fluids were kept in the
small outer box attached to the package. One can
load the sample at this point so that it will be taken
in through the tubing connected with the micro
pump. Figure 8 shows different parts of the final
package. Connecting ports for power supply and
USB connectivity are also given at one side of the
box. The software for real time data collection and
analysis has been designed on Python in which user
is allowed to control the lasers and detectors from a
graphical user interface.
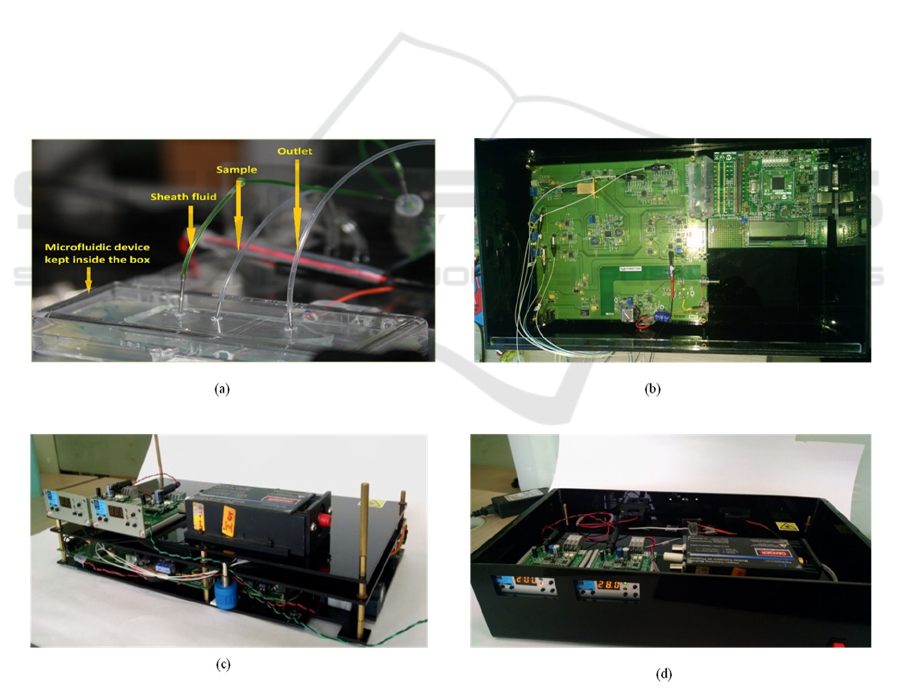
Figure 8: (a) Microfluidic system of the Micro flow analyser, comprising the microfluidic chip, piezo pump and tubing. (b)
Bottom plate of the instrument consisting of integrated electronic board of lasers and detectors, microcontroller board, and
power supply unit. (c) Top plate with pump controllers, SPCM and microfluidic system. (d) Complete final look of the
instrument packaged in a black acrylic enclosure of size 39 cm x 22 cm x 10 cm.
BIODEVICES 2017 - 10th International Conference on Biomedical Electronics and Devices
184

4 CONCLUSIONS
We have developed a laboratory scale prototype,
which is in the final stages of optimization. We have
successfully tested this prototype for microfluidic,
optics and electronics integration along with flow
rates for beads and cells testing. We have also
optimized the fluorescence testing with beads and
PBMC cells with the final integration. This novel
design and integration has been patented in US and
South Africa (Saiyed et al. 2016). Currently we are
working on alternative methods for 3D flow
focusing since presently employed methods requires
complex fabrication techniques.
ACKNOWLEDGEMENTS
The authors would like to thank Feroz Musthafa and
Asish Kumar Sen for their assistance in
microfluidics and the Center for Nano science and
Engineering, Indian Institute of Science, for use of
their device fabrication facility. We would also
thank BIRAC (Biotechnology Industry Research
Assistance Council, India) for the funding under
their BIPP scheme.
REFERENCES
Chattopadhyay PK, Price D a, Harper TF, et al (2006)
Quantum dot semiconductor nanocrystals for
immunophenotyping by polychromatic flow
cytometry. Nat Med 12:972–977. doi:
10.1038/nm1371.
Chattopadhyay PK, Roederer M (2012) Cytometry:
Today’s technology and tomorrow’s horizons.
Methods 57:251–258. doi:
10.1016/j.ymeth.2012.02.009.
De Rosa SC (2012) Vaccine applications of flow
cytometry. Methods 57:383–391. doi:
10.1016/j.ymeth.2012.01.001.
De Rosa SC, Herzenberg L a, Herzenberg L a, Roederer
M (2001) 11-color, 13-parameter flow cytometry:
identification of human naive T cells by phenotype,
function, and T-cell receptor diversity. Nat Med
7:245–248. doi: 10.1038/84701.
El-Ali J, Sorger PK, Jensen KF (2006) Cells on chips.
Nature 442:403–411. doi: 10.1038/nature05063.
Glencross D, Scott LE, Jani I V., et al (2002) CD45-
assisted PanLeucogating for accurate, cost-effective
dual-platform CD4+ T-cell enumeration. Clin Cytom
50:69–77. doi: 10.1002/cyto.10068.
Mao X, Lin SCS, Huang TJ (2009) High-throughput on-
chip flow cytometry system using “microfluidic
drifting” based three-dimensional (3D) hydrodynamic
focusing. TRANSDUCERS 2009 - 15th Int Conf
Solid-State Sensors, Actuators Microsystems 425–
428. doi: 10.1109/SENSOR.2009.5285473.
Mao X, Nawaz AA, Lin SCS, et al (2012) An integrated,
multiparametric flow cytometry chip using
“microfluidic drifting” based three-dimensional
hydrodynamic focusing. Biomicrofluidics. doi:
10.1063/1.3701566.
Martinez AW, Phillips ST, Carrilho E, et al (2008) Simple
telemedicine for developing regions: Camera phones
and paper-based microfluidic devices for real-time,
off-site diagnosis. Anal Chem 80:3699–3707. doi:
10.1021/ac800112r.
Martinez AW, Phillips ST, Whitesides GM, Carrilho E
(2010) Diagnostics for the developing world:
microfluidic paper-based analytical devices. Anal
Chem 82:3–10. doi: 10.1021/ac9013989.
Mohan A, Bharadwaj A, Marshkole N, et al (2015) Opto-
fluidic flow analysis for monitoring of immunity
levels. Int Conf Opt Photonics 2015 9654:96540W.
doi: 10.1117/12.2182901.
Nunez R (2001) DNA measurement and cell cycle
analysis by flow cytometry. Curr Issues Mol Biol
3:67–70.
Rosenauer M, Buchegger W, Finoulst I, et al (2011)
Miniaturized flow cytometer with 3D hydrodynamic
particle focusing and integrated optical elements
applying silicon photodiodes. Microfluid Nanofluidics
10:761–771. doi: 10.1007/s10404-010-0707-z.
Saiyed T, Mondal S, Prabhakar A, Krishnamurthy H
(2016) Microfluidic-based flow analyzer.
Shapiro HM (1995) Practical Flow Cytometry. Cytometry
19:376–376. doi: 10.1002/cyto.990190414.
Shivhare PK, Bhadra A, Sajeesh P, et al (2016)
Hydrodynamic focusing and interdistance control of
particle-laden flow for microflow cytometry.
Microfluid Nanofluidics. doi: 10.1007/s10404-016-
1752-z.
Telford WG, Hawley T, Subach F, et al (2012) Flow
cytometry of fluorescent proteins. Methods 57:318–
330. doi: 10.1016/j.ymeth.2012.01.003.
Thompson a M, Paguirigan a L, Kreutz JE, et al (2014)
Microfluidics for single-cell genetic analysis. Lab
Chip 14:3135–42. doi: 10.1039/c4lc00175c.
Tung YC, Zhang M, Lin CT, et al (2004) PDMS-based
opto-fluidic micro flow cytometer with two-color,
multi-angle fluorescence detection capability using
PIN photodiodes. Sensors Actuators, B Chem 98:356–
367. doi: 10.1016/j.snb.2003.10.010.
Wang Z, El-Ali J, Engelund M, et al (2004) Measurements
of scattered light on a microchip flow cytometer with
integrated polymer based optical elements. Lab Chip
4:372–377. doi: 10.1039/b400663a.
Young EWK, Beebe DJ (2010) Fundamentals of
microfluidic cell culture in controlled
microenvironments. Chem Soc Rev 39:1036–1048.
doi: 10.1039/b909900j.
Development of a Lab on a Chip Flow Cytometer - Portable and Affordable Flowcytometer for Point of Care Diagnostics in Rural Areas
185
