
Prediction of Essential Genes based on Machine Learning and
Information Theoretic Features
Dawit Nigatu and Werner Henkel
Transmission Systems Group (TrSyS), Jacobs University Bremen, Bremen, Germany
Keywords:
Essential Genes, Information-theoretic Features, Machine Learning, SVM, Markov Order Estimation.
Abstract:
Computational tools have enabled a relatively simple prediction of essential genes (EGs), which would oth-
erwise be done by costly and tedious gene knockout experimental procedures. We present a machine learn-
ing based predictor using information-theoretic features derived exclusively from DNA sequences. We used
entropy, mutual information, conditional mutual information, and Markov chain models as features. We em-
ployed a support vector machine (SVM) classifier and predicted the EGs in 15 prokaryotic genomes. A five-
fold cross-validation on the bacteria E. coli, B. subtilis, and M. pulmonis resulted in AUC score of 0.85, 0.81,
and 0.89, respectively. In cross-organism prediction, the EGs of a given bacterium are predicted using a model
trained on the rest of the bacteria. AUC scores ranging from 0.66 to 0.9 and averaging 0.8 were obtained. The
average AUC of the classifier on a one-to-one prediction among E. coli, B. subtilis, and Acinetobacter is 0.85.
The performance of our predictor is comparable with recent and state-of-the art predictors. Considering that
we used only sequence information on a problem that is much more complicated, the achieved results are very
good.
1 INTRODUCTION
The subset of genes which are absolutely necessary
for the survival of an organism are called essential
genes (EGs). Identification of these genes is very im-
portant for understanding the minimal requirements
for maintaining life (Itaya, 1995). EGs can be used as
potential drug targets for directed drug design against
pathogens (Chalker and Lunsford, 2002; Lamichhane
et al., 2003). In synthetic biology, studies on EGs are
very crucial for re-engineering microorganisms and
building a minimal genome (Hutchison et al., 2016).
Traditionally, experimental procedures such as
single gene knockout experiments (Chen et al.,
2015; Giaever et al., 2002), transposon mutagenesis
(Salama et al., 2004), and RNA interference (Cullen
and Arndt, 2005) are used to identify the EGs. Al-
though the experimental methods are fairly accurate,
they are often time-consuming, expensive, and labo-
rious. Thus, various computational prediction meth-
ods have been proposed (Chen and Xu, 2005; Acencio
and Lemke, 2009). The earliest computational meth-
ods were based on comparative genomics in which
gene essentiality annotations are transferred among
species through homology mappings (Mushegian and
Koonin, 1996; Zhang et al., 2016). Later on, as the
gene essentiality data of some model organisms be-
came available in public databases (such as DEG (Luo
et al., 2014), CEG (Ye et al., 2013), and OGEE (Chen
et al., 2012)), researchers have extensively studied the
characteristics and features of EGs and non-essential
genes (NEGs) to deploy computational methods of
prediction. The proposed methods make use of se-
quence information (e.g., protein length, strand bias,
and amino acid composition) (Ning et al., 2014; Song
et al., 2014), network topology (e.g., degree central-
ity and betweenness centrality) (Plaimas et al., 2010;
Acencio and Lemke, 2009; Lu et al., 2014), gene ex-
pression (e.g., mRNA expression level and fluctua-
tions in gene-expression) (Deng et al., 2011; Cheng
et al., 2014), and functional domain (e.g., domain en-
richment) based features (Deng et al., 2011). The
features or their combinations are then utilized along
with machine learning algorithms for predicting EGs.
Except for the sequence-based features, which
can be obtained from the primary DNA or gene se-
quences, the others require some sort of precom-
puted experimental data. Network topology based
features require the availability or construction of
protein-protein interaction, gene regulatory networks,
or metabolic networks. Similarly, the gene expression
and functional domain features demand the expres-
Nigatu D. and Henkel W.
Prediction of Essential Genes based on Machine Learning and Information Theoretic Features.
DOI: 10.5220/0006165700810092
In Proceedings of the 10th International Joint Conference on Biomedical Engineering Systems and Technologies (BIOSTEC 2017), pages 81-92
ISBN: 978-989-758-214-1
Copyright
c
2017 by SCITEPRESS – Science and Technology Publications, Lda. All rights reserved
81

sion data and a search in protein domain databases
such as PROSITE and PFAM. Although experimen-
tal and genetic network information is available for
the well-studied organisms, they are not available for
all organisms, especially for newly sequenced and
under-studied organisms. Hence, we intended to pro-
duce a machine learning based predictor relying only
on primary sequence information. Ning et al. (Ning
et al., 2014) proposed a gene essentiality predic-
tor that uses only primary sequence information and
showed that decent results can be obtained. They used
nucleotide, di-nucleotide, codon, and amino acid fre-
quencies along with what is known as CodonW fea-
tures. The CodonW features, which are sequence
derived, are obtained from a codon usage analysis
software (http://codonw.sourceforge.net). However,
some of the features in the CodonW features are not
purely obtainable from the primary sequence. For in-
stance, the Codon Adaptation Index (CAI) is a mea-
sure of the relative adaptability of the codon usage
of a gene compared to the codon usage of highly ex-
pressed genes (Sharp and Li, 1987). That means, one
needs to first distinguish the highly expressed genes in
the organism. The other very effective essential gene
predictor based solely on sequence and sequence de-
rived properties is ZUPLS (Song et al., 2014). ZUPLS
uses features from the so-called Z-curve, sequence
based (e.g., size, CAI, and strand), homology map-
ping, and domain enrichment scores. Note that the
latter two require database searches.
In this work, we present a machine-learning
based essential gene predictor using information-
theoretic features derived exclusively from the DNA
sequences. The information-theoretic features are en-
tropy (Shannon and Gibbs), mutual information (MI),
conditional mutual information (CMI), and Markov
parameters. These quantities measure the structural
and organizational properties in the DNA sequences.
The entropy computations will highlight the degree
of randomness and thermodynamic stability of the
genes. In a previous study (Nigatu et al., 2016),
we have extensively analyzed the application and im-
plication of Shannon and Gibbs entropies in bacte-
rial genomes. MI has been extensively used in vari-
ous computational biology and bioinformatics appli-
cations. For instance, MI profiles were used as a ge-
nomic signatures to reveal phylogenetic relationships
between genomic sequences (Bauer et al., 2008), as
a metric of phylogenetic profile similarity (Date and
Marcotte, 2003), and for identification of single nu-
cleoride polymorphisms (SNPs) (Hagenauer et al.,
2004). Hence, MI and CMI features make use of
sequence organization and dependencies and capture
the differences between EGs and NEGs. The Markov
features are selected for measuring statistical depen-
dencies inside the genes. Assuming that the gene se-
quences of EGs and NEGs are generated by Markov
sources of order m and n, respectively. We first esti-
mate the Markov orders from the genes in the training
sets and construct the corresponding Markov chains.
Then, the genes in the test dataset are scored using the
two Markov chains. The scores are used as Markov
features. After the features are collected, we employ
a support vector machine (SVM) to perform a super-
vised classification.
To our knowledge, the only essential gene predic-
tor which uses solely sequence composition informa-
tion is the work of Ning et al. (Ning et al., 2014).
Hence, we have tested our method on the organisms
used in their work, to allow for easy performance
comparisons.
2 METHODS
2.1 Data Sources
The dataset for essential and non-essential protein
coding genes were obtained from the database of es-
sential genes (DEG 13.5). DEG collects the list of
essential and non-essential genes in both eukaryotes
and prokaryotes, which were identified by different
experimental procedures such as single gene knock-
out and RNA interference (Luo et al., 2014). The
list and accession number of the bacteria used in this
study is presented in Table 1. The genome sequences
and the corresponding annotations were downloaded
from NCBI GenBank (Benson et al., 2013).
2.2 Information Theoretic Features
2.2.1 Mutual Information (MI)
The mutual information measures the information
shared by two random variables X and Y . It is the
amount of information provided by one random vari-
able about the other. We took X and Y to be two
bases located k bases apart. Mathematically, MI at
a distance k between X and Y with a joint probability
P
k
(x,y) is given by
I
k
(X,Y ) =
∑
x∈Ω
∑
y∈Ω
P
k
(x,y)log
2
P
k
(x,y)
P(x)P(y)
, (1)
where P(x) and P(y) are the marginal probabilities
of X and Y , respectively. Ω is the set of nucleotides
{A,T,C, G}. For a given gene, the joint and marginal
BIOINFORMATICS 2017 - 8th International Conference on Bioinformatics Models, Methods and Algorithms
82

Table 1: Name and accession No. of the bacteria used in this study.
No. Organism Abbreviation Accession No.
1 Acinetobacter baylyi ADP1 AB NC 005966
2 Bacillus subtilis 168 BS NC 000964
3 Escherichia coli MG1655 EC NC 000913
4 Francisella novicida U112 FN NC 008601
5 Haemophilus influenzae Rd KW20 HI NC 000907
6 Helicobacter pylori 26695 HP NC 000915
7 Mycoplasma genitalium G37 MG NC 000908
8 Mycoplasma pulmonis UAB CTIP MP NC 002771
9 Mycobacterium tuberculosis H37Rv MT NC 000962
10 Pseudomonas aeruginosa UCBPP-PA14 PA NC 008463
11 Staphylococcus aureus N315 SA NC 002745
12 Staphylococcus aureus NCTC 8325 SA2 NC 007795
13 Salmonella enterica serovar Typhi SE NC 004631
14 Salmonella typhimurium LT2 ST NC 003197
15 Vibrio cholerae N16961 VC NC 002505
16 Salmonella enterica serovar Typhimurium SL1344 SE2 NC 016810
probabilities are estimated from the relative frequen-
cies of the di-nucleotides and nucleotides, respec-
tively. Bauer et al. (Bauer et al., 2008), used this
definition (Eq. 1) and computed the profile of the av-
erage mutual information function to produce a ge-
nomic signature that can uniquely identify species.
The mutual information evaluation, using Eq. 1,
will result in a single value. However, we have
instead used the components of the definition, i.e.,
without the summations, as features (16 features).
That means, for each di-nucleotide, the quantity
P
k
(x,y)log
2
P
k
(x,y)
P(x)P(y)
is calculated and taken as a fea-
ture. We have tested the classifier for different dis-
tances (i.e., k = 1,2,3 ...) and the performance has
decayed very fast with increasing distance. Thus, we
have decided to use the MI between consecutive bases
(k = 1).
2.2.2 Conditional Mutual Information (CMI)
The mutual information between two random vari-
ables X and Y conditioned on a third random variable
Z having a probability mass function (pmf) P(z) is
given by
I(X;Y |Z) =
∑
z∈Ω
P(z)
∑
x∈Ω
∑
y∈Ω
P(x,y|z)log
2
P(x,y|z)
P(x|z)P(y|z)
=
∑
x∈Ω
∑
y∈Ω
∑
z∈Ω
P(x,y, z)log
2
P(z)P(x,y, z)
P(x,z)P(y, z)
(2)
where P(xyz), P(xz), and P(yz) are the joint pmfs of
the random variables shown in brackets.
Similar to the MI function, the CMI can be de-
fined as a function of the distance between two bases,
which we regard as random variables X and Y . For
example, CMI(d) would mean the MI between two
bases located d bases apart conditioned on the d bases
in the middle. Note that, the CMI expression in Eq. 2
reduces to the MI in Eq. 1, if X and Y are consecutive
(d = 0).
Again, the components of the CMI expression in
Eq. 2 (without the summations) will be taken as CMI
features. For all possible values of XZY, the quantity
P(x,y, z) log
2
P(z)P(x,y,z)
P(x,z)P(y,z)
will be calculated and taken
as a feature. Thus, the number of features depends
on the length of Z (4
d+2
). Here also, we have inves-
tigated the performance of the classifier for increas-
ing distance. The performance of the classifier decays
very quickly as the distance increases. Hence, we use
CMI(1) as a feature (64 features).
2.2.3 Entropy (E)
The Shannon entropy quantifies the average informa-
tion content of the gene sequence from the distribu-
tion of symbols. It is mathematically given as
H
N
= −
∑
i
P
(N)
s
(i)log
2
P
(N)
s
(i) , (3)
where P
(N)
s
(i) is the probability (relative frequency)
to observe the i
th
word of block size N. We calculated
the Shannon entropy of the genes for a block size of 3
(i.e. codons).
In our previous works (Nigatu et al., 2016; Nigatu
et al., 2014), we have measured the information con-
tent in DNA sequences along with the thermodynamic
Prediction of Essential Genes based on Machine Learning and Information Theoretic Features
83

stability. We measured stability using Gibbs entropy.
The Gibbs entropy is defined as
S
G
= −k
B
∑
i
P
G
(i)lnP
G
(i) , (4)
where P
G
(i) is the probability that a molecule is in
the i
th
state. We associated the probability distri-
bution with the thermodynamic stability quantified
by the nearest-neighbor free energy parameters. We
used Sanatluca’s unified free energy parameters for
di-nucleotide steps at 37
◦
C as in (SantaLucia, 1998).
The probability distribution, P
G
(i), is modeled by the
Boltzmann distribution given by
P
G
(i) =
n
i
e
−
E(i)
k
B
T
∑
j
n
j
e
−
E( j)
k
B
T
. (5)
n
i
is the frequency of the the i
th
codon and E(i) is the
energy of the codon according to (SantaLucia, 1998),
and T is the temperature in Kelvin.
We have computed the Shannon and Gibbs en-
tropies of the genes and used them as an entropy fea-
ture.
2.2.4 Markov (M)
First, the correct Markov chain order for both EGs
and NEGs in the training dataset is estimated. Then,
two Markov chains of the estimated orders are con-
structed. After that, the features are computed
by scoring every gene using the generated Markov
chains.
Numerous Markov chain order estimators have
been put forth in the literature. We have as-
sessed the performances of selected estimators (Tong,
1975; Katz, 1981; Peres and Shields, 2005; Dalevi
and Dubhashi, 2005; Men
´
endez et al., 2011) on
DNA sequence data and selected the estimator pro-
posed by Papapetrou and Kugiumtzis (Papapetrou and
Kugiumtzis, 2013). The order estimation is based on
CMI given in Eq. 2. A Markov chain of order L has
the following property.
P(x
n
|x
n−1
,...,x
n−L
,x
n−L−1
,...)
= P(x
n
|x
n−1
,...x
n−L
) .
(6)
Hence, for any m ≤ L, two nucleotides will be de-
pendent and the CMI (conditioned on the m− 1 inter-
mediate values) will be greater than zero. Conversely,
for m > L, the two nucleotides will be independent
given the intermediate values and CMI will be zero.
Using this observation, they have proposed both para-
metric and non-parametric significance testing proce-
dures (Papapetrou and Kugiumtzis, 2013; Papapetrou
and Kugiumtzis, 2016). The parametric approxima-
tion of the CMI by a gamma distribution is more ac-
curate than the other approximations (Papapetrou and
Kugiumtzis, 2016). In a symbol sequence of length N,
ˆ
I(X;Y |Z), the estimate of the CMI, is approximated
by the gamma distribution,
ˆ
I(X;Y |Z) ≈ Γ(
|Z|
2
(|X| − 1)(|Y | − 1),
1
N ln 2
) . (7)
The gamma distribution is used as the distribution of
the null hypothesis, H
0
: CMI(m) > 0. Since CMI ≥
0 always holds, one-sided parameter testing is per-
formed. Thus, the p-value is computed from the com-
plementary cumulative distribution of the gamma dis-
tribution in Eq. 7. H
0
is rejected if the p-value is less
than the nominal significance level (α = 0.05). When
H
0
is rejected, the next order is checked and the pro-
cess continues until the null hypothesis is accepted.
After the correct order is determined for the EGs
and NEGs, separately, two Markov chains of the es-
timated orders will be constructed. Then, the con-
structed Markov chains are used to score genes in
both the training and test data sets. If the gene se-
quence is b
1
,b
2
,b
3
,...,b
L
and m is the order of the
Markov chain, the score is calculated as
Score =
L−m
∑
i=1
P(b
i
b
i+1
...b
i+m
)
log
2
(
P(b
i+m
|b
i
b
i+1
...b
i+m−1
)
P(b
i+m
)
) .
(8)
The score gives an indication of how likely the
gene sequence is generated by the Markov chain com-
pared to a random generation. The probability of the
nucleotides is estimated from the frequencies in the
training set, whereas the conditional probabilities are
the entries of the Markov chain. The scores of a gene
sequence on the two Markov chains (EG and NEG)
are used as two features.
2.3 Classifier Design, Training, and
Evaluation
The analysis is performed using Python 3.5.2 with
scikit-learn module (Pedregosa et al., 2011). We used
the SVM classifier to train and classify the EGs and
NEGs. Mostly, the number of EGs is significantly
lower than that of NEGs. This imbalance between the
positive and negative datasets will cause a problem
for machine learning algorithms (Visa and Ralescu,
2005; Provost, 2000). To overcome this problem, the
datasets are balanced by randomly under-sampling
the NEGs to the size of the EGs. The number of selec-
tions needed to cover all the NEGs can be determined
BIOINFORMATICS 2017 - 8th International Conference on Bioinformatics Models, Methods and Algorithms
84
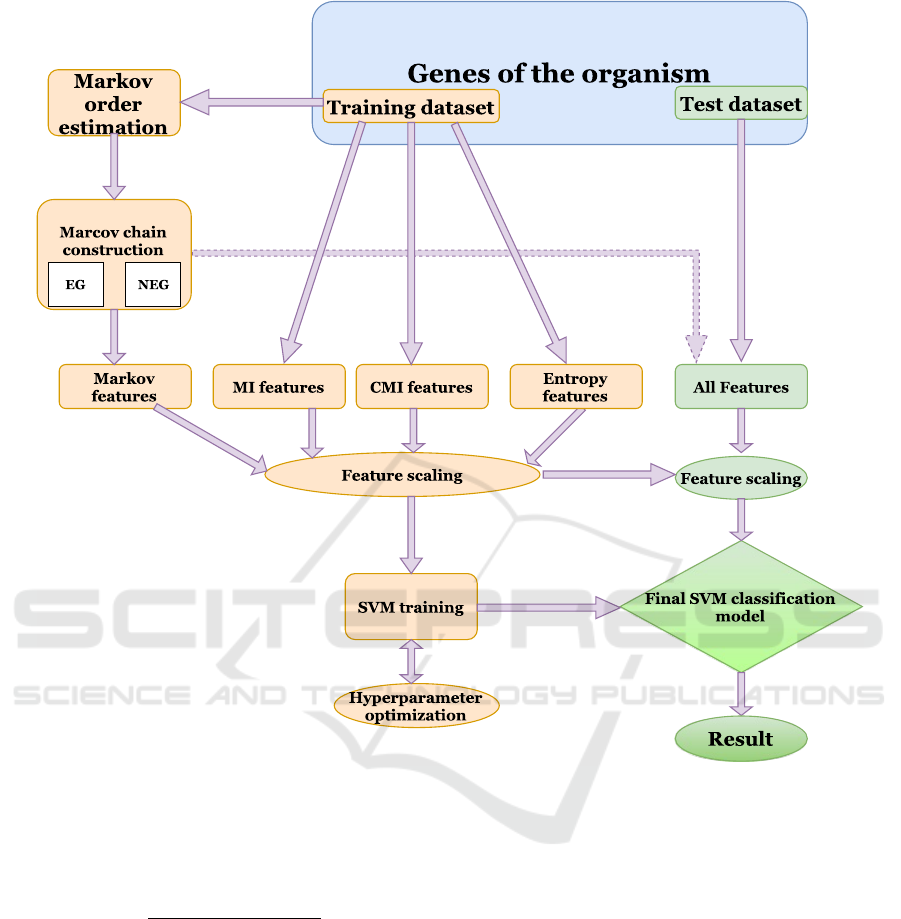
Figure 1: A flow diagram of the classification procedure.
from what is known as the Clarke and Carbon formula
(Clarke and Carbon, 1976), i.e.,
N =
log(1 − p)
log(1 − #EG/#NEG)
(9)
where p is the probability that a given gene is repre-
sented in the samples, #EG and #NEG are the num-
ber of essential and non-essential genes, respectively.
This formula is widely used to calculate the coverage
statistics in genome sequencing.
In the cross-organism predictions, one or a set
of organisms are used to train the SVM classifier,
whereas in the prediction of EGs in a given organism
(intra-organism), the datasets are divided into train-
ing and test sets. In the five-fold cross-validation, the
data is divided into five equal parts. The model is then
trained on four parts and tested on the remaining one.
The flowchart in Fig. 1 presents the procedures
followed in our EG and NEG classifier. To avoid the
scaling differences between features, all features were
standardized to zero mean and unit variance (feature
scaling) prior to the training and testing of the classi-
fier.
Different kernel functions (linear, radial basis
function (rbf), and polynomial) and hyper-parameters
(C and gamma) are considered. The C parameter in
the SVM classifier optimizes the trade-off between
misclassification of the training set and margin maxi-
mization (Ben-Hur and Weston, 2010). If C is small,
training errors will increase whereas a larger C value
leads to a hard margin. The gamma parameter in the
rbf kernel defines the influence of training examples
on the decision boundary. A large gamma means a
smaller variance and the decision boundary is influ-
enced by data points closer to the margin. The opti-
mal values of C, gamma, and the type of kernel are
Prediction of Essential Genes based on Machine Learning and Information Theoretic Features
85
obtained by a grid-search approach.
The Area Under the Curve (AUC) of the Receiver
Operating characteristic Curve (ROC) is used to eval-
uate the performance of our classifier. The ROC plots
the true positive (TP) rate versus false positive (FP)
rate. It shows the trade-off between sensitivity (Sn)
and specificity (Sp) for all possible thresholds. Other
performance evaluation such as Positive Predictive
Value (PPV ) and Accuracy (Ac) are also calculated.
However, these parameters depend on the selected
threshold value. Therefore, we will mainly use the
AUC score for analyzing the performance of the clas-
sifier. For a given threshold, the true positive (TP),
false negative (FN), false positive (FP), and true neg-
ative (TN) predictions are determined and Sn, Sp, Ac,
and PPV are calculated as follows:
Sn =
T P
T P + FN
,
Sp =
T N
T N + FP
,
PPV =
T P
T P + FP
,
Ac =
T P + T N
T P + FN + T N + FP
.
(10)
3 RESULTS AND DISCUSSION
3.1 Prediction of Essential Genes in E.
coli
The number of essential genes (EG) in E. coli (296) is
significantly lower than the number of non-essential
genes (4077). As mentioned in Section 2, a balanced
dataset is created by selecting an equal number of
NEGs. 61 random samplings were performed (which
ensures that 99% of NEGs are covered).
The balanced datasets were then passed to our
SVM classifier. A linear kernel with C = 0.5 was
selected to be the best hyperparameter using an ex-
tensive grid search. The features MI, M, and E are
used. To evaluate the models performance, a 5-fold
cross-validation is performed and the ROC curve and
AUC values for the individual features as well as their
combinations are presented in Fig. 2.
The estimated order for both the positive (EG)
and negative (NEG) samples was found to be five.
Hence, a fifth order Markov chain is constructed from
the training data sets and is used to score the genes.
Collectively, an AUC score of 0.85 is obtained. The
Sn, Sp, and Ac of our classifier, with the probabil-
ity threshold set at 0.5, are 0.88, 0.67, and 0.78, re-
spectively. The entropy features, i.e., Shannon and
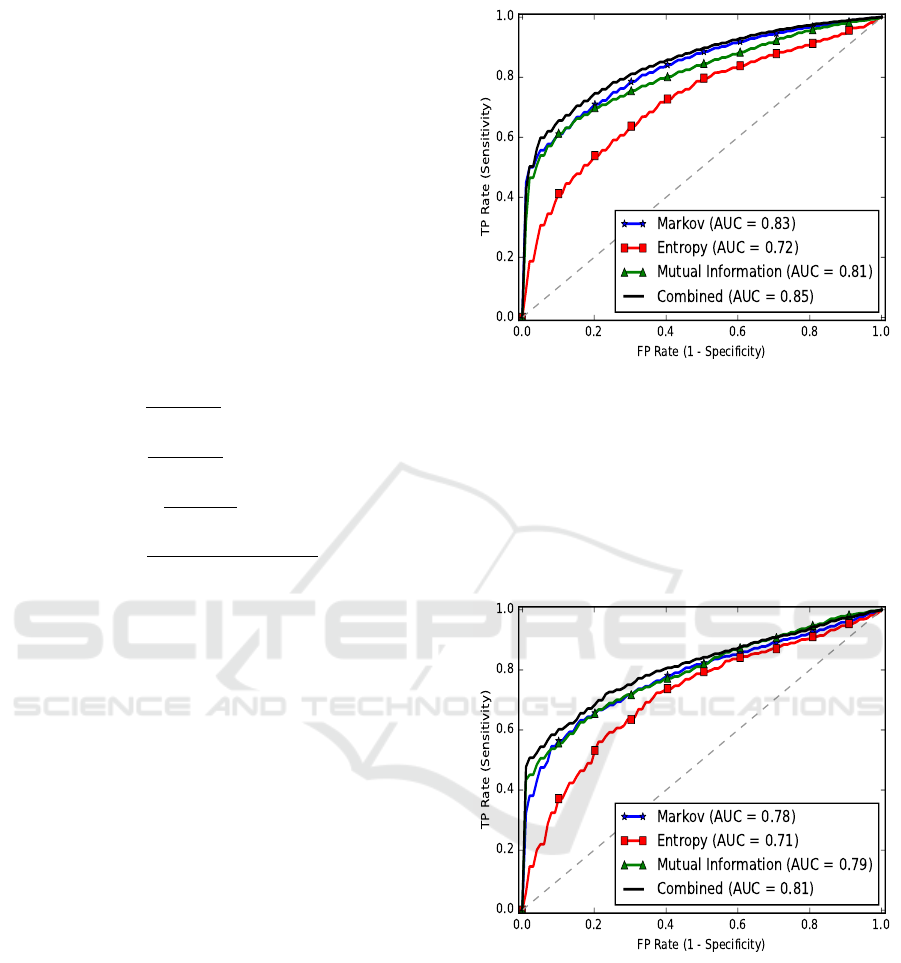
Figure 2: The average ROC curves of E. coli EG prediction.
Gibbs entropies produced the lowest performance.
This could be because of the dependency between the
Shannon and Gibbs entropies. Both of them make use
of the codon frequencies. The Markov and MI fea-
tures, even when used alone, produced a very good
performance.
Figure 3: The average ROC curves of M. pulmonis EG pre-
diction.
3.2 Prediction of Essential Genes in M.
pulmonis
The same procedure is taken to train and predict
the essential genes in M. pulmonis. A 5-fold cross-
validation of the linear SVM classifier is performed
on the balanced dataset. The 310 non-essential genes
were selected out of 322 to balance the datasets. 20
random samplings were performed and the average
BIOINFORMATICS 2017 - 8th International Conference on Bioinformatics Models, Methods and Algorithms
86
ROC curves and AUC values for all the learning at-
tributes, individually and collectively, are presented
in Fig. 3. The predicted order of the Markov chain,
for both EGs and NEGs, was 6. Here also, the en-
tropy features have produced the smallest values. The
average AUC of the classifier using all the features is
0.81. The Sn, Sp, and Ac, at a threshold of 0.5, are
0.88, 0.62, and 0.75, respectively.
3.3 Prediction of Essential Genes in B.
subtilis
According to DEG, B. subtilis has 271 essential and
3904 non-essential genes. A similar under-sampling
of the non-essential genes is carried out and 65 ran-
dom samplings were done. The ROC curves of the
five-fold cross-validation are presented in Fig. 4. In-
terestingly, the estimated order from essential genes
training set is 5 whereas for non-essential ones, the
order is 4. Therefore, each gene is scored by an order
4 Markov chain constructed from the NEG training
set and an order 5 Markov chain obtained from the
EG training set.
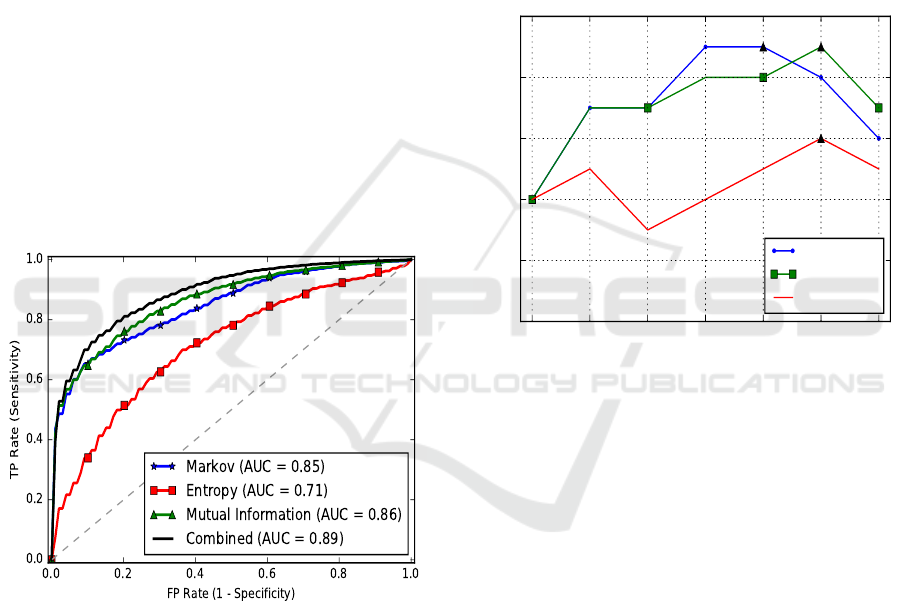
Figure 4: The average ROC curves of B. subtilis EG predic-
tion.
The average AUC of the classifier using all the
features is 0.89. The Sn, Sp, and Ac, at a threshold
of 0.5, are 0.83, 0.75, and 0.8, respectively.
To check if the estimated Markov order is indeed
better than the other orders, we have used features
from the scores of fixed Markov orders ranging from
1 to 7 and tested the performance of our classifier. A
linear SVM (C = 0.5) is applied on a balanced dataset
using a single sample. The AUC scores for the pre-
diction of essential genes in B. subtilis, E. coli, and M.
pulmonis are shown in Fig. 5. In E. coli, the estimated
order is 5 and the maximum AUC score was obtained
by using orders 4 and 5 (AUC = 0.84). In B. subtilis,
the estimated order is order 4 for non-essential genes
and order 5 for essential genes. The maximum AUC
score of 0.83 is observed for order 6. However, the
performance using the estimated orders is also 0.83.
This is a good example to show how the order esti-
mation finds the optimal performance, rather than a
random choice of an order. M. pulmonis has an esti-
mated order of 6 and it is with order 6 Markov chain
the maximum AUC is obtained (0.81). Therefore, this
shows that the estimated order achieves the best pos-
sible AUC score.
1 2 3 4 5 6 7
Markov order
0.74
0.76
0.78
0.80
0.82
0.84
AUC
E. coli
B. sub
M. pulmonis
Figure 5: The AUC scores of different Markov orders. The
black triangles indicate the maximum AUC score.
3.4 Cross-organism Predictions
3.4.1 Many to One Predictions
So far, the training and test datasets have been taken
from the same organism. However, a more interest-
ing and useful approach would be to predict essential
genes across, both closely and distantly related, or-
ganisms. This will enable the prediction of essential
genes in newly sequenced organisms without having
to do the tedious and time-consuming gene-knockout
experiments. To make a cross-organism prediction,
we have collected the essential and non-essential gene
data of 15 bacterial species from DEG. We have used
the same bacteria as in the study by Ning et al. for
comparison purposes. We have left out the bacteria
Streptoccus pneumoniae, since the NEG are not re-
ported in the DEG database. There are a total of 6078
EGs and 33475 NEGs in the pool. A five-fold cross-
validation was used to evaluate the performance of the
SVM classifier. 6078 NEGs are randomly selected to
Prediction of Essential Genes based on Machine Learning and Information Theoretic Features
87

Table 2: Cross-organism prediction performance. The EGs and NEGs of a given bacterium are predicted using a
model trained on the other 14 bacteria.
Organism #EG #NEG AUC Sn Sp Ac PPV
AB 499 2594 0.83 0.81 0.69 0.75 0.72
BS 271 3904 0.84 0.54 0.89 0.72 0.83
EC 296 4077 0.88 0.75 0.81 0.78 0.8
FN 392 1329 0.83 0.75 0.75 0.75 0.75
HI 642 512 0.77 0.82 0.63 0.73 0.74
HP 323 1135 0.74 0.93 0.5 0.72 0.65
MG 381 94 0.66 0.96 0.38 0.85 0.86
MP 310 322 0.74 0.96 0.4 0.68 0.61
MT 614 2552 0.77 0.72 0.69 0.7 0.7
PA 335 960 0.8 0.7 0.72 0.71 0.72
SA 302 2281 0.9 0.92 0.7 0.81 0.75
SA2 351 2541 0.85 0.82 0.7 0.76 0.73
SE 353 4005 0.86 0.54 0.92 0.73 0.87
ST 230 4228 0.79 0.47 0.9 0.68 0.83
VC 779 2943 0.72 0.61 0.62 0.62 0.62
Average 0.8 0.75 0.69 0.73 0.75
balance the datasets and the average AUC score of 10
random samplings was 0.79 using a linear SVM with
the hyperparameter C set at 0.5. However, a cross-
validation on the 6078 EGs is not practical in eval-
uating the performance of the classifier as we would
be interested in figuring out the EGs and NEGs of a
new organism, which is not in our pool of organisms.
Hence, we should assess the performance of the SVM
classifier by using a one against the rest strategy. That
is, one bacterium is reserved for testing whereas the
other 14 bacteria are used to train the model. Here
also, under-sampling of the NEGs is performed to
produce a balanced data set.
All of the information theoretic features, i.e., MI,
CMI, E, and M, are used. However, since there are a
total of more than 39,000 genes, the estimation of the
Markov order will be computational demanding. In
addition, since the training set will be a collection of
genes from multiple organisms, performing order es-
timation does not make sense. Therefore, we decided
to use two fixed order Markov chains, orders 2 and
5, to capture both short and long dependencies. After
examining the possible kernel functions (linear, rbf,
and polynomial) and hyperparameters using a random
grid-search, the rbf kernel with the default parameters
has produced the best performance. The results are
presented in Table 2. The Sn, Sp, Ac, and PPV val-
ues are decision threshold dependent and the reported
values are with a threshold of 0.5.
The AUC scores of the cross-organism prediction
were between 0.66 and 0.9. The average AUC score
was 0.8, which is a very good result considering the
fact that only primary sequence information was used
for the prediction of essentiality. The lowest perfor-
mance was the prediction of the mycoplasma geni-
talium (MG) essential genes. This could be due to
the small number of genes (only 98 NEGs) the bac-
terium has and this will make it difficult for the SVM
to yield correct classifications. It could also be associ-
ated with the quality of the data. EGs which are iden-
tified by transposon mutagenesis often contain sys-
tematic biases (Deng et al., 2011; Jacobs et al., 2003).
Transposon mutagenesis involves random transposon
insertions and the transposons mostly miss shorter
proteins leading to a bias towards labeling shorter
proteins as EGs. Furthermore, the prediction perfor-
mances are highly dependent on the evolutionary dis-
tance between the bacteria used for training and test-
ing. Fig. 6 shows the phylogenetic tree of the bacteria
used in this study, constructed using the freely avail-
able Interactive Tree Of Life (iTOL) v3 tool (Letunic
and Bork, 2016).
3.4.2 One-to-one Cross-organism Prediction
To further show the transferability of essential
gene annotations across closely and distantly related
species, we have selected two Gram-negative bacte-
ria (EC and AB) and the Gram-positive BS. Then,
we have done a one-to-one cross-organism predic-
tion among the three bacteria. The features used are
Markov chains of order 2 and 5, MI, CMI, and E.
BIOINFORMATICS 2017 - 8th International Conference on Bioinformatics Models, Methods and Algorithms
88
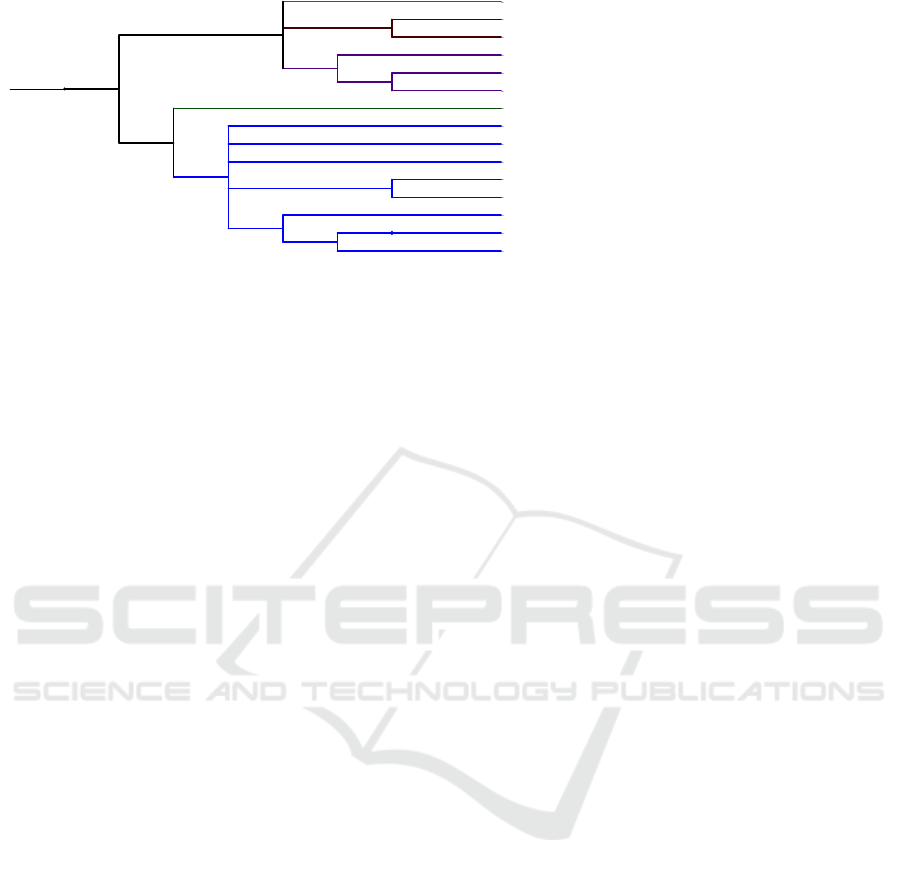
Mycobacterium tuberculosis H37Rv (MT)
Bacillus subtilis subsp. subtilis str. 168 (BS)
Mycoplasma genitalium G37 (MG)
Salmonella enterica subsp. enterica serovar Typhi (SE)
Helicobacter pylori 26695 (HP)
Mycoplasma pulmonis UAB CTIP (MP)
Francisella tularensis subsp. novicida U112 (FN)
Vibrio cholerae O1 biovar El Tor str. N16961 (VC)
Salmonella enterica subsp. enterica serovar Typhimurium str. SL1344 (SE2)
Haemophilus influenzae Rd KW20 (HI)
Staphylococcus aureus subsp. aureus NCTC 8325 (SA2)
Acinetobacter sp. ADP1 (AB)
Pseudomonas aeruginosa UCBPP-PA14 (PA)
Escherichia coli str. K-12 substr. MG1655 (EC)
Staphylococcus aureus subsp. aureus N315 (SA)
Figure 6: The phylogenetic relationship between the bacteria used in this study.
The hyperparameters leading to a high performance
are 0.4 for C and 0.005 for gamma (obtained by per-
forming a grid-search on the parameters). The AUC
scores of the cross-organism predictions are presented
in Table 3.
Despite having different lifestyles and very large
evolutionary distance (EC and BS diverged about a
billion years ago), it is remarkable that essential and
non-essential genes can be reciprocally transferred
with a fairly high accuracy using only primary se-
quence information.
3.5 Comparison with Other EG
Predictors
Our EG predictor uses information theoretic features
derived from primary sequence information only. The
essentiality of a gene however is a complex issue,
which not only depends on sequence composition and
organization but also on many other factors such as
metabolic relationships between proteins, evolution-
ary conservation, and gene expression. The essen-
tiality of a gene is also context dependent. A gene,
which is essential in one condition, might not be es-
sential in another conditions (Sassetti et al., 2001).
Hence, many researchers have tried to use gene ex-
pression, homology, and network topological infor-
mation along with sequence-based features for the
prediction of essential genes using various machine-
learning algorithms. The work of Ning et al. (Ning
et al., 2014), being the only purely primary sequence
information based predictor, can be directly compared
with our predictor. Although the other methods use
extra information, which is sometimes hard to get
for under-studied or newly discovered organisms, we
have also made a comparison of our results with se-
lected essential gene predictors.
Our results are overall slightly better than Ning et
al. (Ning et al., 2014). For E. coli, the five-fold cross
validation AUC score was 0.82, our method produced
an AUC score of 0.85. The AUC for the prediction of
M. pulmonis EGs is improved from 0.74 to 0.81. The
cross-validation results of the 16 bacterial species had
a 0.76 AUC score. Our method has also shown a com-
parable performance of 0.79. Tested on an indepen-
dent test set using a strain of Salmonella Typumurium
SL1344, their model resulted in AUC score of 0.81.
An independent test on all of the bacteria has pro-
duced AUC scores of up to 0.9 (on average 0.8). For
the same Salmonela strain the AUC scores is 0.8.
Deng et al. (Deng et al., 2011) have used thirteen
features. Along with the sequence dependent features
such as length of amino acids and effective number
of codons, they have used features related to network
topology, gene-expression, homology, phylogenetics,
and protein domain knowledge. A combination of
four machine-learning algorithms (Nave Bayes, lo-
gistic regression, C4.5 decision tree, and CN2 rule)
were applied. The other recent and more effective
method for EG prediction is ZUPLS (Song et al.,
2014). It uses Z-curve features together with other
sequence-based features including homology (orthol-
ogy and paralogy) and domain knowledge. They have
adopted the partial least squares classifier for classifi-
cation. The cross-organism prediction performances
among the bacteria EC, BS, and AB are presented in
the Table 4. In comparison, our method has a compa-
rable performance with the two methods. The average
values indicate that the ZUPLS method is slightly bet-
ter in AUC score. However, our method has the high-
est performance in terms of PPV scores. Considering
that we have used only primary sequence information,
the performance of our classifier is astonishing.
4 CONCLUSIONS
We designed a machine learning based gene essen-
tiality predictor and demonstrated the effective clas-
sification of essential and non-essential genes using
Prediction of Essential Genes based on Machine Learning and Information Theoretic Features
89

Table 3: AUC scores of essential gene prediction among AB, BS, and EC.
Train Test AUC Train Test AUC
AB BS 0.86 BS EC 0.84
AB EC 0.86 EC AB 0.84
BS AB 0.83 EC BS 0.86
Table 4: Prediction performance comparison of our method, Deng et al. (Deng et al., 2011), and ZUPLS (Song
et al., 2014).
Our method Deng et al. ZUPLS
Train Test AUC PPV AUC PPV AUC PPV
EC AB 0.84 0.85 0.8 0.81 0.86 0.79
EC BS 0.86 0.93 0.8 0.54 0.93 0.73
BS EC 0.84 0.73 0.86 0.48 0.91 0.64
AB EC 0.86 0.75 0.89 0.43 0.91 0.64
Average 0.85 0.82 0.84 0.57 0.9 0.7
information-theoretic features. The features are di-
rectly derived from only the DNA sequence. Other
computational methods depend on the availability of
experimental data, such as network of gene/protein
interactions, functional microarray gene expression,
and gene ontology annotations. However, these ex-
perimental data are mostly only available for well-
studied organisms and not for unstudied or newly se-
quenced organisms. In this regard, our method has
an advantage that it can be applied to any organ-
ism. The information-theoretic tools we used are en-
tropy, mutual information, conditional mutual infor-
mation, and Markov models. These procedures are
applied to the genomic sequences to reveal structural
and compositional properties that can highlight dif-
ferences between essential and non-essential genes.
Average AUC scores of more than 0.8 were obtained.
The AUC score for predicting EGs of E. coli, B. sub-
tilis, and M. pulmonis are 0.85, 0.81, and 0.89, respec-
tively. In cross-organism prediction, two approaches
where taken. The first is a many-to-one approach
where the EGs of a given bacteria are predicted us-
ing a model trained on multiple bacteria. The average
AUC score is 0.8. The other is a one-to-one predic-
tion between E. coli, Acinetobacter, and B. subtilis
and average AUC of 0.85 was obtained. The perfor-
mance of our predictor has been comparable to re-
cent and state-of-the art predictors. Considering that
we used only sequence information on a problem that
is much more complicated (essentiality is context de-
pendent and involves the interaction of multiple pro-
teins), the achieved results are very encouraging. In
this work, we have tested our method on prokaryotic
genomes and shown that EG annotations can be recip-
rocally transferred between both closely and distantly
related bacteria with a reasonable accuracy. In the fu-
ture, we will assess the applicability of our method in
other domains of life. To further improve the accu-
racy in the many-to-one predictions, instead of using
all species in the pool for training, a subset could be
selected based on certain criteria (e.g., sequence sim-
ilarity).
ACKNOWLEDGEMENTS
This work is funded by the German Research Foun-
dation (Deutsche Forschungsgemeinschaft, DFG).
REFERENCES
Acencio, M. L. and Lemke, N. (2009). Towards the pre-
diction of essential genes by integration of network
topology, cellular localization and biological process
information. BMC bioinformatics, 10(1):1.
Bauer, M., Schuster, S. M., and Sayood, K. (2008). The
average mutual information profile as a genomic sig-
nature. BMC bioinformatics, 9(1):1.
Ben-Hur, A. and Weston, J. (2010). A users guide to support
vector machines. Data mining techniques for the life
sciences, pages 223–239.
BIOINFORMATICS 2017 - 8th International Conference on Bioinformatics Models, Methods and Algorithms
90

Benson, D. A., Cavanaugh, M., Clark, K., Karsch-Mizrachi,
I., Lipman, D. J., Ostell, J., and Sayers, E. W. (2013).
Genbank. Nucleic acids research, 41(D1):D36–D42.
Chalker, A. F. and Lunsford, R. D. (2002). Rational iden-
tification of new antibacterial drug targets that are es-
sential for viability using a genomics-based approach.
Pharmacology & therapeutics, 95(1):1–20.
Chen, L., Ge, X., and Xu, P. (2015). Identifying essen-
tial streptococcus sanguinis genes using genome-wide
deletion mutation. Gene Essentiality: Methods and
Protocols, pages 15–23.
Chen, W.-H., Minguez, P., Lercher, M. J., and Bork, P.
(2012). OGEE: an online gene essentiality database.
Nucleic acids research, 40(D1):D901–D906.
Chen, Y. and Xu, D. (2005). Understanding protein dispens-
ability through machine-learning analysis of high-
throughput data. Bioinformatics, 21(5):575–581.
Cheng, J., Xu, Z., Wu, W., Zhao, L., Li, X., Liu, Y., and Tao,
S. (2014). Training set selection for the prediction of
essential genes. PloS one, 9(1):e86805.
Clarke, L. and Carbon, J. (1976). A colony bank containing
synthetic coi ei hybrid plasmids representative of the
entire e. coli genome. Cell, 9(1):91–99.
Cullen, L. M. and Arndt, G. M. (2005). Genome-
wide screening for gene function using RNAi in
mammalian cells. Immunology and cell biology,
83(3):217–223.
Dalevi, D. and Dubhashi, D. (2005). The peres-shields
order estimator for fixed and variable length markov
models with applications to DNA sequence similarity.
In International Workshop on Algorithms in Bioinfor-
matics, pages 291–302. Springer.
Date, S. V. and Marcotte, E. M. (2003). Discovery of un-
characterized cellular systems by genome-wide anal-
ysis of functional linkages. Nature biotechnology,
21(9):1055–1062.
Deng, J., Deng, L., Su, S., Zhang, M., Lin, X., Wei, L., Mi-
nai, A. A., Hassett, D. J., and Lu, L. J. (2011). Investi-
gating the predictability of essential genes across dis-
tantly related organisms using an integrative approach.
Nucleic acids research, 39(3):795–807.
Giaever, G., Chu, A. M., Ni, L., Connelly, C., Riles, L.,
Veronneau, S., Dow, S., Lucau-Danila, A., Ander-
son, K., Andre, B., et al. (2002). Functional profil-
ing of the saccharomyces cerevisiae genome. nature,
418(6896):387–391.
Hagenauer, J., Dawy, Z., Gobel, B., Hanus, P., and Mueller,
J. (2004). Genomic analysis using methods from in-
formation theory. In Information Theory Workshop,
2004. IEEE, pages 55–59. IEEE.
Hutchison, C. A., Chuang, R.-Y., Noskov, V. N., Assad-
Garcia, N., Deerinck, T. J., Ellisman, M. H., Gill, J.,
Kannan, K., Karas, B. J., Ma, L., et al. (2016). Design
and synthesis of a minimal bacterial genome. Science,
351(6280):aad6253.
Itaya, M. (1995). An estimation of minimal genome size
required for life. FEBS letters, 362(3):257–260.
Jacobs, M. A., Alwood, A., Thaipisuttikul, I., Spencer,
D., Haugen, E., Ernst, S., Will, O., Kaul, R., Ray-
mond, C., Levy, R., et al. (2003). Comprehensive
transposon mutant library of pseudomonas aerugi-
nosa. Proceedings of the National Academy of Sci-
ences, 100(24):14339–14344.
Katz, R. W. (1981). On some criteria for estimating the
order of a markov chain. Technometrics, 23(3):243–
249.
Lamichhane, G., Zignol, M., Blades, N. J., Geiman, D. E.,
Dougherty, A., Grosset, J., Broman, K. W., and
Bishai, W. R. (2003). A postgenomic method for pre-
dicting essential genes at subsaturation levels of mu-
tagenesis: application to mycobacterium tuberculo-
sis. Proceedings of the National Academy of Sciences,
100(12):7213–7218.
Letunic, I. and Bork, P. (2016). Interactive tree of life (itol)
v3: an online tool for the display and annotation of
phylogenetic and other trees. Nucleic acids research,
page gkw290.
Lu, Y., Deng, J., Rhodes, J. C., Lu, H., and Lu, L. J.
(2014). Predicting essential genes for identifying po-
tential drug targets in aspergillus fumigatus. Compu-
tational biology and chemistry, 50:29–40.
Luo, H., Lin, Y., Gao, F., Zhang, C.-T., and Zhang, R.
(2014). Deg 10, an update of the database of essen-
tial genes that includes both protein-coding genes and
noncoding genomic elements. Nucleic acids research,
42(D1):D574–D580.
Men
´
endez, M., Pardo, L., Pardo, M., and Zografos, K.
(2011). Testing the order of markov dependence in
DNA sequences. Methodology and computing in ap-
plied probability, 13(1):59–74.
Mushegian, A. R. and Koonin, E. V. (1996). A minimal
gene set for cellular life derived by comparison of
complete bacterial genomes. Proceedings of the Na-
tional Academy of Sciences, 93(19):10268–10273.
Nigatu, D., Henkel, W., Sobetzko, P., and Muskhelishvili,
G. (2016). Relationship between digital information
and thermodynamic stability in bacterial genomes.
EURASIP Journal on Bioinformatics and Systems Bi-
ology, 2016(1):1.
Nigatu, D., Mahmood, A., Henkel, W., Sobetzko, P., and
Muskhelishvili, G. (2014). Relating digital informa-
tion, thermodynamic stability, and classes of func-
tional genes in e. coli. In Signal and Information Pro-
cessing (GlobalSIP), 2014 IEEE Global Conference
on, pages 1338–1341. IEEE.
Ning, L., Lin, H., Ding, H., Huang, J., Rao, N., and Guo, F.
(2014). Predicting bacterial essential genes using only
sequence composition information. Genet. Mol. Res,
13:4564–4572.
Papapetrou, M. and Kugiumtzis, D. (2013). Markov chain
order estimation with conditional mutual information.
Physica A: Statistical Mechanics and its Applications,
392(7):1593–1601.
Papapetrou, M. and Kugiumtzis, D. (2016). Markov chain
order estimation with parametric significance tests of
conditional mutual information. Simulation Mod-
elling Practice and Theory, 61:1–13.
Pedregosa, F., Varoquaux, G., Gramfort, A., Michel, V.,
Thirion, B., Grisel, O., Blondel, M., Prettenhofer,
P., Weiss, R., Dubourg, V., Vanderplas, J., Passos,
A., Cournapeau, D., Brucher, M., Perrot, M., and
Prediction of Essential Genes based on Machine Learning and Information Theoretic Features
91

Duchesnay, E. (2011). Scikit-learn: Machine learning
in Python. Journal of Machine Learning Research,
12:2825–2830.
Peres, Y. and Shields, P. (2005). Two new Markov order
estimators. ArXiv Mathematics e-prints.
Plaimas, K., Eils, R., and K
¨
onig, R. (2010). Identifying es-
sential genes in bacterial metabolic networks with ma-
chine learning methods. BMC systems biology, 4(1):1.
Provost, F. (2000). Machine learning from imbalanced data
sets 101. In Proceedings of the AAAI2000 workshop
on imbalanced data sets, pages 1–3.
Salama, N. R., Shepherd, B., and Falkow, S. (2004). Global
transposon mutagenesis and essential gene analy-
sis of helicobacter pylori. Journal of bacteriology,
186(23):7926–7935.
SantaLucia, J. (1998). A unified view of polymer, dumbbell,
and oligonucleotide DNA nearest-neighbor thermody-
namics. Proc. Natl. Acad. Sci., 95(4):1460–1465.
Sassetti, C. M., Boyd, D. H., and Rubin, E. J. (2001).
Comprehensive identification of conditionally essen-
tial genes in mycobacteria. Proceedings of the Na-
tional Academy of Sciences, 98(22):12712–12717.
Sharp, P. M. and Li, W.-H. (1987). The codon adaptation
index-a measure of directional synonymous codon us-
age bias, and its potential applications. Nucleic acids
research, 15(3):1281–1295.
Song, K., Tong, T., and Wu, F. (2014). Predicting essential
genes in prokaryotic genomes using a linear method:
Zupls. Integrative Biology, 6(4):460–469.
Tong, H. (1975). Determination of the order of a markov
chain by akaike’s information criterion. Journal of
Applied Probability, pages 488–497.
Visa, S. and Ralescu, A. (2005). Issues in mining imbal-
anced data sets-a review paper. In Proceedings of
the sixteen midwest artificial intelligence and cogni-
tive science conference, volume 2005, pages 67–73.
sn.
Ye, Y.-N., Hua, Z.-G., Huang, J., Rao, N., and Guo, F.-B.
(2013). CEG: a database of essential gene clusters.
BMC genomics, 14(1):1.
Zhang, X., Acencio, M. L., and Lemke, N. (2016). Pre-
dicting essential genes and proteins based on machine
learning and network topological features: a compre-
hensive review. Frontiers in physiology, 7.
BIOINFORMATICS 2017 - 8th International Conference on Bioinformatics Models, Methods and Algorithms
92
