
An Agent Trading on Behalf of V2G Drivers in a Day-ahead Price
Market
Ibrahem A. Almansour, Enrico H. Gerding and Gary Wills
Electronics and Computer Science, University of Southampton, U.K.
Keywords:
V2G, Driving Behaviour, Price Uncertainty.
Abstract:
Due to the limited availability of fuel resources, there is an urgent need for converting to use renewable sources
efficiently. To achieve this, power consumers should participate actively in power production and consumption.
Consumers nowadays can produce power and consume a portion of it locally, and then could offer the rest
of the power to the grid. Vehicle-to-grid (V2G) which is one of the most effective sustainable solutions,
could provide these opportunities. V2G can be defined as a situation where electric vehicles (EVs) offer
electric power to the grid when parked. We developed an agent to trade on behalf of V2G users to maximize
their profits in a day-ahead price market. We then ran the proposed model in three different scenarios using
an optimal algorithm and compared the results of our solution to a benchmark. We show that our solution
outperforms the benchmark strategy in the proposed three scenarios 49%, 51%, and 10% respectively in terms
of profit.
1 INTRODUCTION
One of the most effective sustainable solutions is that
of electric vehicles(EVs), because of their power stor-
age capability. They could use solar and wind power
and significantly decrease the amount of power that
are utilized for transportation because they are more
effective than internal combustion vehicles. More-
over, EV batteries could offset the volatility of wind
and solar production when they are plugged into the
grid. Vehicle-to-grid (V2G) has the potential to fur-
ther encourage consumers to change their vehicles
from fuel vehicles to EVs. This is due to its ability to
reduce the power cost, if used effectively. V2G can be
defined as an approach whereby an EV offers electric
power to the grid when parked. (Kempton and Tomi´c,
2005) found that, most cars are not used 90% of the
time, so EVs can be used to provide power storage
and supplementary services to the smart grid during
this period when they not being used. Therefore, V2G
could be used to provide extra money. For example,
it is expected that, if an EV owners contribute in V2G
systems, they could take around (2500 to 3000) U.S.
dollars yearly (Tomas, 2013). Moreover, (Li et al.,
2015) found that the majority of V2G studies are dis-
cussed from the perspective of the power grid. In con-
trast, here we take the consumer’s perspective.
In this research there are a large number of diverse
actors with individual behaviours and incentives that
need to be considered such as the different power mar-
kets and V2G drivers’ behaviours. Thus, according to
Siegfried et al. (2009), an agent-based model might
be the first choice to model the problem. Therefore,
our research models an agent to trade on behalf of
V2G in terms of maximising their profit of using V2G
as a source of electricity with consideration to their
behaviours and their incentives.
The rest of the paper is organised as follows. The
related work will be discussed in Section 2. After-
ward, the proposed model will be described in Section
3. Then, Section 4 discusses the design of the optimi-
sation module. Next, the experimental evaluation will
be considered in section 5. Finally, the conclusion of
our study will be discussed in section 6.
2 RELATED WORK
V2G could be used to support the smart grid (Tomi´c
and Kempton, 2007), (Saber and Venayagamoorthy,
2011) and (White and Zhang, 2011). This offers V2G
drivers an opportunity to cut their power costs and re-
ceive money. To do so, they should have a clear un-
derstanding about how to deal with the power market.
However, there is a lack of knowledge among con-
sumers about how to deal with time varying prices in
Almansour, I., Gerding, E. and Wills, G.
An Agent Trading on Behalf of V2G Drivers in a Day-ahead Price Market.
DOI: 10.5220/0006156201350141
In Proceedings of the 3rd International Conference on Vehicle Technology and Intelligent Transport Systems (VEHITS 2017), pages 135-141
ISBN: 978-989-758-242-4
Copyright © 2017 by SCITEPRESS – Science and Technology Publications, Lda. All rights reserved
135
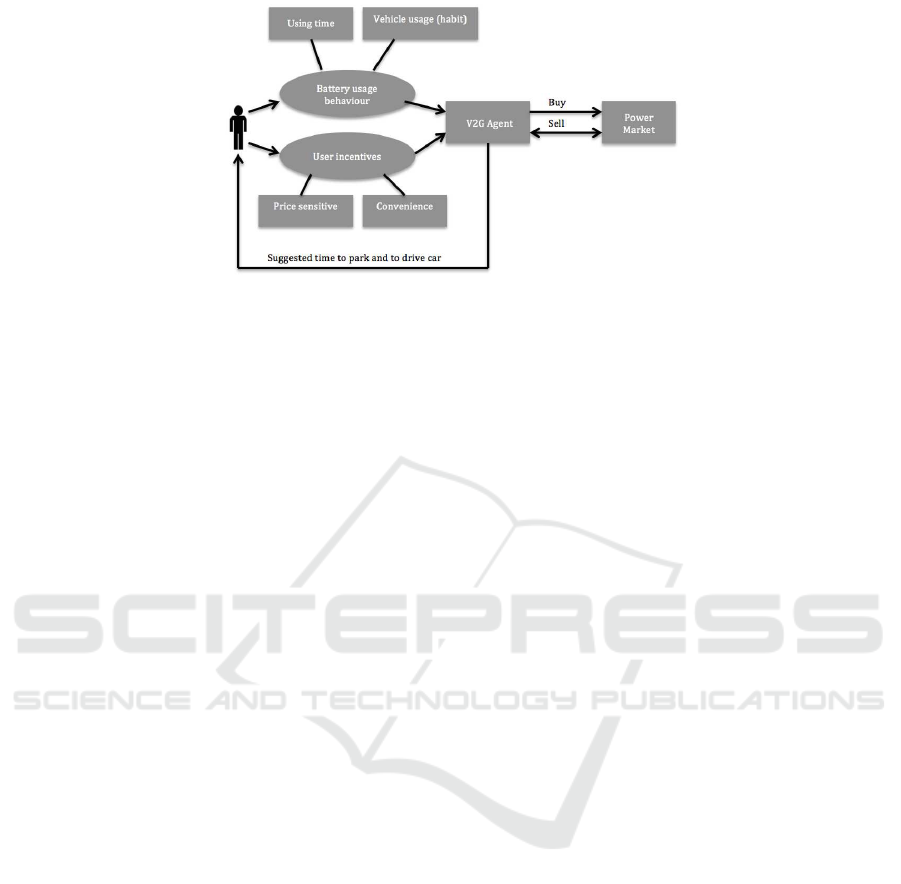
Figure 1: Picture showing our proposed model.
the power market (Mohsenian-Rad and Leon-Garcia,
2010) and (Han et al., 2010). To fix that, (O’Neill
et al., 2010) study the price uncertainty problem used
reinforcement learning in the residential demand re-
sponse algorithm. In the same vein, (Conejo et al.,
2010) developed a real-time demand response algo-
rithm applied to a daily 24-hour horizon and used ro-
bust optimization to consider the price uncertainty in
their model (Conejo et al., 2010) and (O’Neill et al.,
2010) dealt with the real-time demand response prob-
lem. However, (Shi and Wong, 2011) discuss the
same issue in the context of V2G control.
V2G problems are more complicated if price un-
certainty is considered, as the price of electricity is de-
cided each hour, dynamically. (Shi and Wong, 2011)
discussed the real- time V2G control problem con-
sidering price uncertainty. Similar to (Shi and Wong,
2011), we study price uncertainty in the context of
V2G, but our study differs from theirs in that, Our al-
gorithm is more scalable, thus it could be used when
we consider the battery usage behavior as we plan for
our future work. Though, they applied Q-learning,
which does not work effectively when considering the
battery usage behavior as we concluded from (Guo
et al., 2004)
In contrast to the aforementioned studies, (Ghias-
nezhad Omran and Filizadeh, 2014), (Sanchez-Martin
et al., 2015),(Valogianniet al., 2014), (Gonzalez Vaya
and Andersson, 2013), and (Halvgaard et al., 2012)
studies will be used as references of our model when
we are going to model the driving behaviour in our
future work. In details, (Ghiasnezhad Omran and Fil-
izadeh, 2014) propose a procedure for location-based
prediction of the possible vehicular charging load at
charging stations. In order to emulate drivers’ charg-
ing behaviour they apply fuzzy decision-making sys-
tems. In a related vein, (Sanchez-Martin et al., 2015)
argue that applying stochastic behaviour to manage
EV charging points is more realistic and develop
a stochastic programming model to achieve optimal
management, taking into account price variations in
day-ahead price markets. Along the same line, (Halv-
gaard et al., 2012) use Economic Model Predictive
Control as a technique to reduce the cost of electricity
consumption for a single EV. Likewise, (Valogianni
et al., 2014) propose an algorithm termed Adaptive
Management of EV Storage, which is applied by a
learning agent that acts on behalf of individual EV
users and schedules EV charging over a weekly hori-
zon. They used reinforcement learning to learn user
consumption behaviour and schedule charging with
the objectives of maximizing user benefit. The key
difference between our work and the aforementioned
studies is that they have not considered the V2G issue
but we have.
Specifically in V2G, a number of algorithms are
proposed to deal with different types of uncertain-
ties in V2G amid uncertainty in the production of re-
newable power (Pinson et al., 2009) (Panagopoulos
et al., 2012), together with that of EV driving be-
haviour (Ghiasnezhad Omran and Filizadeh, 2014)
(Shahidinejad et al., 2012). Moreover, several stud-
ies discuss uncertainty in power market prices, for
instance the work by (Shi and Wong, 2011). Fi-
nally, (Zareen et al., 2015) note that when the V2G
drivers charge or discharge their vehicles optimally in
the deregulated market, they not only maximize their
profit but support the provision of regulation services
in emergencies. This claim could be used to highlight
the importance of our research.
3 THE MODEL
This section describes the model proposed to solve
the research problem. After that, the problem of price
uncertainty in the context of V2G is discussed.
VEHITS 2017 - 3rd International Conference on Vehicle Technology and Intelligent Transport Systems
136

3.1 Model Overview
In order to design our agent, a model has been pro-
posed as shown in Figure 1. In this model there
are two components that receive input from the V2G
driver, battery usage behaviour and user incentives.
Two factors will be considered to shape battery usage
behaviour: time, and vehicle usage (habit). In more
detail, V2G drivers determine the times when they
need to drive their car and when they can park their
car. one driving times are given, parking times can be
identified, which can be used to sell and buy the elec-
tricity. The second factor considered is vehicle usage
(habit). In this study, vehicle usage is defined as the
daily driving distance and the average speed.
The data on battery usage behaviour and user in-
centives will be sent to the V2G agent, which is a ma-
jor component of this model, and it will use this infor-
mation to trade with the power market. Specifically,
this agent will buy and sell electricity from and to the
power market, trying to calculate the best time to buy
and sell by predicting price behaviour. In doing so, it
will maximize the V2G drivers’ utility, which is the
monetary profit and the level of battery power that is
returned to the V2G driver at the end of a day. There is
a further important component in this model, namely
the power market, which models the real power mar-
ket. There are a number of factors that should be con-
sidered in designing such a market, such as the real
time pricing market.
The model shown in Figure 1 is of a simple mar-
ket, and is used to both understand the problem com-
prehensively and to design the model precisely. One
of the user incentives to be considered is price sensi-
tive. Furthermore, only a single type of power mar-
ket has been considered, namely the day-ahead price
(DAP) market. We chose the DAP market because
it is more practical to the people to plan for the fol-
lowing day power market price. In the DAP mar-
ket, quotes for day-ahead delivery of electricity are
offered together for every hour of the following day.
The information set to be used for quoting might not
be the same for every hour. Here, the V2G agent fo-
cuses on the power market side and in future work,
the driving behaviour and the user incentives will be
considered.
3.2 Problem Formulation
In more detail, the proposed model will incorporate
V2G driver behaviour, which has been defined in this
study as usage time. Moreover, it will employ elec-
tricity prices for the next day, since we consider only
the day ahead price market. By using these two types
of information the model will maximize the V2G
driver utility function by deciding the the best action
for every hour of the day, apart from the usage time
allocated to users to drive their cars. The utility has
been defined here as the monetary profit and the level
of battery power that is returned to the V2G driver at
the end of a day. Table 1 has been used to explain the
notations in details.
Table 1: Overview of the main notations used.
notation Description
a The vector which contains the chosen
action for each hour
a
t
= 0 Do nothing
a
t
= 1 Charging
a
t
= -1 Discharging
B State of charge
b
des
Desired amount of battery level be-
fore using time
b
init
Initial value for the battery
n Total of hours day
p
t
electricity price at time t
T Number of time steps and can be de-
fined as a T = {1, 2, ..., n}
T
su
Start of using time
T
eu
End time of using
T
a
Available time which the agent can
charging or discharging or do nothing
V(x) Function represent the battery of
charge which left for the driver at the
end of the day
Before representing it mathematically, based on
the Table 1, the notations of our model will be dis-
cussed. We will explain using an example. Let us
assume a driver wants to use his or her car from time
T
su
until time T
eu
, that will be considered as saying
to the agent that during this period of time it cannot
do anything represented in Equation 7. By exclud-
ing this usage time, the agent can define the period of
time during which it could charge a
t
= 1, discharge
a
t
= -1, or do nothing a
t
= 0, as represented in Equa-
tion 4. Agent will charge (buy) or discharge (sell)
from or to the market by considering the hour price
p. Moreover, let us assume the driver plans to go to
another city and he or she has an initial amount of bat-
tery at the start of the day of b
init
, and needs to have
a certain amount of battery b
des
to achieve this goal
without any delay; this issue has been determined by
Equation 8. At the end of the day the remaining bat-
tery state of charge has been represented as a func-
tion V(x), where is x ∈ B. Furthermore, we define the
utility as the monetary profit and the level of battery
power that is returned to the V2G driver at the end
An Agent Trading on Behalf of V2G Drivers in a Day-ahead Price Market
137

of a day. Finally, the utility function can be defined
as Equation 2, if conditions are satisfied, otherwise
U (
a) = −∞. After describing the notations, the prob-
lem will be mathematically represented as follows:
U
opt
= max
a∈
−1,0,1
T
U (
a) (1)
where
U (
a) = −
T
∑
t=1
p
t
(a
t
) +V
b
init
+
T
∑
t=1
a
t
!
(2)
Subject to
T =
1, 2, 3, ..., n
(3)
a ∈
− 1, 0, 1
(4)
T
eu
, T
su
∈ T (5)
b
init
, b
des
∈ B (6)
a = 0 ∀ T
su
≤ t ≤ T
eu
(7)
b
init
+
T
su
∑
t=1
(a
t
) ≥ b
des
(8)
T
a
= (T − (T
eu
− T
su
)) (9)
∀t ∈ T : B = 0 ≤ b
init
+
T
∑
t=1
a
t
≤ 100 (10)
After representing the problem mathematically,
the main constraints will be explained. To ensure that
the car is available in the using time from T
su
until
time T
eu
to the driver, we proposed this constraint in
Equation 7 which says to the agent during this period
that it cannot do anything. Moreover, to ensure that
the drivers will have their desired amount of battery
before their trip, we proposed this constraint in Equa-
tion 8. Further, to ensure the battery value does not
exceed its scope which is between 0 and 100 and to
calculates the battery amount after each step we pro-
posed constraint in Equation 10.
4 THE OPTIMIZATION MODULE
After formulating the problem in the previous section,
the design of this optimization module is discussed in
detail in this section.
To build an optimization module to maximize
the V2G driver utility function in day-ahead mar-
ket (DAP), discrete dynamic programming was used,
specifically backward induction. This is one of the
key approaches in mathematical optimization tech-
niques (Adda and Cooper, 2003). The backward in-
duction concept may be defined as the process of rea-
soning backwards in time, starting from the end of a
problem, selecting a series of optimal actions. Start-
ing with the last time point and deciding on the best
action, it continues backwards to the first time point,
at every step choosing the best action for each possi-
ble situation (Gibbons, 1992).
To apply the backward induction algorithm, the
study by (Fackler, 2004) was used. The authors claim
that, at discrete times or discrete states, there is a
Markova decision structure. An agent observes the
economics of the feasible state, B, in each point of
time, t, then chooses an action, a. In the present study,
the state space can be used to represent the battery
level, B. It can be represented mathematically as
B = { 0, 10, 20, ..., 100} (11)
The action, a, has three values: charging, discharging,
and doing nothing. The actions to be chosen depend
on the battery value. For instance, if it is 0, the agent
has just two actions: charging or doing nothing.
This section discusses the optimization module,
which is the main goal of this work and the next sec-
tion outlines the experimental evaluation.
5 EXPERIMENTAL EVALUATION
The experimental settings will be explained in this
section. Next, we will show the simulation results
using the benchmark strategy. After that, the exper-
imental scenarios will be discussed. Finally, we will
discuss the results.
5.1 Experimental Settings
The experimental settings are as follows:
• An unlimited budget;
• The price depends on the available supply;
• Only a single agent is considered;
• The pricing strategy is a fixed price;
• We assume different price distributions, depend-
ing on time, and these are given by Table 2. This
assumption is used to test the model but it can
deal with any price distributions. For each period,
the prices are generated as an integer number that
ranged between start and the end for each period
selected with equal probability.
VEHITS 2017 - 3rd International Conference on Vehicle Technology and Intelligent Transport Systems
138

Figure 2: Bar charts of proposed scenarios with our solution.
Table 2: Assumptions for prices of electricity, based on
time.
Time (hours) Price (pounds)
1:00 - 8:59 1 - 6
9:00 - 17:59 40 - 60
18:00 - 23:59 7 - 27
Moreover, to evaluate our model, we ran it in dif-
ferent scenarios with our solution; after that, we ran
these scenarios with a benchmark strategy, will be ex-
plained in section 5.1.1. Finally, we compared our
solution results and those of a benchmark strategy. In
more detail, the comparison between these two algo-
rithms was divided into two stages. First, we ran the
simulation once per scenario with each algorithm to
show what happens at each run. Second, the simula-
tion was run a hundred times to obtain definite results.
5.1.1 Benchmark Strategy
Before discussing the results, the benchmark strategy
algorithm used to compare the model to evaluate our
solution will be explained. It starts at the first avail-
able hour of the day, chooses its action by maximizing
the utility for each next step, compares the utility for
each choice, and selects the highest until reaching the
last available hour of the day.
5.1.2 Experimental Scenarios
Since our simulation has been assumed to work for
a single period per day, three people who drive their
cars at different periods of time are used to illustrate
scenarios to test this proposed optimization module.
All of these scenarios are uniformly distributed.
The first scenario is of people who work normal
hours; we assume they start driving their car at any
hour of the period from 7:00 to 12:59.
The second scenario is of people who work
evenings: we assume that they use their car at any
hour of the period from 13:00 to 18:59.
The third scenario is of people who start work
early in the morning. We assume they start to drive
at any hour of the period from 1:00 to 6:59.
After discussing the experimental evaluation, the
next section discusses the results of running the sim-
ulation.
5.2 Results
We first ran the simulation once per scenario with
each algorithm. We started by running our proposed
algorithm. Table 3 and Figure 2 show the results of
simulation runs.
Table 3: Summary table of proposed scenarios with our so-
lution.
Scenario T
su
T
eu
b
d
utility
First 9 13 >= 40 104
Second 18 22 >= 50 43
Third 6 12 >= 40 116
Moreover, to evaluate the performance of our so-
lution, we compared it with that achieved by using
a benchmark strategy algorithm. The crucial differ-
ence between our solution and the benchmark strat-
egy, which explained in 5.1.1, is that the latter has no
information about the last point price. Thus, it will
trade to maximize the profit for each feasible point,
while satisfying model constraints. Table 4 and Fig-
ure 3 provide the results of proposed scenarios after
applying a benchmark strategy.
Table 4: Summary table of proposed scenarios with bench-
mark strategy.
Scenario T
su
T
eu
b
d
utility
First 9 13 >= 40 31
Second 18 22 >= 50 22
Third 6 12 >= 40 89
As shown in the results, the agent does not do any-
thing in the using time. Moreover, it is charging the
battery with the desired amount before the using time.
Furthermore, it is charging and discharging (buying
An Agent Trading on Behalf of V2G Drivers in a Day-ahead Price Market
139
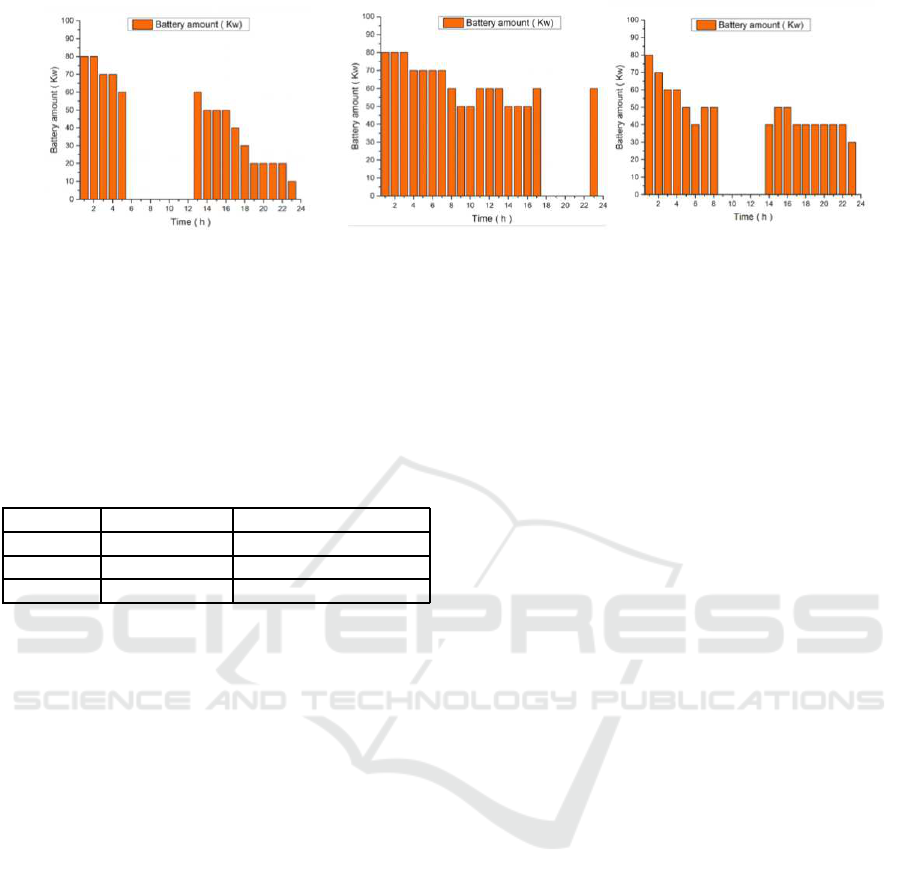
Figure 3: Bar charts of proposed scenarios with benchmark strategy.
and selling) based on the changing on the price. Fi-
nally, to build robust results, we ran this simulation a
hundred times for each algorithm per scenario, then
the average of each scenario was calculated in terms
of finding which algorithm is better. Table 5 provides
the average results after running the simulation a hun-
dred times.
Table 5: The average utility results after running the simu-
lation 100 times.
Scenario Our solution Benchmark strategy
First 97 50
Second 79 39
Third 152 137
Through undertaking this comparison with the
first scenario, our solution outperformed benchmark
strategy in 49%. Moreover, in the second scenario it
outperformed the benchmark strategy in 51%, while
in the third scenario our solution outperformed the
benchmark strategy in 10%.
6 CONCLUSIONS AND FUTURE
WORK
This study discussed the problem of the lack of
knowledge among customers about how to react to
prices varying in time in the power market, specifi-
cally the V2G driver. Against this background, this
study focused on modelling an initial agent to trade
on behalf of V2G drivers in order to maximize their
profits, specifically in the DAP market. A backward
induction algorithm was used to attain this aim. Three
reasonable scenarios were proposed to test this so-
lution, and were run under a benchmark algorithm.
The results of the proposed simulation were compared
with that of the benchmark algorithm. The results
show that our solution was better at maximizing the
V2G driver profits in DAP and so it can represent a
baseline for future development.
For future work, driving behaviour will be mod-
elled in order to improve the proposed model through
using real data. Furthermore, the battery degradation
will be considered. Moreover, to make the proposed
model more realistic, a dynamic price market will be
considered. This task will be divided into two sub-
tasks. First, the real price market will be modelled to
behave as a market by means of using real data from
one of the European power markets. Second, the opti-
mization module that has been modelled in the current
research will be refined to deal with dynamic prices.
REFERENCES
Adda, J. and Cooper, R. W. (2003). Dynamic economics:
quantitative methods and applications. MIT press.
Conejo, A. J., Morales, J. M., and Baringo, L. (2010).
Real-time demand response model. Smart Grid, IEEE
Transactions on, 1(3):236–242.
Fackler, P. L. (2004). Applied computational economics and
finance. MIT press.
Ghiasnezhad Omran, N. and Filizadeh, S. (2014). Location-
based forecasting of vehicular charging load on the
distribution system. Smart Grid, IEEE Transactions
on, 5(2):632–641.
Gibbons, R. (1992). Game theory for applied economists.
Princeton University Press.
Gonzalez Vaya, M. and Andersson, G. (2013). Optimal bid-
ding strategy of a plug-in electric vehicle aggregator
in day-ahead electricity markets. In European Energy
Market (EEM), 2013 10th International Conference
on the, pages 1–6. IEEE.
Guo, M., Liu, Y., and Malec, J. (2004). A new q-learning
algorithm based on the metropolis criterion. IEEE
Transactions on Systems, Man, and Cybernetics, Part
B (Cybernetics), 34(5):2140–2143.
Halvgaard, R., Poulsen, N. K., Madsen, H., Jorgensen, J.,
Marra, F., and Bondy, D. E. M. (2012). Electric vehi-
cle charge planning using economic model predictive
control. In Electric Vehicle Conference (IEVC), 2012
IEEE International, pages 1–6. IEEE.
Han, S., Han, S. H., and Sezaki, K. (2010). Design of an
optimal aggregator for vehicle-to-grid regulation ser-
vice. In Innovative Smart Grid Technologies (ISGT),
2010, pages 1–8. IEEE.
VEHITS 2017 - 3rd International Conference on Vehicle Technology and Intelligent Transport Systems
140

Kempton, W. and Tomi´c, J. (2005). Vehicle-to-grid power
fundamentals: calculating capacity and net revenue.
Journal of power sources, 144(1):268–279.
Li, Z., Chowdhury, M., Bhavsar, P., and He, Y. (2015). Op-
timizing the performance of vehicle-to-grid (v2g) en-
abled battery electric vehicles through a smart charge
scheduling model. International Journal of Automo-
tive Technology, 16(5):827–837.
Mohsenian-Rad, A.-H. and Leon-Garcia, A. (2010). Op-
timal residential load control with price prediction
in real-time electricity pricing environments. Smart
Grid, IEEE Transactions on, 1(2):120–133.
O’Neill, D., Levorato, M., Goldsmith, A., and Mitra,
U. (2010). Residential demand response using re-
inforcement learning. In Smart Grid Communica-
tions (SmartGridComm), 2010 First IEEE Interna-
tional Conference on, pages 409–414. IEEE.
Panagopoulos, A. A., Chalkiadakis, G., and Koutroulis, E.
(2012). Predicting the power output of distributed re-
newable energy resources within a broad geographical
region.
Pinson, P., Papaefthymiou, G., Klockl, B., Nielsen, H. A.,
and Madsen, H. (2009). From probabilistic forecasts
to statistical scenarios of short-term wind power pro-
duction. Wind energy, 12(1):51–62.
Saber, A. Y. and Venayagamoorthy, G. K. (2011). Plug-in
vehicles and renewable energy sources for cost and
emission reductions. Industrial Electronics, IEEE
Transactions on, 58(4):1229–1238.
Sanchez-Martin, P., Lumbreras, S., and Alberdi-Alen, A.
(2015). Stochastic programming applied to ev charg-
ing points for energy and reserve service markets.
Power Systems, IEEE Transactions on, pages 198 –
205.
Shahidinejad, S., Filizadeh, S., and Bibeau, E. (2012). Pro-
file of charging load on the grid due to plug-in vehi-
cles. Smart Grid, IEEE Transactions on, 3(1):135–
141.
Shi, W. and Wong, V. W. (2011). Real-time vehicle-to-grid
control algorithm under price uncertainty. In Smart
Grid Communications (SmartGridComm), 2011 IEEE
International Conference on, pages 261–266. IEEE.
Tomas, M. (2013). European union energy policy inte-
gration: A case of european commission policy en-
trepreneurship and increasing supranationalism. En-
ergy policy, 55:435–444.
Tomi´c, J. and Kempton, W. (2007). Using fleets of electric-
drive vehicles for grid support. Journal of Power
Sources, 168(2):459–468.
Valogianni, K., Ketter, W., Collins, J., and Zhdanov, D.
(2014). Effective Management of Electric Vehicle
Storage using Smart Charging.
White, C. D. and Zhang, K. M. (2011). Using vehicle-
to-grid technology for frequency regulation and
peak-load reduction. Journal of Power Sources,
196(8):3972–3980.
Zareen, N., Mustafa, M., AbuJarad, S. Y., and Moradi,
M. (2015). Optimal strategies modeling in electric-
ity market for electric vehicles integration in presence
of intermittent resources. Arabian Journal for Science
and Engineering, 40(6):1607–1621.
An Agent Trading on Behalf of V2G Drivers in a Day-ahead Price Market
141
