
Application of LSD-SLAM for Visualization Temperature in Wide-area
Environment
Masahiro Yamaguchi
1
, Hideo Saito
1
and Shoji Yachida
2
1
Graduate School of Science and Technology, Keio University, 3-14-1 Hiyoshi Kohoku-ku, Yokohama, Kanagawa, Japan
2
NEC Corporation, 1753 Shimonumabe Nakahara-ku, Kawasaki, Kanagawa, Japan
{yamaguchi, saito}@hvrl.ics.keio.ac.jp, s-yachida@bk.jp.nec.com
Keywords:
Thermal Camera, SLAM, RGB Camera.
Abstract:
In this paper, we propose a method to generate a three-dimensional (3D) thermal map by overlaying thermal
images onto a 3D surface reconstructed by a monocular RGB camera. In this method, we capture the target
scene moving both an RGB camera and a thermal camera, which are mounted on the same zig. From the
RGB image sequence, we reconstruct 3D structures of the scene by using Large-Scale Direct Monocular
Simultaneous Localization and Mapping (LSD-SLAM), on which temperature distribution captured by the
thermal camera is overlaid, thus generate a 3D thermal map. The geometrical relationship between those
cameras is calibrated beforehand by using a calibration board that can be detected by both cameras. Since we
do not use depth cameras such as Kinect, the depth of the target scene is not limited by the measurement range
of the depth camera; any depth range can be captured. To demonstrating this technique, we show synthesized
3D thermal maps for both indoor and outdoor scenes.
1 INTRODUCTION
Thermal cameras can be used to detect a gas leaks,
fires, abnormalities in electronic apparatus and so on,
many of which cannot be detected with visible light.
However, thermal camera have some restrictions. For
example, the angle of a thermal camera is narrower
than the angle of RGB cameras because of the ma-
terial composing the thermal camera lens. Obtain-
ing thermal images with a wide area requires multiple
fixed thermal cameras or moving the thermal camera.
However, it is difficult to extract local feature points
from thermal images, so we develop a method of ob-
taining wide-range thermal images by using a method
like image stitching. It is also difficult to recognize
the shapes of three-dimensional (3D) structures if we
only use thermal images. For instance, we cannot un-
derstand where the thermal image is taken when we
acquire a thermal image of large machines from a
close distance or of a line of similar objects. Thus, in
related works, other cameras are used in conjunction
with thermal cameras to compensate for the short-
comings of thermal cameras, allowing us to more eas-
ily understand the acquired thermal information. Us-
ing RGB-D cameras is one of those methods. Ther-
mal information is superimposed on a 3D structure in
that method. Matsumoto makes an augmented real-
ity (AR) application system that can be visualized the
thermal distribution on the environment (Matsumoto
et al., 2015). They use kinect for RGB-D camera and
thermal camera. In the off-line phase, they can ob-
tain a 3D model of the environment, and in the on-
line phase, they track the camera in order to observe
the thermal map for a wide area from any viewpoint.
However, it is difficult to obtain depth value in out-
door environment because sunlight affects the depth
sensor and objects are often too far away to get depth
value.
In this paper, we propose a method to visualize
thermal information as a 3D structure and superim-
pose thermal information on arbitrary RGB images.
Using a low cost depth sensor would prevent us from
experimenting in outdoor environment, so we use a
monocular RGB camera and a thermal camera in our
works. We create 3D models of the environment with
thermal information to superimpose thermal informa-
tion on arbitrary RGB images. The 3D model is made
by Simultaneous Localization and Mapping (SLAM),
which is one of the methods to reconstruct an environ-
ment as a 3D point cloud. We can track camera po-
sitions and reconstruct 3D points simultaneously with
only a monocular RGB camera by using SLAM. We
add thermal information to the 3D points cloud recon-
structed by SLAM. After that, we project the point
216
Yamaguchi M., Saito H. and Yachida S.
Application of LSD-SLAM for Visualization Temperature in Wide-area Environment.
DOI: 10.5220/0006153402160223
In Proceedings of the 12th International Joint Conference on Computer Vision, Imaging and Computer Graphics Theory and Applications (VISIGRAPP 2017), pages 216-223
ISBN: 978-989-758-225-7
Copyright
c
2017 by SCITEPRESS – Science and Technology Publications, Lda. All rights reserved
cloud onto arbitrary RGB images and create a mesh
by Delaunay division. As a result, our system can be
used to image both indoor and outdoor scenes because
we use a monocular RGB camera.
This paper is structured as follow. In Section 2,
we discuss related works. We provide details of our
proposed system in Section 3 and show the results of
our experiment in Section 4. Finally, we describe our
conclusions and suggest directions for future work in
Section 5.
2 RELATED WORKS
Our goal is to visualize temperature of the environ-
ment as a 3D structure by using a monocular RGB
camera. However, most works use RGB-D camera to
achieve similar visualization. Thus, we discuss such
methods as related works. We then introduce some
SLAM methods to reconstruct 3D point clouds by us-
ing a monocular RGB camera.
2.1 Making a Thermal Map
One method of visualizing thermal images over a
wide area is to obtain the 3D structure of the envi-
ronment and render temperatures onto it. (Borrmann
et al., 2012) make 3D thermal map by using a robot,
a razer scanner, and a thermal camera . The robot
repeatedly moves and stops to take a razer scan and
make a 3D thermal map. The outputs are both ther-
mal and RGB point cloud. However, the robot moves
on wheels so they cannot use it to obtain data with
poor footing and it cannot climb over steps. (Ham
and Golparvar-Fard, 2013) use a camera that captures
both RGB and thermal frames and creates thermal
map by using Structure From Motion and Multi-View
Stereo images. However, this method requires a gen-
eral processing unit (GPU) to carry out the calcula-
tions. (Vidas et al., 2013) and (Nakagawaet al., 2014)
make thermal maps by using an RGB-D camera and a
thermal camera. They move fix the thermal and RGB-
D cameras to each other and move them continuously
to make a 3D thermal map. This equipment is hand
held and low cost. However, the RGB-D cameras
used in such works are limited in that they cannot be
used in outdoor environment. Low-cost RGB-D cam-
eras cannot obtain depth values if objects are far from
the thermal camera, and sunlight also affects the abil-
ity of RGB-D cameras to obtain depth values. Thus,
in our work, we overcome this limitation by propos-
ing a method that uses RGB cameras so that 3D ther-
mal maps can be obtained in outdoor environment.
2.2 Monocular RGB SLAM
We use a monocular RGB camera together with a
thermal camera in order to make a experiment in out-
door environment. Thus, the RGB-D camera method
of reconstructing 3D structure cannot be used. In-
stead, we use SLAM for reconstruction. SLAM is one
method of obtaining 3D structures by using a monoc-
ular RGB camera. We can get camera position and 3D
points simultaneously by using SLAM. One SLAM
method is Parallel Tracking and Mapping (PTAM),
which was proposed by (Klein and Murray, 2007).
PTAM can estimate camera pose and translation in
real time because PTAM uses parallel threads to do
mapping and tracking. While PTAM uses feature
points to estimate camera pose and translation, it can-
not use them to estimate where the camera is within a
world coordinate system. Thus, PTAM cannot detect
large loop closure, so it is not capable of large-scale
3D reconstructions. (Mur-Artal et al., 2015) propose
Oriented FAST and Rotated BRIEF SLAM (ORB-
SLAM) which refers to the same method as PTAM. In
their work, feature points are used in tracking, map-
ping, position matching, and loop detection. Thus,
this work can estimate camera pose and translation
on a large scale. However, the number of points in the
map is small because they use ORB-feature points, so
the number of points that can be reconstructed within
a frame is small.
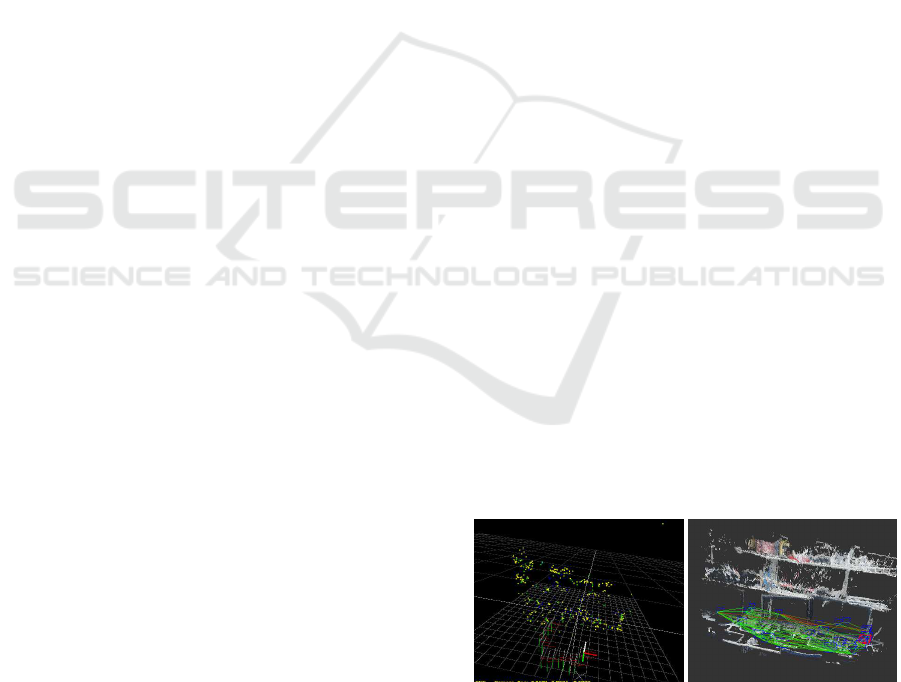
(Engel et al., 2014) proposed LSD-SLAM, which
estimates camera pose and translation not by using
feature points but by using local distribution matching
within a frame. Point clouds made by LSD-SLAM
are more dense than point clouds made by PTAM or
ORB-SLAM because LSD-SLAM retains the pixel
values of each frame. Figure 1 shows an example
of 3D reconstructions by PTAM and by LSD-SLAM.
Our goal is to visualize temperature as a 3D structure,
so density mapping suits our purpose. We thus use
LSD-SLAM to make our thermal maps.
(a) PTAM (b) LSD-SLAM
Figure 1: Examples of reconstruction by using SLAM.
Application of LSD-SLAM for Visualization Temperature in Wide-area Environment
217

3 PROPOSED SYSTEM
The purpose of our system is to visualize thermal in-
formation as a 3D model, superimposing thermal in-
formation on the RGB images. Our system consists of
three stages: camera calibration, 3D reconstruction,
and superimposition of the images. First, we fix the
RGB and thermal cameras and calibrate them to ob-
tain the intrinsic and extrinsic parameters. After that,
we move the equipment to obtain a video sequence.
We then reconstruct a 3D point cloud by using LSD-
SLAM and add the thermal information to each point
cloud. Finally, we superimpose thermal information
on RGB images and create a mesh by Delaunay divi-
sion.
Thermal images have less features of brightness
than RGB images, and temperature changes more
smoothly than RGB values. Thus, commonly used
key point descriptors like SIFT (Lowe, 1999) or
SURF (Bay et al., 2006) fail to obtain feature points.
This makes it difficult to track camera motion or re-
construct structure from motion. The direct method
(Engel et al., 2013) that do not use feature points such
as LSD-SLAM, are also not able to track camera mo-
tion because thermal images do not produce enough
features of brightness. Figure 3 shows the difference
between semi-dense map for the same scene acquired
by each camera. The semi-dense map for the thermal
camera produces less depth value than the map from
the RGB camera, and tracking is lost if only the ther-
mal camera is used. Thus, using another camera is
a better way to visualize thermal information as 3D
structures.
3.1 Camera Calibration
Because the temperature of calibration boards is con-
stant, we cannot calibrate the thermal cameras in the
same way that we calibrate RGB cameras. Thus, we
must develop a calibration board that can be captured
by both RGB cameras and thermal cameras. (Prakash
et al., 2006) heated a calibration board with a flood
lamp and based on the emissivity difference between
the black and white regions, theycan detect the check-
ered pattern. We developed a checkered calibration
board that creates differences in temperature within
the pattern. We use an electric carpet and thermal in-
sulation material to generate the temperature differ-
ence, allowing calibration images to be obtained like
those shown in Figure 2. Based on this calibration
board, we can calibrate both the thermal and RGB
cameras. We use the method of (Zhang, 2000) to cal-
culate the internal parameter.
3.2 Reconstruct the Thermal 3D Point
Cloud
One of the methods of reconstructing 3D models by
using a monocular camera is SLAM. This method
tracks camera position and rotation and maps 3D
points that are used to obtain the scene. In our works,
we use LSD-SLAM which is one of method of SLAM
and visualize thermal information as 3D structures by
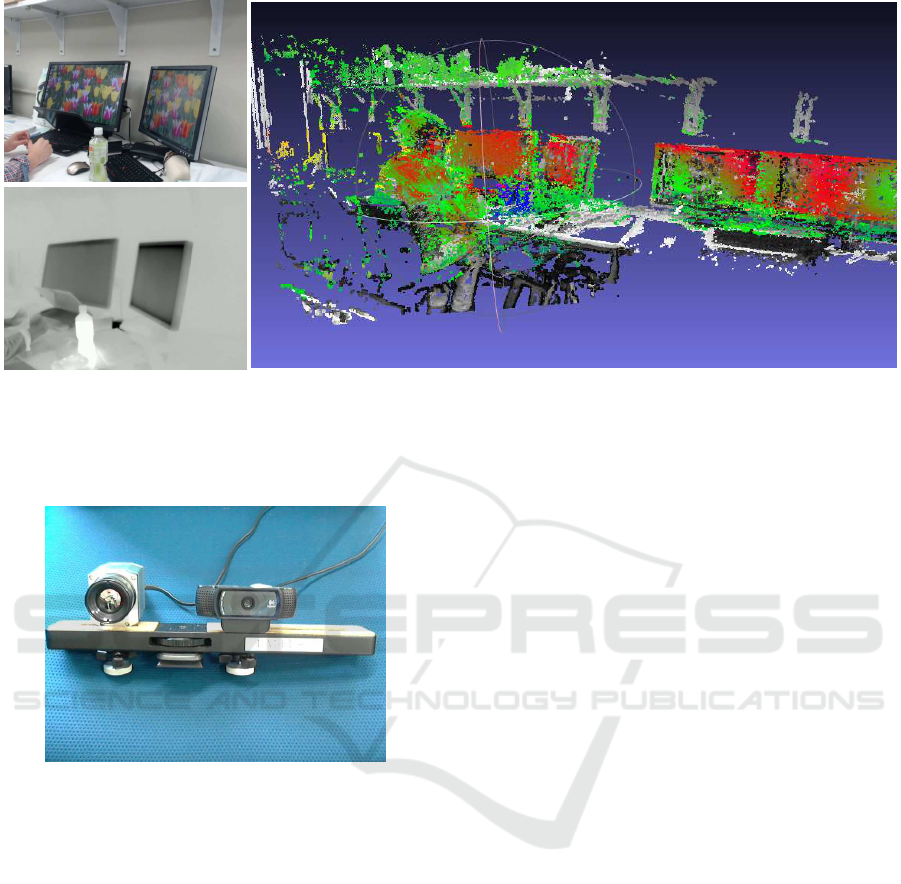
using it. Figure 4 shows a flow chart of the recon-
struction part of our system.
3.2.1 The Features of LSD-SLAM
Methods like PTAM and ORB-SLAM use a monoc-
ular RGB camera and detect feature points from im-
ages. In such methods, camera pose and translation
are estimated based on feature points, but only fea-
ture points are used to make the resulting map. Thus,
the 3D point clouds are very sparse. However, LSD-
SLAM uses the pixel values in the images to estimate
camera pose and translation, which results in more
robust estimations and denser 3D point clouds than in
previous works.
3.2.2 Process of LSD-SLAM
Camera pose and translation are estimated by com-
parison of the pixel values between the input frame
and the key frame. In LSD SLAM, a semi-dense map
of each input frame and its camera pose and posi-
tion are computed by matching with a key frame and
a 3D map recovered until the previous frame. The
semi-dense map is integrated with the 3D map. If the
matching score is less than a pre-defined threshold,
the key frame is replaced with the input frame. In the
proposed method, temperature image is also captured
when the key frame is replaced with the input frame,
so that the temperature is also added to the 3D map.
3.2.3 Map Constitution
The factors contained in the key frame constitute the
map. Each key frame contains the pixel values of the
input images, the depth map, and dispersion of the
depth map. In this work, some pixel in depth map
do not retain depth value. The map only keeps the
depth information that satisfies a given threshold. The
threshold is based on the values of the peripheral pix-
els. This results in a semi-dense map. We can use
a CPU because semi-dense map calculation requires
less computation power.
VISAPP 2017 - International Conference on Computer Vision Theory and Applications
218
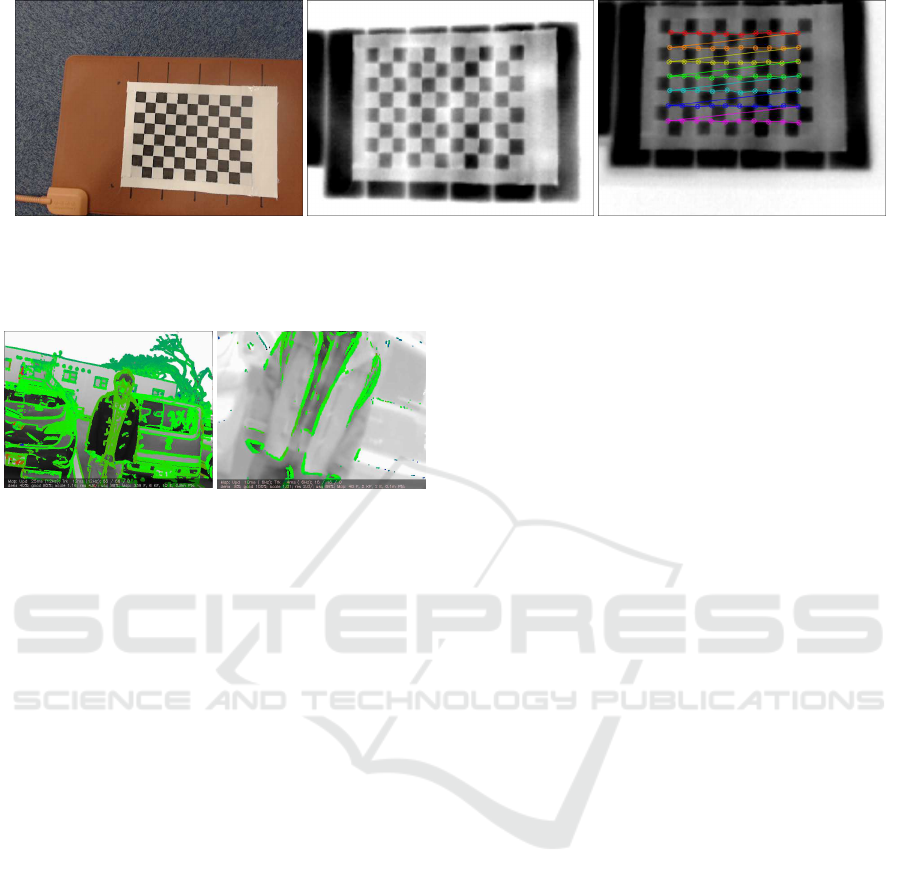
(a) (b) (c)
Figure 2: (a)Checker image taken by RGB camera. (b) Checker image taken by thermal camera. (c) Checker detection pattern
from thermal camera.
(a) Semi-dense map for
RGB camera
(b) Semi-dense map for
thermal camera
Figure 3: Less features are detected in the thermal image
compared to the RGB image.
3.2.4 Tracking a New Frame
ξ
ji
is a vector representing translation from frame i to
frame j.
E(ξ
ji
) =
∑
i
(I
i
(P) − I
j
(w(P, D
i
(P), ξ
ji
))
2
(1)
Equation 1 compares the pixel value at point P in
the key frame and the pixel value at point P in frame
j, which has been translated and is calculated by esti-
mated translation value ξ
ji
and depth map in frame j.
Equation 1 is minimized by using the Gauss-Newton
method and we estimate camera pose and tracking.
3.2.5 Evaluation of Key Frame
When the camera is moved enough, the key frame is
uploaded. Whether the frame is a key frame is then
evaluated based on whether it satisfies the threshold
requirements. If the threshold is satisfied, the depth
map is initialized and the map is renewed. If the
threshold is not satisfied, the current key frame is up-
dated by adding depth information to the semi-dense
map of the current key frame.
3.2.6 Map Optimization
Maps created using monocular SLAM do not have
an inherent scale, which makes it difficult to create a
large-scale map. LSD-SLAM, however, has an inher-
ent scale based on equation 2. Equation 2 optimizes
the depth, using equation 1.
E(ξ
ji
) =
∑
x∈Ω
1
((I
i
(P) − I
j
(P
′
))
2
+ ([P
′
]
k
− D
j
(P
′
))
2
)
(2)
P’ indicates a warped point. After the key frame
is added to the map, frames that are candidates for
loop closure are collected, and suitable candidates are
detected by using an appearance-based mapping algo-
rithm (Glover et al., 2012).
3.2.7 Reprojection of the Point Cloud onto
Thermal Images
Semi-dense maps hold depth data that satisfies the
threshold set by the brightness of the surrounding fea-
tures. Because of this threshold, LSD-SLAM requires
only a CPU. Pixels that have color possess depth
value. Depth is shown in gradations of blue, green,
and red, where red is closer and blue is farther away.
The semi-dense map possessed by the key frame is
updated when the key frame is renewed. In this work,
the semi-dense map is reprojected onto the thermal
image that is taken when the key frame is renewed.
Thus, each pixel also contains thermal information.
The semi-dense map at pixel i is warped to the ther-
mal image by equation 3. I represents the semi-dense
map and I
t
represents the thermal image.
I
t
(i) = I(π(KTπ
−1
(i, d))) (3)
K is the intrinsic matrix of the thermal camera and
T described the relative positional relation between
the thermal camera and the RGB camera. π
−1
(i, d) =
dK
−1
i is a conversion function, meaning that pixel i
Application of LSD-SLAM for Visualization Temperature in Wide-area Environment
219
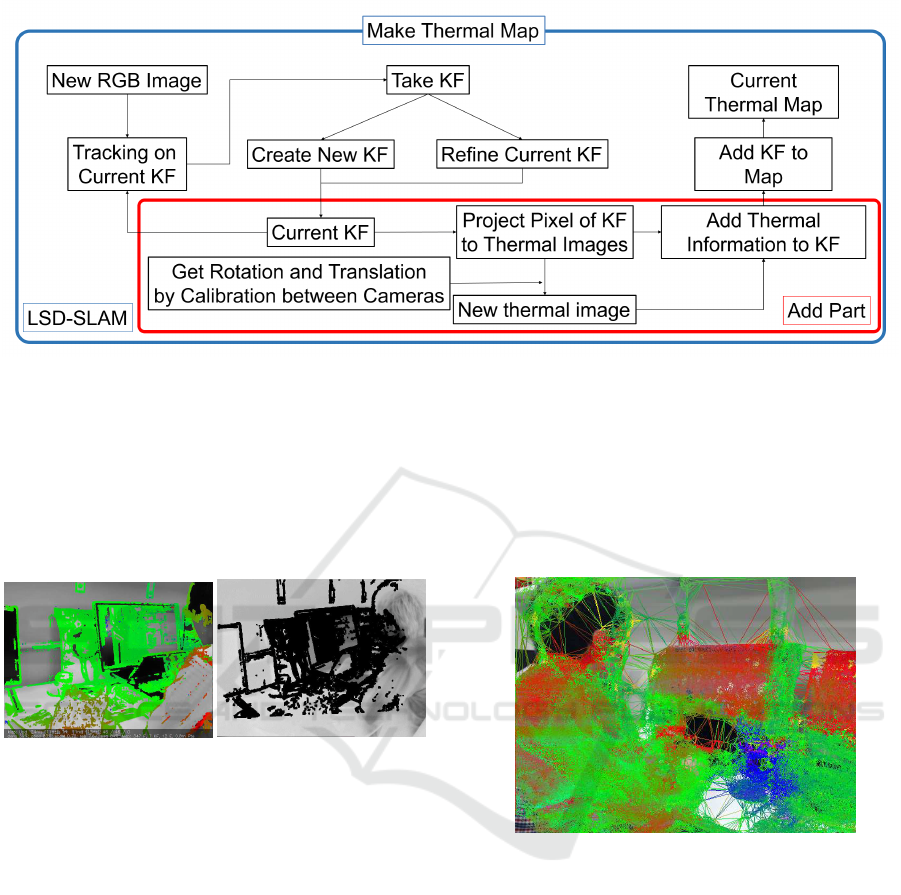
Figure 4: Flow chart of visualize temperature as 3D structures. KF in this figure means key frame.
is converted to a 3D point according to depth d. In
Figure 5, the black part shows the reprojection from
the semi-dense map; each pixel possesses the thermal
information of the projectable part. In the 3D map
reconstruction step, each 3D points contains thermal
information. Thus, we can obtain a 3D thermal map.
(a) Semi-dense map for
LSD-SLAM
(b) Reprojection
semi-dense map
Figure 5: Example of reprojection.
3.3 Superimpose of Thermal
Information onto RGB Images
Normally, we cannot obtain thermal information cor-
responding to each pixel of an RGB camera image be-
cause the optical axis is different between RGB cam-
eras and thermal cameras. Our system superimposes
temperature on the RGB images by using a corre-
sponding point cloud that is reconstructed by using
LSD-SLAM from both the RGB and thermal images.
First, the point cloud is reprojected to the RGB im-
ages by using the RGB cameras extrinsic parameter of
each frame, which is obtained by using LSD-SLAM.
Then, 2D Delaunay division is used to divide each
point into a triangle region, as shown in Figure 6.
Next, the triangles obtained by Delaunay division are
transferred to the thermal image by using translation
and rotation obtained from the camera calibration of
each camera. We obtain an affine matrix from three
points by constructing a triangle in order to transfer
the triangle patch from the RGB image to the thermal
image. Finally, the triangle patches are transferred
from the thermal image back to the RGB image, and
using bilinear interpolation, we obtain the final result.
Figure 6: Delaunay division.
4 EXPERIMENT
4.1 Experiment Environment
In this experiment, we fixed a monocular RGB cam-
era and a thermal camera together into one hand-held
device. This device can be moved to capture video
of the environment. We used an HD PRO C920R in
Logicool (640 × 480 pixels resolution, 30fps), and
Optris PI640 (640 × 480 pixels resolution, 30fps).
Figure 8 shows our camera system.
VISAPP 2017 - International Conference on Computer Vision Theory and Applications
220
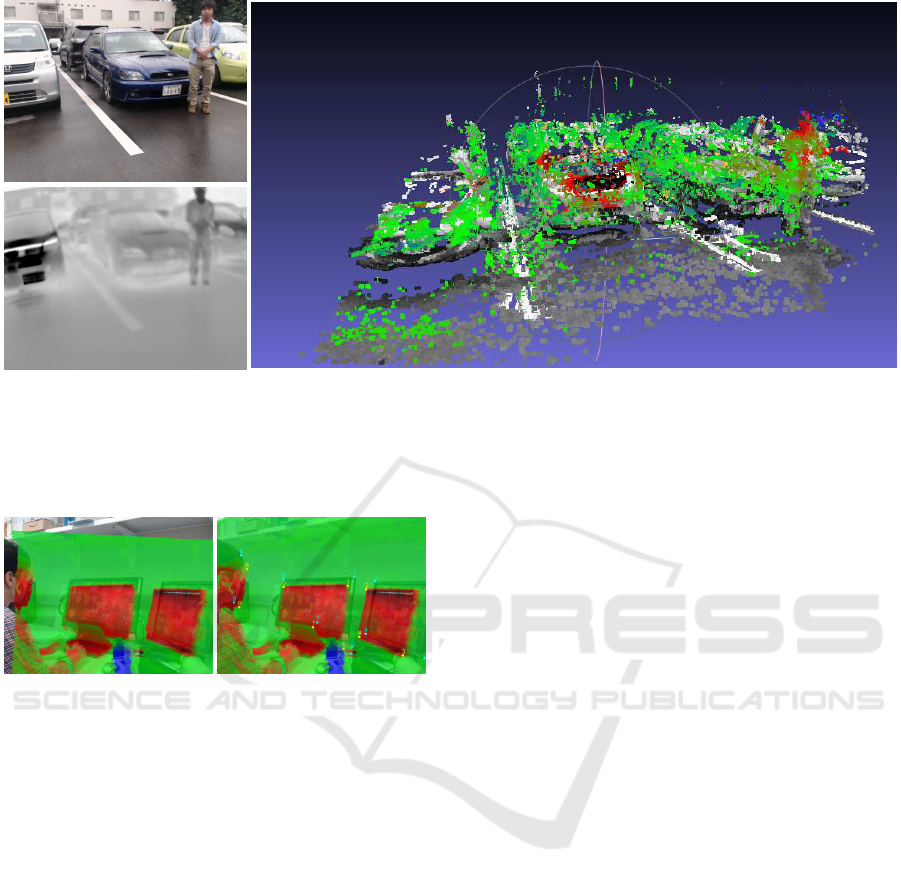
Example images
Visualization temperature as 3D model
Figure 7: Visualization result for an image of an interior environment. Upper left shows an example RGB image of the scene
and bottom left shows an example thermal image of the scene. The right panel shows the result of temperature visualization
as a 3D model. Temperature is shown in gradation of blue, green, and red, where red is higher and blue is lower.
Figure 8: Capture system composed of the HD PRO C920R
and Optris PI640 thermal cameras.
4.2 Temperature Visualization for the
3D Structure
We show results of temperature visualization as 3D
structures for both indoor and outdoor scenes. The
temperature of the plastic bottle in Figure 7 is lower
than the average image temperature while that of the
monitor is higher in the rendering results for the in-
door environmenyt. In Figure 9, the car in the middle
has the highest temperature in the outdoor image. We
can those determine that the car in the middle has just
been used, which cannot be judged using only visi-
ble light. We can also visualize the temperature of 3D
structures in outdoor environments like the parking
area shown.
However, there are some points for which thermal
information cannot be obtained. One of the reasons
for this may be that not every point reconstructed by
LSD-SLAM can be projected to the thermal camera
image because the imaging range of the thermal cam-
era and the RGB camera do not match. Thus, we re-
move such points from the points used to render the
image in the next environment.
Our system is applied to a static environment, so
good results cannot be obtained if the object is mov-
ing or the temperature is changing. Let us suppose
that our system is used for outdoor inspection work in
a wide area.
4.3 Creating Mesh
We discuss the result of temperature distribution ren-
dered onto RGB images. We can observe that some
regions are not correctly aligned with the correspond-
ing areas in RGB images in figure 10, especially the
plastic bottle and the display. This is because the scale
is undefined for the point cloud that is reconstructed
by SLAM with the monocular RGB camera. In our
work, the point cloud obtained by SLAM is superim-
posed on the thermal images according to the rotation
and translation between both cameras. Although the
scale of the translation between both cameras is es-
timated based on the scale of the calibration board,
the point clouds scale is not able to obtained by the
monocular SLAM. We thus cannot align the position
accurately. Because of such uncertainly of the scale
of the point cloud reconstructed by LSD-SLAM, the
alignment between RGB images and temperature dis-
tribution in figure 10 is not correctly performed.
In order to correct the wrong alignment, we fi-
Application of LSD-SLAM for Visualization Temperature in Wide-area Environment
221
Example images
Visualization temperature as 3D model
Figure 9: Visualization result for an image from an outdoor environment. Upper left shows an example RGB image of
the scene and bottom left shows an example thermal image of the scene. The right panel shows the result of temperature
visualization as a 3D model. Temperature is shown in gradation of blue, green, and red, where red is higher and blue is lower.
(a) Result of temperature
rendering
(b) Clicking
corresponding points
Figure 10: Example of temperature rendering.
nally manually aligned them by clicking on the cor-
responding points between RGB image and rendered
temperature distribution as shown in figure 10 (b). We
compute a homography between RGB image and the
rendered temperature distribution, because they can
be correctly aligned by a homography,which can rep-
resent scale difference in 3D point cloud. As a re-
sult, we can make a successful alignment as shown in
figure 11. We can confirm that enough correspond-
ing is obtained by simple methods such as using the
homography because we have geometrically accurate
correspondence between RGB and thermal data by
3D structure. We plan to solve this uncertainty of the
scale to obtain more correct 3D thermal maps.
When we render the temperature distribution, we
first use thermal frames corresponding to the key
frames of LSD SLAM for rendering of temperature
on RGB images. If a triangle in the Delaunay division
is out of the reference thermal image, we refer other
frames to obtain thermal distribution in the triangle.
5 CONCLUSION & FUTURE
WORK
In this paper, we visualize thermal information as 3D
structures and obtain experimental images from both
indoor and outdoor scenes. We also superimposed
thermal information onto RGB images by reproject-
ing the point cloud onto RGB images. As part of the
visualization system, we fixed an RGB camera and
a thermal camera together as a hand-held device and
calibrated them by using a special calibration board
that can detect a checkered pattern with temperature
differences using both an RGB camera and a ther-
mal camera. We can thus obtain intrinsic parameters
of both cameras and their relative positional relation.
After that, the 3D point cloud is reconstructed by us-
ing LSD-SLAM based on image sequences taken by
the RGB camera and reprojected to the thermal im-
age. Each point is updated with thermal information
about the projectable parts. In the case of superim-
posing thermal information onto the RGB images, the
point cloud is reprojected onto the RGB image and
each point is divided into Delaunays triangles, which
are used to create a mesh framework. In our work,
visualization of outdoor temperatures as a 3D model
is possible. This is not possible by using methods de-
scribed in previous work that use kinect. We plan to
expand our work by using drones to acquire images
and make large-scale 3D thermal maps.
VISAPP 2017 - International Conference on Computer Vision Theory and Applications
222
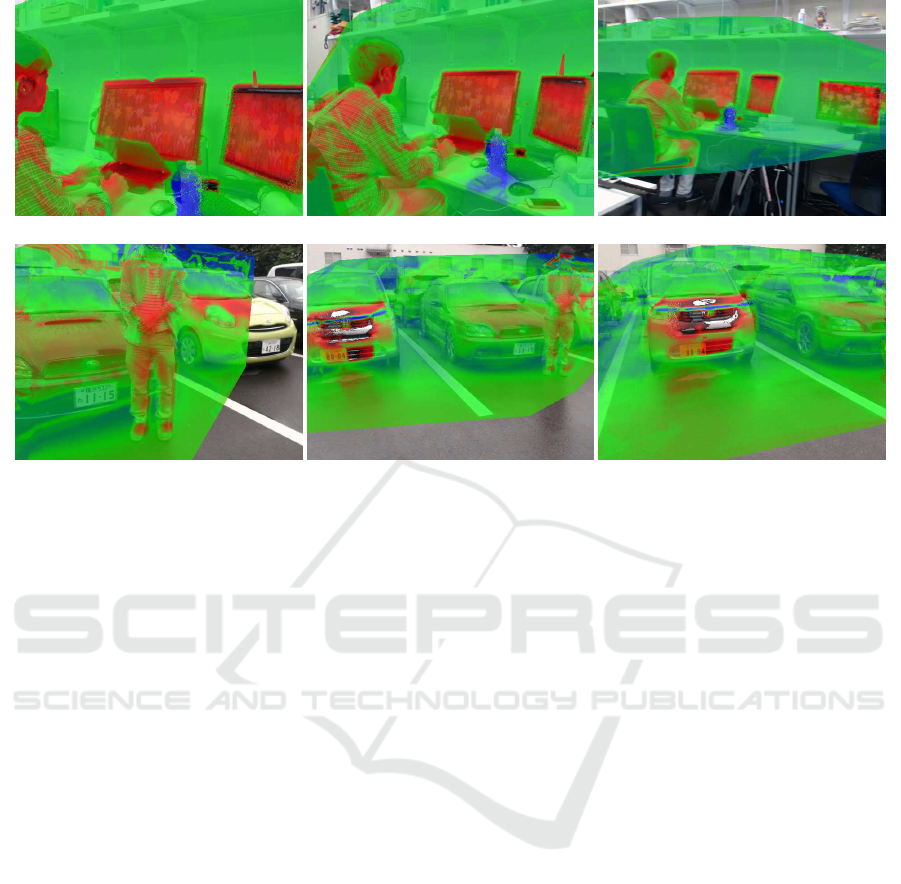
indoor 100
th
frame
outdoor 100
th
frame
indoor 400
th
frame
outdoor 600
th
frame
indoor 1300
th
frame
outdoor 900
th
frame
Figure 11: Result of rendering temperature. Each caption shows the frame number. Top shows the result for an indoor scenes
and bottom shows the result for an outdoor scenes. Temperature is shown in gradation of blue, green, and red, where red is
higher and blue is lower.
REFERENCES
Bay, H., Tuytelaars, T., and Van Gool, L. (2006). Surf:
Speeded up robust features. In European conference
on computer vision, pages 404–417. Springer.
Borrmann, D., N¨uchter, A., Dakulovi´c, M., Maurovi´c, I.,
Petrovi´c, I., Osmankovi´c, D., and Velagi´c, J. (2012).
The project thermalmapper–thermal 3d mapping of
indoor environments for saving energy. IFAC Pro-
ceedings Volumes, 45(22):31–38.
Engel, J., Sch¨ops, T., and Cremers, D. (2014). Lsd-slam:
Large-scale direct monocular slam. In European Con-
ference on Computer Vision, pages 834–849. Springer.
Engel, J., Sturm, J., and Cremers, D. (2013). Semi-dense
visual odometry for a monocular camera. In Proceed-
ings of the IEEE international conference on com-
puter vision, pages 1449–1456.
Glover, A., Maddern, W., Warren, M., Reid, S., Milford, M.,
and Wyeth, G. (2012). Openfabmap: An open source
toolbox for appearance-based loop closure detection.
In Robotics and Automation (ICRA), 2012 IEEE Inter-
national Conference on, pages 4730–4735. IEEE.
Ham, Y. and Golparvar-Fard, M. (2013). An automated
vision-based method for rapid 3d energy performance
modeling of existing buildings using thermal and dig-
ital imagery. Advanced Engineering Informatics,
27(3):395–409.
Klein, G. and Murray, D. (2007). Parallel tracking and map-
ping for small ar workspaces. In Mixed and Aug-
mented Reality, 2007. ISMAR 2007. 6th IEEE and
ACM International Symposium on, pages 225–234.
IEEE.
Lowe, D. G. (1999). Object recognition from local scale-
invariant features. In Computer vision, 1999. The pro-
ceedings of the seventh IEEE international conference
on, volume 2, pages 1150–1157. Ieee.
Matsumoto, K., Nakagawa, W., Saito, H., Sugimoto, M.,
Shibata, T., and Yachida, S. (2015). Ar visualiza-
tion of thermal 3d model by hand-held cameras. In
SciTePress.
Mur-Artal, R., Montiel, J., and Tard´os, J. D. (2015). Orb-
slam: a versatile and accurate monocular slam system.
IEEE Transactions on Robotics, 31(5):1147–1163.
Nakagawa, W., Matsumoto, K., de Sorbier, F., Sugimoto,
M., Saito, H., Senda, S., Shibata, T., and Iketani, A.
(2014). Visualization of temperature change using
rgb-d camera and thermal camera. In Workshop at
the European Conference on Computer Vision, pages
386–400. Springer.
Prakash, S., Lee, P. Y., and Caelli, T. (2006). 3d mapping
of surface temperature using thermal stereo. In 2006
9th International Conference on Control, Automation,
Robotics and Vision.
Vidas, S., Moghadam, P., and Bosse, M. (2013). 3d ther-
mal mapping of building interiors using an rgb-d and
thermal camera. In Robotics and Automation (ICRA),
2013 IEEE International Conference on, pages 2311–
2318. IEEE.
Zhang, Z. (2000). A flexible new technique for camera cal-
ibration. IEEE Transactions on pattern analysis and
machine intelligence, 22(11):1330–1334.
Application of LSD-SLAM for Visualization Temperature in Wide-area Environment
223
