
Objective Measurement of Hypertrophic Scars using Skin
Colorimeter
Iveta Bryjova
1
, Jan Kubicek
1
, Vladimir Kasik
1
, Daniel Kamensky
1
, Hana Klosova
2
, Marek Penhaker
1
and Martin Cerny
1
1
VSB–Technical University of Ostrava, FEECS, K450, 17. Listopadu 15, Ostrava-Poruba, Czech Republic
2
Burn Centre, University Hospital Ostrava, 17. Listopadu 1790 Ostrava-Poruba, Czech Republic
Keywords: Skin Colorimeter Burns, Scars, Prototype.
Abstract: The paper deals with the methodology of the scars pigmentation objective assessment and their time
evaluation on the base acquired data with the skin colorimeter prototype DSC1 (Detection of Scar Color).
The analysis is primarily focused on the hypertrophic scars pigmentation assessment after heeling of deep
burns which often exhibit the pigmentation. In the process of the scars evaluation in some patients it goes to
the spontaneous pigmentation changes. If the pigmentation changes long-term persist and patient requires
corrections, various treatment methods can influence these pigmentation changes (for instance the laser
therapy and others). In the context of the complex development evaluation and in the process of the scars
treatment, these changes are commonly observable well but their quantification is usually difficult, therefore
using of the objective methods is desirable. The particular kind of such objective method is the skin
colorimeter. The technical concept and testing of the skin colorimeter prototype DSC1 is presented in this
paper.
1 INTRODUCTION
Hypertrophic scarring of burns represents the most
frequent complication of the trauma, especially in
the deep burns when both epidermis and dermis are
destroyed. In the case of the normal circumstances,
the healing process goes in three phases:
inflammation, proliferation and remodelling phase.
In the case of the complicated healing, the risk of
developing hypertrophic, functionally restrictive and
aesthetically objectionable scars is particularly high.
(Blazek et al., 2015), (Cerny et al., 2008)
Hypertrophic scars develop within the primary
wound and protrude over the level of the
surrounding skin, they are painful, tough, itching,
initially red and may progress to scarry contractures
requiring surgical treatment. Deep burn scars often
present also pigmentation disorders in the terms of
decreased pigmentation, the so-called
hypopigmentation, increased pigmentation, the so-
called hyperpigmentation or a mix of different
intensity thereof. The pigmentation disorders
affecting the scar make it more visible against the
healthy tissue which is aesthetically less acceptable
for the patient. Pigmentation disorders exhibit from
multiple factors and have not been clarified exactly
yet. The main indications of the burns are the depth
and scope of the burn, activity and duration of the
inflammatory phase of healing, also various cellular
mediators (NO, histamine) and other internal tissue
factors which influence melanogenesis in
melanocytes. At the same time certain exogenous
influences enter the game, such as UV radiation. The
factors mentioned above are often antagonistic,
therefore, the resulting changes in the pigmentation
are difficult to predict and highly individual. There
are several scales for clinical evaulation: Patient and
Observer Scar Assessment Scale, Visual Analog
Scale, Manchester Scar Scale and the most
frequently used Vancouver Scar Scale which uses
pigmentation classification, elevation, pliability and
vascularisation of the scar. Scar assessment using
the above scales is inherently subjective – it depends
upon the experience and skills of the physician
performing clinical assessment. (Augustynek et al.,
2010), (Scafide et al., 2016), (Shin et al., 2015),
(Stekelenburg et al., 2016)
126
Bryjova I., Kubicek J., Kasik V., Kamensky D., Klosova H., Penhaker M. and Cerny M.
Objective Measurement of Hypertrophic Scars using Skin Colorimeter.
DOI: 10.5220/0006147101260133
In Proceedings of the 10th International Joint Conference on Biomedical Engineering Systems and Technologies (BIOSTEC 2017), pages 126-133
ISBN: 978-989-758-216-5
Copyright
c
2017 by SCITEPRESS – Science and Technology Publications, Lda. All rights reserved

2 STATE OF ART
Subjective methods for the evaluation of the color
changes of hypertrophic scarring after burn trauma
are widely described in scientific articles published
in high-impact journals worldwide. Despite this fact,
a objective method for burns assessment is still
missing. The recent research shows that there are not
many published scientific papers that would
specifically focus on the objective evaluation of
color hypertrophic scarring after burn injury.
Published results of clinical trials in particular
describe the effect of UV radiation linked with an
increasing incidence of skin cancer. In paper
(Klosová et al., 2013) the authors publish the results
of clinical measurements carried out on 27 male and
31 female probands, in age ranging from 6 to 9
years. The main objective of the study was to
demonstrate that the incidence of skin cancer in
adulthood is closely linked to the action of
ultraviolet radiation in childhood. For an objective
assessment of the skin color a commercial
measuring device – namely, colorimeter Chroma
Meter CS-200 (Konica Minolta, Japan) – was used.
The results proved very high accuracy of the
measurement.
In (Štětinský et al., 2015) the authors publish the
results of a comparative study of two different
methods of objective assessment of depigmentation
using reference colorimetric methods. The
measurement was performed by the colorimeter
Chroma Meter CS-200 (Konica Minolta, Japan) and
digital camera with polarization spectroscopic
technology TiVi600 (Tissue Viability Imager
TiVi600, WheelsBridge AB, Linkoping, Sweden).
The results prove the fact that TiVi600 non-contact
sensing achieves more accurate results than
colorimeter Chroma Meter CS-200.
Another comparative study was performed with
the target of evaulation the potential of selected
parameters measurements (measurement accuracy,
sensitivity and reproducibility) of a new commercial
device Antero 3D (Miravex Limited, Ireland) with
leading commercial dermatology devices
Mexameter MX 18 (Courage Khazaka, Germany)
and Colorimeter CL 400 (Courage Khazaka,
Germany). The results of comparative analysis of
these devices showed that Antero exhibits more
sensitivity melanin and also improved resolution
capability of erythema and melanin. The sensitivity
of Mexameter and Colorimeter is almost identical.
Based on the results of the search of available
commercial equipment for the detection of human
skin color, or melanin concentration, we proceeded
to the actual realization of the prototype skin
colorimeter DSC1 order to objectify color change
hypertrophic scars after thermal trauma in clinical
practice. The main focus was to design a device that
will be compatible and safe for clinical use, but also
economically feasible.(Cerny et al., 2009),
(Kukucka, 2009), (Machaj et al., 2016), (Romanelli
et al., 2013), (Verhaegen et al., 2014).
3 HARDWARE DESIGN OF SKIN
COLORIMETER
The functional unit of the colorimeter DSC1 is
composed from several commercially available
electronic components: color sensor TSC230,
programming board Arduino Uno with
microprocessor ATMega328 and alphanumeric LCD
display 16x2. For the initial test run wiring
breadboard with the Arduino kit connection cables
were applied. In the first step, validation of the
measuring using low-cost optical components was
performed. The individual hardware parts are
represented in the block diagram (fig. 1). The
essential component of the device is the
programmable color sensor TSC230. The sensor is
able to detect any number of colours, and works on
the principle of light intensity into frequency
transformation. This part include 4 illuminating LED
diodes in squared configuration, and the so-called
RGB field (fig. 2). (Penhaker et al., 2013)
The RGB field is placed in the middle of the
sensor and contains 64 quartz photodiodes. Each
photodiode is equipped by 3 filters intended for the
detection of red, green and blue color. 16
photodiodes are not equipped by filters, and they are
primarily used for the scanning an detection of the
white illumination. (Penhaker et al., 2011)
Digital input and output of the sensor is
facilitated by the communication interphase with the
microcontroller AVR ATMega 328 which is built in
the programming board Arduino Uno. The sensor is
linked with the microcontroller by six digital I/O
lines which allows for picking the respective color
(R/G/B), sensor sensitivity (Power down /2 % /20 %
/100 %), output instruction and one pin for signal
output. In the output we obtain rectangular signal
(fig. 3), its frequency (AA) is given by the
photodiode current. (Majernik et al., 2014), (Marek
and Krejcar, 2015)
Objective Measurement of Hypertrophic Scars using Skin Colorimeter
127
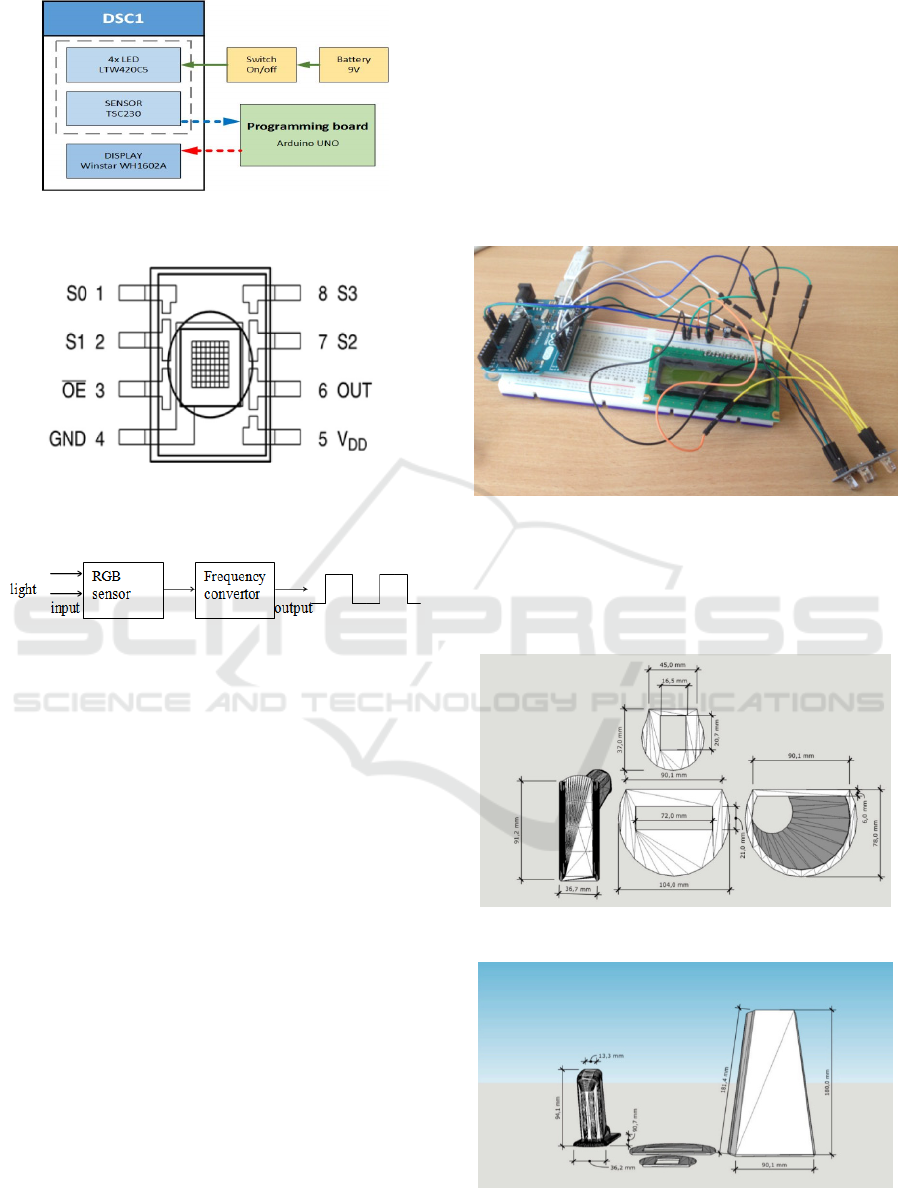
Figure 1: The block diagram of the DSC1 hardware part.
Figure 2: XY RGB photodiode field of the TSC230
sensor.
Figure 3: Principle of rectangular signal transformation.
The frequency f
0
represents the sensor detection
function and is described by the following formula:
).(Re
0
Eeff
D
+=
(1)
where f
0
denotes the output frequency, f
D
denotes the
output frequency for darkness state, i.e. when ܧ݁ = 0
as a result leakage currents, ܧ݁(ܹ݉ ܿ݉
2
) is the
intensity of the radiation incidence and ܴ݁(݇ܪݖ
(ܹ݉/ܿ݉
2
)) denotes the sensor reaction to the
wavelength of the respective light. Due to the fact
that frequency f
0
is directly proportional to
brightness of the individual colour components, it is
possible to represent the appropriate output
frequency in RGB color model and obtain the
resulting colour. During the start-up it is possible to
calibrate two levels in the RGB space – absolute
black color is represented by zero coordinates given:
[0, 0, 0] which then represents the darkness status of
f
D
constant, and absolute white color is given: [255,
255, 255] which denotes the maximum RGB level
also called the white balance. These levels therefore
define the brightness scale of the individual
components of the RGB model [0 - 255].
(Augustynek and Penhaker, 2011)
After plugging-in of the sensor (fig.4) the power
supply and communication with the programming
board was tested. A bypassing capacitor (reduction
of high frequency current flow) and a LCD display
for simple viewing of the data measured were
connected to the feeder circuits. We use the
potentiometer (10 ݇Ω) linked with the LCD display
to adjust the required contrast. There is also push-
button switch for activation of the circuit. (Penhaker
et al., 2012), (Vybiral et al., 2011)
Figure 4: Testing HW connection of the sensor with the
programming board.
The last step in completion of DSC1 was the design
(fig. 5, 6, 7, 8) and 3D print of the protective cover
to meet the hygiene requirements for the clinical use.
Figure 5: The protective cover – the below view.
Figure 6: The protective cover – the back view.
BIODEVICES 2017 - 10th International Conference on Biomedical Electronics and Devices
128
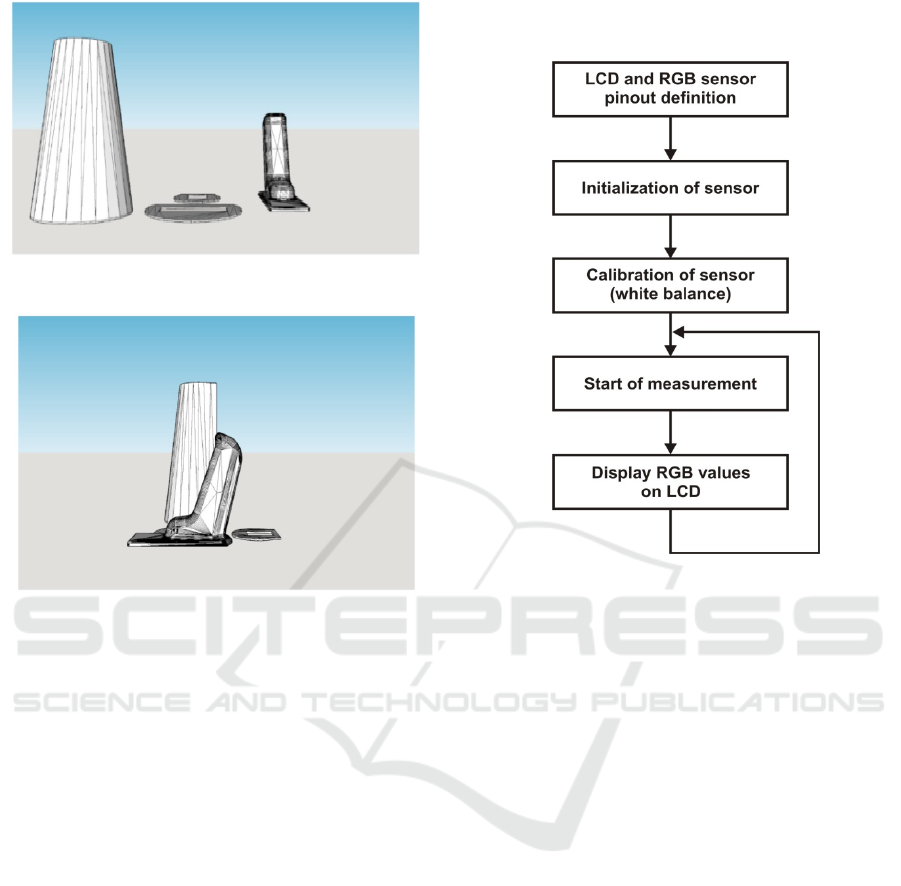
Figure 7: The protective cover – the front view.
Figure 8: The protective cover – the right view.
(Kaartinen et al., 2011), (Kubicek et al., 2016),
(Lammers et al., 2011).
4 SOFTWARE DESIGN OF SKIN
COLORIMETER
The associated software of colorimeter prototype is
designed in the JAVA language in the Arduino IDE
environment, and it utilizes functionalities of the
ElecFreaks library, especially functionalities for
signal frequency measurement and LCD display
control.
The controlling algorithm is described in the
flow chart (fig.9). In the first step, the LiquidCrystal
lcd() functionality and the #define clause were used
to define communication pins of the LCD display
and the sensor. In the consecutive step, the sensor is
initialized and the frequency scale is adjusted on 2 %
(enables measurement with higher sensitivity).
Consequnetly, the sensor is calibrated to level [255,
255, 255] which in RGB space corresponds with the
absolute white color. By this way, the upper limit of
the RGB space is established. Calibration sensor is
done by mat white plate or cardboard. Calibration
must be done during the first start or restart.
(Bryjova et al., 2016).
Figure 9: Algorithm flow chart of the DSC1 skin
colorimeter.
5 CLINICAL TESTING AND
RESULTS
Verification of the reliability and the accuracy of the
device are tested on the base clinical measurements;
just a few selected cases are discussed. Case 1
represents a male aged 28 with a hypertrophic scar
caused by a thermic trauma (fig.10) at the dorsal
side of the right arm. Altogether 10 measurements of
the hypertrophic scars and the same number of
control measurements of the healthy arm are
performed.
Objective Measurement of Hypertrophic Scars using Skin Colorimeter
129
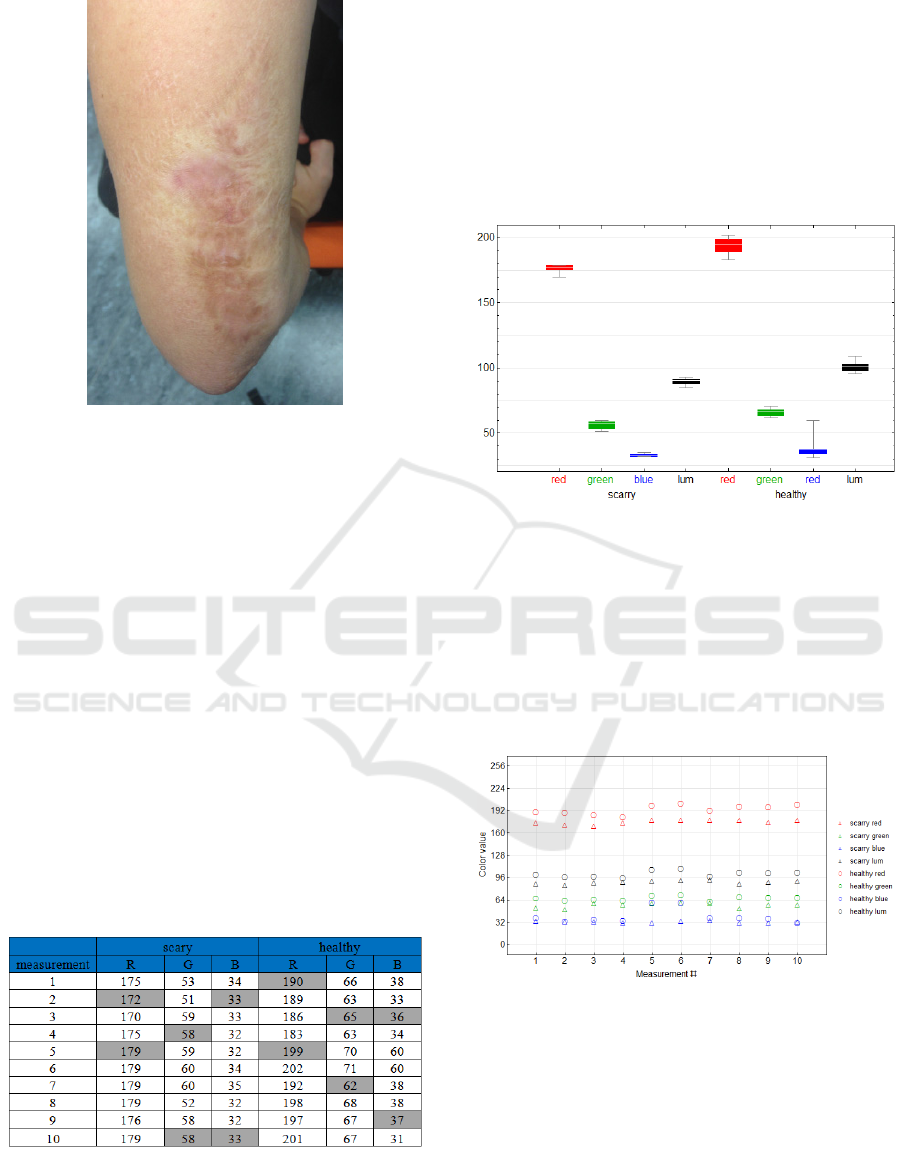
Figure 10: Arm affected by the hypertrophic scar.
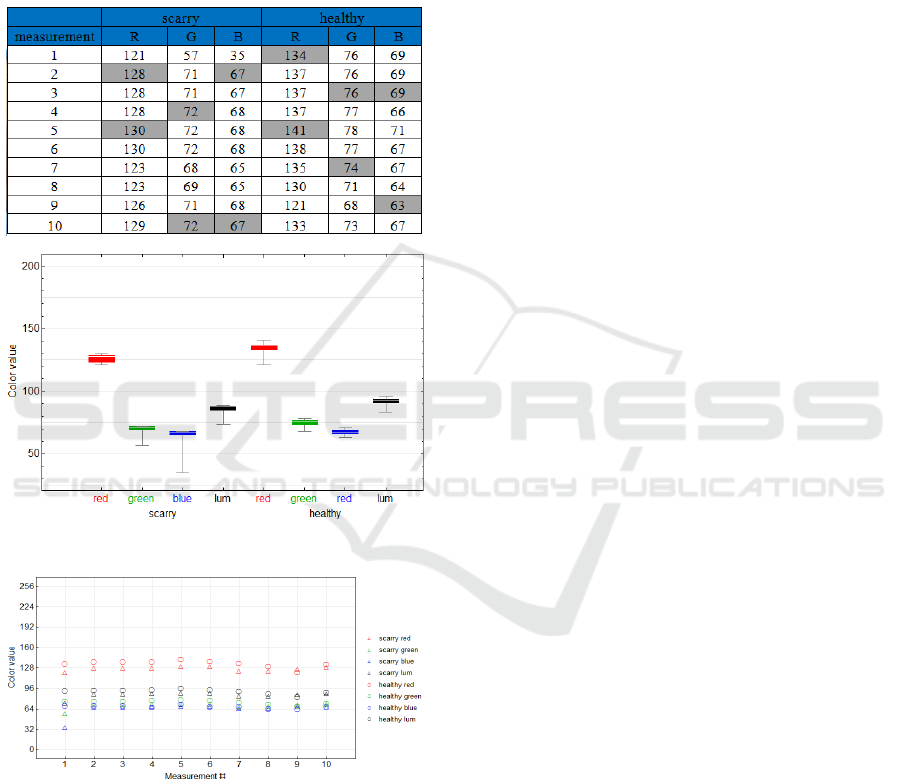
The results of the measurements are summarized
in the table (tab. 1) and on the scatter plot (fig. 12)
for each color component R, G, B; the scatter plot
moreover contains luminance calculated from color
components according to the standard formula Y =
0.299R + 0.587G + 0.114B. Values representing the
scars are plotted by triangles, values representing the
control measurements are plotted by the circles, the
individual color components and luminance are
presented in corresponding colors and in black. The
results are further represented by the box plot (fig.
11) showing the measurements of the scars (see the
left part of the diagram) and control measurements
of the healthy skin (see the right part of the
diagram). These graphic outputs are supplemented
by comparison of the color and luminance of the
hypertrophic scar and healthy skin.
Table 1: The overview of the RGB values measured for
the scary and healthy parts of the arm skin.
Diversity of color components and luminance is
statistically tested in the form of null hypothesis of
equation of mean values of dependent data samples,
sequentially for the color components and
luminance. For testing the Location Test
functionality implemented in the Mathematica
software version 10.4 developed by Wolfram
Research Inc. was applied which automatically
selects the optimum way of testing based on pre-
tests of the data samples. In this particular case, the
pair Student´s t-test is selected for the red and green
components and luminance and the signed rank test
was used for the blue component.
Figure 11: Box Plot – the arm affected by the hypertrophic
scar.
The results are unambiguous – all the RGB
components and luminance Y in the scary skin at the
level of significance 0.05 are statistically
significantly lower (scarry skin is darker as shown in
the above comparison of colors, p-values for R, G, B
and Y components being sequential 8 x 10⁻⁷, 5.2 x
10-5, 0.015 and 6.8 x 10⁻⁶.
Figure 12: Scatter Plot – arm affected by the hypertrophic
scar.
Case 2 is a patient hospitalized in the Burns Centre
of the Teaching Hospital in Ostrava (fig. 13). The
testing involved measurement of extensive mature
hypertrophic scars following an injury by the electric
current. The patient agreed with the measurement
and signed an informed consent. The measurement
is done under constant ambient conditions:
temperature 22.8 °C, relative humidity 30.7 %,
BIODEVICES 2017 - 10th International Conference on Biomedical Electronics and Devices
130
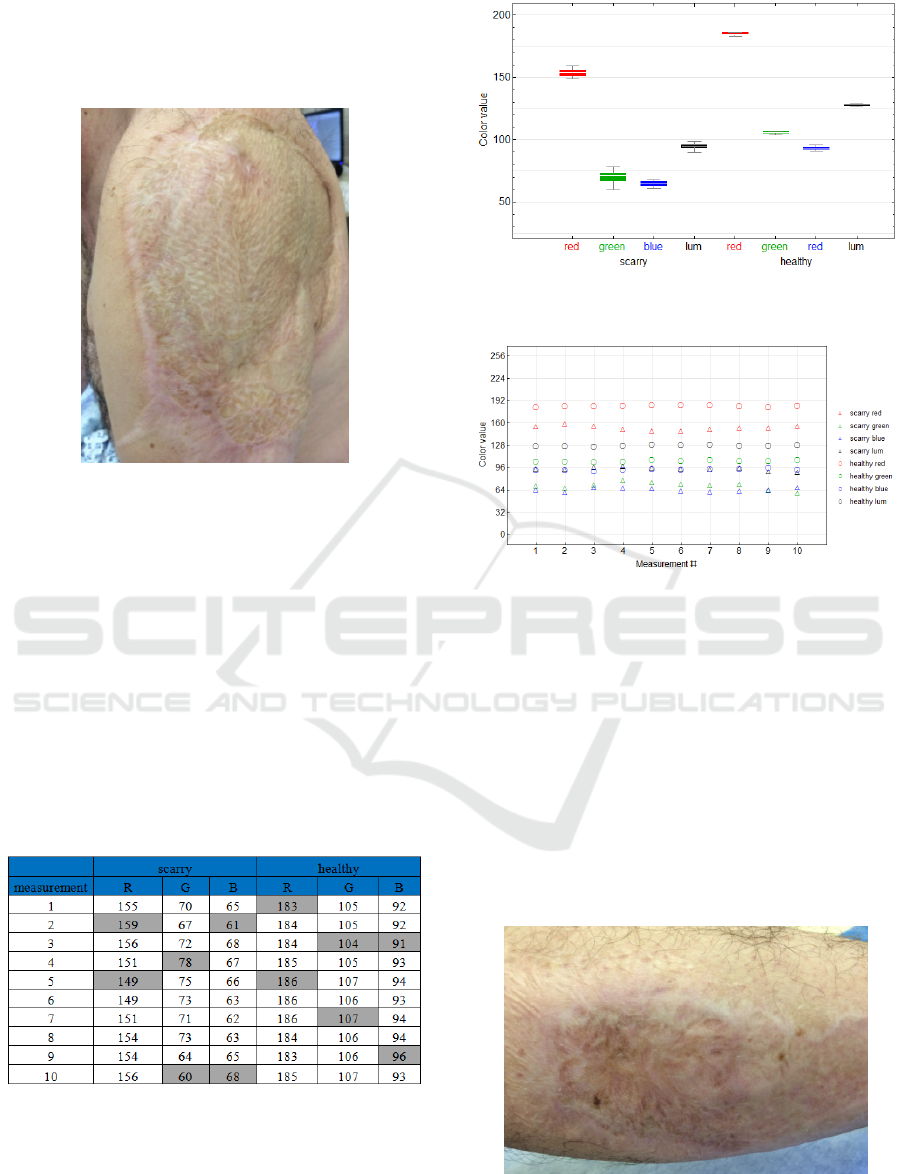
patient´s body temperature 36.2 °C. Both the scarry
and healthy parts of the body are tested separately 10
times. Two anatomical locations are measured
(shoulder and crus).
Figure 13: Affected shoulder after electrical current injury.
For the statistical imaging and testing analogical
procedure is used as in the case 1. In this particular
case, the pair Student´s t-test is selected for all color
components as well as luminance. The results are
again unambiguous – all the RGB components as
well as luminance Y in the scarry skin are
statistically significantly lower (scarry skin is darker
as shown in the above comparison of colors, box
plot (fig. 14) and scatter plot (fig. 15), p-values for
R, G, B and Y components being sequentially 2.2 x
10
-9
, 1.0 x 10
-8
, 3.0 x 10
-10
and 7.5 x 10
-11
.
Table 2: Overview of the RGB values measured for the
scary and healthy parts of the shoulder skin.
Figure 14: Box Plot – shoulder after the electrical current
injury.
Figure 15: The Scatter Plot – the shoulder after the
electrical current injury.
Left crus
Statistical imaging and testing is performed using
analogical procedure as in the case 1. In this
particular case, the pair Student ´s test is selected for
red and green components and luminance and the
signed rank test is used for the blue component. R
and G color components as well as luminance Y in
the scarry skin are statistically significantly lower
(scarry skin is darker as shown in the above
comparison of colors, box plot (fig. 17) and scatter
plot (fig. 18), p-values for R, G and Y being
sequentially 0.001, 0.019 and 0.012
Figure 16: The crus with the hypertrophic scar.
Objective Measurement of Hypertrophic Scars using Skin Colorimeter
131
On the contrary, in the blue component we do
not reject the null hypothesis of equation of the
mean value on the basis of p-value 0.437. Here,
difference in luminance is less obvious though
noticeable even when observing and comparing
colors by naked eye.
Table 3: Overview of the RGB values measured for the
scary and healthy parts of the crus skin.
Figure 17: Box Plot – the crus with the hypertrophic scar.
Figure 18: Scatter Plot – the crus with the hypertrophic
scar.
6 CONCLUSIONS
Testing results prove that areas containing scars are
statistically significantly darker than the normal
skin, and it all them color components, including the
luminance. There is a one exception. Just in the case
of the left crus the blue scar component is
insignificantly darker. The proposed prototype of the
skin colorimeter DSC1 seems to be promising
device in the context of the objective assessment of
the color skin weaker differences (hypertrophic and
other scars) in the clinical conditions.
The device primarily allows for the
quantification of the pigmentation level of the
hypertrophic scars as the consequence after
extensive thermally traumas. In the context of the
future clinical measurements the next physical and
other conditions will be determined for valid values
measurement which consequently will be able to
represent and assess the correlation with the most
frequently used clinical scale VSS (Vencouver Scar
Scale).
The next steps should be focused to the
miniaturization and improving of the hardware
components of the DSC1. These improvements are
necessary to routine using of the DSC1 for the
clinical measurement as affordable, reliable and
accurate method.
ACKNOWLEDGEMENT
This article has been supported by financial support of TA
ČR, PRE SEED Fund of VSB-Technical univerzity of
Ostrava/TG01010137. The work and the contributions
were supported by the project SV4506631/2101
'Biomedicínské inženýrské systémy XII'.
REFERENCES
Augustynek, M., Labza, Z., Penhaker, M., Korpas, D., &
Society, I. C. (2010). Verification of set up dual-
chamber pacemaker electrical parameters. 2010
Second International Conference on Computer
Engineering and Applications: Iccea 2010,
Proceedings, Vol 2, 168-172.
doi:10.1109/iccea.2010.187.
Augustynek, M., & Penhaker, M. (2011). Non invasive
measurement and visualizations of blood pressure.
Elektronika Ir Elektrotechnika(10), 55-58.
doi:10.5755/j01.eee.116.10.880.
Blazek, P., Krenek, J., Kuca, K., Krejcar, O., Jun, D., &
Ieee. (2015). The biomedical data collecting system.
2015 25th International Conference Radioelektronika
(Radioelektronika), 419-422.
Bryjova, I., Kubicek, J., Dembowski, M., Kodaj, M.,
Penhaker, M. 2016. Reconstruction of 4D CTA brain
perfusion images using transformation methods,
Advances in Intelligent Systems and Computing, 423,
pp. 203-211.
BIODEVICES 2017 - 10th International Conference on Biomedical Electronics and Devices
132

Cerny, M., Martinak, L., Penhaker, M., & Rosulek, M.
(2008). Design and implementation of textile sensors
for biotelemetry applications. In A. Katashev, Y.
Dekhtyar, & J. Spigulis (Eds.), 14th nordic-baltic
conference on biomedical engineering and medical
physics (Vol. 20, pp. 194-197).
Cerny, M., & Penhaker, M. (2009). Circadian rhythm
monitoring in homecare systems. In C. T. Lim & J. C.
H. Goh (Eds.), 13th international conference on
biomedical engineering, vols 1-3 (Vol. 23, pp. 950-
953).
Kaartinen, I.S., Välisuo, P.O., Bochko, V., Alander, J.T.,
Kuokkanen, H.O. 2011. How to assess scar
hypertrophy - A comparison of subjective scales and
Spectrocutometry: A new objective method. Wound
Repair and Regeneration, 19 (3), pp. 316-323.
Klosová, H., Štětinský, J., Bryjová, I., Hledík, S., and
Klein, L. 2013. Objective evaluation of the effect of
autologous platelet concentrate on post-operative
scarring in deep burns. Burns.,s. -. DOI:
10.1016/j.burns.2013.01.020.
Kubicek, J., Bryjova, I., Penhaker, M. 2016. Macular
lesions extraction using active appearance method
Lecture Notes of the Institute for Computer Sciences,
Social-Informatics and Telecommunications
Engineering, LNICST, 165, pp. 438-447.
Kubicek, J., Bryjova, I., Penhaker, M., Kodaj, M.,
Augustynek, M. 2016. Extraction of myocardial
fibrosis using iterative active shape method Lecture
Notes in Computer Science (including subseries
Lecture Notes in Artificial Intelligence and Lecture
Notes in Bioinformatics), 9621, pp. 698-707.
Kukucka, M. (2009). Modeling of logic diagnostic system
knowledge base evaluation.
Lammers, G., Verhaegen, P.D.H.M., Ulrich, M.M.W.,
Schalkwijk, J., Middelkoop, E., Weiland, D., Nillesen,
S.T.M., Van Kuppevelt, T.H., Daamen, W.F. 2011. An
overview of methods for the in vivo evaluation of
tissue-engineered skin constructs Tissue Engineering -
Part B: Reviews, 17 (1), pp. 33-55.
Machaj, J., Brida, P., & Benikovsky, J. (2016). Scalability
optimization of seamless positioning service. Mobile
Information Systems. doi:10.1155/2016/9714080
Majernik, J., Jarcuska, P., & Ieee. (2014). Web-based
delivery of medical education contents used to
facilitate learning of infectology subjects. 2014 10th
International Conference on Digital Technologies (Dt),
225-229.
Marek, T., & Krejcar, O. (2015). Optimization of 3d
rendering in mobile devices. In M. Younas, I. Awan, &
M. Mecella (Eds.), Mobile web and intelligent
information systems (Vol. 9228, pp. 37-48).
Penhaker, M., Darebnikova, M., & Cerny, M. (2011).
Sensor network for measurement and analysis on
medical devices quality control. In J. J. Yonazi, E.
Sedoyeka, E. Ariwa, & E. ElQawasmeh (Eds.), E-
technologies and networks for development (Vol. 171,
pp. 182-196).
Penhaker, M., Klimes, P., Pindor, J., & Korpas, D. (2012).
Advanced intracardial biosignal processing. In A.
Cortesi, N. Chaki, K. Saeed, & S. Wierzchon (Eds.),
Computer information systems and industrial
management (Vol. 7564, pp. 215-223).
Penhaker, M., Kasik, V., & Snasel, V. (2013). Biomedical
distributed signal processing and analysis. In K.
Saeed, R. Chaki, A. Cortesi, & S. Wierzchon (Eds.),
Computer information systems and industrial
management, cisim 2013 (Vol. 8104, pp. 88-95).
Scafide, K.N., Sheridan, D.J., Taylor, L.A., Hayat, M.J.
2016. Reliability of tristimuluscolourimetry in the
assessment of cutaneous bruise colour Injury, 47 (6),
pp. 1258-1263.
Shin, J.U., Kang, S.-W., Jeong, J.J., Nam, K.-H., Chung,
W.Y., Lee, J.H. 2015. Effect of recombinant human
epidermal growth factor on cutaneous scar quality in
thyroidectomy patients Journal of Dermatological
Treatment, 26 (2), pp. 159-164.
Stekelenburg, C.M., Hiddingh, J.,Kuipers, H.C.,
Middelkoop, E.,Nieuwenhuis, M.K., Polinder, S., Van
Baar, M.E. 2016. Cost-effectiveness of laser doppler
imaging in burn care in The Netherlands: A
randomized controlled trial Plastic and
Reconstructive Surgery, 137 (1), pp. 166e-176e.
Štětinský, J., Klosová, H., Kolářová, H., Šalounová, D.,
Bryjová, I. and Hledík, S. 2015. The time factor in the
LDI (Laser Doppler Imaging) diagnosis of burns.
Lasers in Surgery and Medicine. 47(2): 196-202. DOI:
10.1002/lsm.22291. ISBN 10.1002/lsm.22291. ISSN
01968092.
Romanelli, M., Dini, V., Mani, R. Skin and vascular
assessments 2013. Measurements in Wound Healing:
Science and Practice, pp. 193-223.
Kubicek, J., Penhaker, M., Bryjova, I., Augustynek, M.
2016. Classification method for macular lesions using
fuzzy thresholding method) IFMBE Proceedings, 57,
pp. 239-244.
Verhaegen, P.D.H.M., Bloemen, M.C.T., Van Der Wal,
M.B.A., Vloemans, A.F.P.M., Tempelman, F.R.H.,
Beerthuizen, G.I.J.M., Van Zuijlen, P.P.M. 2014. Skin
stretching for primary closure of acute burn wounds
Burns, 40 (8), pp. 1727-1737.
Vybiral, D., Augustynek, M., & Penhaker, M. (2011).
Devices for position detection. Journal of
Vibroengineering, 13(3), 531-535.
Objective Measurement of Hypertrophic Scars using Skin Colorimeter
133
