
Spectral Data Fusion for Robust ECG-derived Respiration with
Experiments in Different Physical Activity Levels
Iman Alikhani
1
, Kai Noponen
1
, Arto Hautala
1
, Rahel Ammann
2
and Tapio Sepp¨anen
1
1
Physiological Signal Analysis Group, Center for Machine Vision and Signal Analysis, University of Oulu, Oulu, Finland
2
Swiss Federal Institute of Sport, Magglingen, Switzerland
Keywords:
Respiratory Sinus Arrhythmia, Heart Rate Variability, Spectral Fusion, R-peak Amplitude, QRS Morphologi-
cal Shape, Time-frequency Analysis, Robustness, Single-channel ECG.
Abstract:
In this paper, we study instant respiratory frequency extraction using single-channel electrocardiography
(ECG) during mobile conditions such as high intensity exercise or household activities. Although there are a
variety of ECG-derived respiration (EDR) methods available in the literature, their performance during such
activities is not very well-studied. We propose a technique to boost the robustness and reliability of widely
used and computationally efficient EDR methods, aiming to qualify them for ambulatory and daily monitoring.
We fuse two independent sources of respiratory information available in ECG signal, including respiratory si-
nus arrhythmia (RSA) and morphological change of ECG time series, to enhance the accuracy and reliability
of instant breathing rate estimation during ambulatory measurements. Our experimental results show that
the fusion method outperforms individual methods in four different protocols, including household and sport
activities.
1 INTRODUCTION
Respiratory frequency is a vital physiological signal
used for a variety of diagnostic and clinical purposes.
Often, it is not measured just by itself but together
with other vital signals using a multitude of sensors to
judge correlations between a patient’s physiology and
different diseases. Especially in ambulatory monitor-
ing, where the measurements are made during regular
daily activities, the sensors, however, might interfere
with and change the breathing rhythms of subjects
and cause discomfort. Since instantaneous breath-
ing rate can be estimated indirectly using ECG sig-
nal, development of ECG-derived respiration (EDR)
software tools could decrease the cost and facilitate
making long-term measurements in a more pleasant
and true-to-life manner.
The concept of EDR was proposed decades ago
in (Moody et al., 1985) and clinically validated in
(Moody et al., 1986). Basically, the estimation of
EDR is enabled by two physiological phenomena:
• The heart rate (HR) is modulated by the respira-
tion such that R-R intervals (RRI) shorten dur-
ing inhale and elongate during exhale, which is
known as the respiratory sinus arrhythmia (RSA).
• The mechanical effects of chest movement dur-
ing breathing modulates the observed ECG mor-
phology, which is especially visible in the QRS-
complex part and can be measured, e.g. as ei-
ther R-peak amplitude (RPA) or the morpholog-
ical scale variation of QRS complexes (MSV).
These derived quantities – RRI, RPA and MSV – are
employed widely in published EDR methods that op-
erate on single-channel ECG (Cysarz et al., 2008;
Thayer et al., 2002; Sch¨afer and Kratky, 2008; Correa
et al., 2008; Orphanidou et al., 2013; Noponen et al.,
2012). A proportion of publications contributing in
EDR area, attempt to extract the respiratory time se-
ries waveform (Correa et al., 2008; Cysarz et al.,
2008; Widjaja et al., 2012), while, some other studies,
including our own paper, focus on acquiring breathing
rate of subjects regardless of the respiratory waveform
morphology (Sch¨afer and Kratky, 2008; Thayer et al.,
2002; Orphanidou et al., 2013).
In 2008, the three following comparison papers
were published in the EDR area. The first paper
(Sch¨afer and Kratky, 2008) studied various EDR
methods based on RSA and proposed a time-domain
counting method to estimate instantaneous respiratory
frequency. In the second paper (Correa et al., 2008),
the authors compared breathing morphology derived
from RRI, RPA and area under R wave (AUR) sig-
88
Alikhani I., Noponen K., Hautala A., Ammann R. and SeppÃd’nen T.
Spectral Data Fusion for Robust ECG-derived Respiration with Experiments in Different Physical Activity Levels.
DOI: 10.5220/0006144100880095
In Proceedings of the 10th International Joint Conference on Biomedical Engineering Systems and Technologies (BIOSTEC 2017), pages 88-95
ISBN: 978-989-758-213-4
Copyright
c
2017 by SCITEPRESS – Science and Technology Publications, Lda. All rights reserved

nals with the reference breathing phase recorded from
both plethysmography and nasal air flow signals. The
third paper (Cysarz et al., 2008), compares the perfor-
mance of the estimated breathing rate derived from
RPA and RRI signal with the actual values and exper-
imented on a database consisting of sleep and wake
data. The first paper claims that spectral-based EDR
estimation cannot produce accurate results and time-
domain advanced counting method is a more stable
alternative for the EDR problem which could offer
higher correlation. The second paper, concludes that
the correlation coefficient between AUR based EDR
and plethysmography signal is 0.56 after temporal de-
lay matching, making AUR superior to both the RPA
and the RSA by more than 0.05. One limitation of the
study is the small data set that they have experimented
with. The authors of the third paper found fairly de-
cent agreement (concordance correlation coefficient
of 0.41 to 0.79 within different age groups) between
the EDR estimation and reference respiration. They
also noted that RSA components strength weaken for
people over 50 years old which is in agreement with
the findings of the first paper.
Although fairly good correspondence has been
achieved with rather inactive subjects, morphologi-
cal variation of ECG that is generated by respiration-
related chest movement can be contaminated by a
person’s movement, body position changes, and up-
per/lower limb motions; especially during sport activ-
ities. Consequently, there is a clear need for a robust
EDR method that can tolerate such interference and
remain reliable.
The aforementioned EDR methods estimate the
respiration from the ECG derived quantities rather di-
rectly. More advanced techniques have been proposed
in search for a more dependable EDR method to be
able to assess breathing frequency or rhythm more ro-
bustly. Decomposition-based EDR methods, includ-
ing principal component analysis (PCA) and kernel
PCA, were investigated in (Widjaja et al., 2012). In
addition, adapted PCA and independent component
analysis (ICA) were utilized in (Tiinanen et al., 2009;
Tiinanen et al., 2015) to extract the RSA compo-
nent from RRI signal and subsequently estimate the
breathing rate of subjects. Recently, a robust tech-
nique was published in (Orphanidou et al., 2013),
which they proposed a selective framework that eval-
uates both RPA and RRI signals selecting the one
with more strongly modulated respiratory component.
They represented the filtered RPA and RRI signals
with auto regressive (AR) models. An AR model con-
siders the signal to be characterized by a number of
spectral poles. They picked the pole within the res-
piratory band with higher magnitude as the estimated
breathing frequency. This model assumes that pole
magnitude is a metric for the signal quality and ap-
parently higher quality signal contains distinctive res-
piratory fluctuation. They claimed that this selective
framework outperforms EDR estimations compared
to individual RPA and RRI signal by 0.5 and 0.02 unit
of mean absolute error (MAE), respectively, in young
subjects and 0.14 and 0.13 unit within elderly sub-
jects.
In order to address EDR throughout sport activi-
ties, it should be noted that apart from potential ar-
tifacts during such measurements, physiological car-
diolocomotion coupling (CLC) component is intro-
duced in the heart activity. It is already reported that
there is a coupling between locomotor,respiration and
heart (Nomura et al., 2003). CLC is caused by the ca-
dence of running, walking or activities which involves
limb movement and exterior impacts from floor com-
ing toward body. The rhythmic cadence of subjects
alters HRV signal in a periodic manner, by influenc-
ing muscle pump on the circulatory system and car-
diac reflexes (Novak et al., 2007). This makes EDR
estimation an even more challenging problem during
mobile activities, particularly at higher exercise inten-
sities.
Although EDR is an old-standing topic in physi-
ological signal analysis, the performance of methods
during typical daily activities, specifically household
and sport activities, is not very well-examined in the
literature. Our goal in this paper is to evaluate widely-
used EDR techniques and propose a preliminary ro-
bust framework for instant breathing rate estimation
throughout uncontrolled ambulatory condition where
a mobile subject performs daily activities. We ana-
lyze the signals in a robust way to extract the most
correlated component to the instant respiratory fre-
quency. To this extent, we are using a fusion tech-
nique to make the system redundant, in case artifact,
CLC or any other components alter the extracted in-
stantaneous respiratory estimation.
2 MATERIALS AND METHODS
In this section, the construction of signals expected
to contain respiratory frequency information is ex-
plained. The modeling of signal’s spectral content us-
ing AR time-frequency model and their adjustments,
as well as the fusion of information acquired by indi-
vidual sources are described.
Spectral Data Fusion for Robust ECG-derived Respiration with Experiments in Different Physical Activity Levels
89

2.1 Calculation of RRI, RPA and MSV
Single-channel ECG is recorded concurrently with a
spirometer signal. In the subsequent ECG processing,
there are some steps that are followed before extrac-
tion of RRI, RPA and MSV signals.
Firstly, baseline wander reduction has been per-
formed using a second-order Savitzky-Golay filter
with one second window. The filter fits a polynomial
function with the given order on each frame of ECG
data minimizing the least-squares error, and replaces
the considered sample with the fitted value. We as-
sume that the fitted function follows the baseline of
the ECG signal closely. Therefore, we subtract the
baseline from the ECG.
Secondly, the R-peaks of the ECG are detected.
We passed the signal through a 20th-order high-pass
Butterworth IIR filter using a zero-phase digital fil-
tering technique to suppress P and T waves and keep
R waves steady. The output of filter is explored (us-
ing MATLAB findpeaks function) for peaks with spe-
cific criteria, including passing a minimum amplitude,
minimum peak prominence and peak separation. Ap-
plied constraints filter the detected local maximas to
R-peaks.
Thirdly, the results of R-peak detection are used
in the calculation of derived quantities. The RRI sig-
nal is obtained from the successive R-peak time stamp
differences as RR
i
, where the ith value of this signal
is equal to the difference of ith and i+ 1th time stamp
of R-peaks. However, the detection of some ectopic
beats or false beats is likely when the subjects are per-
forming exercise and daily activities freely. To coun-
teract this, ectopic/false beat detection and editing is
conducted using the following procedure:
1. Detect and reject the obvious outliers (RR
i
≤
200ms or RR
i
≥ 2000ms). Such intervals are rare
in a healthy subject’s heart rhythm due to physio-
logical considerations.
2. Estimate short term RRI level by fitting a smooth-
ing spline function on the signal, and consider the
absolute difference between the actual RRI val-
ues and the smoothed one as an indicator on how
much the RRI deviates from the local level.
3. Detect ectopic/false beats as those with RR
i
s with
large deviation from the short term RRI level.
More precisely, mark the ones which deviate both
more than 50ms and also more than 95th per-
centile of all deviations from the spline.
4. Interpolate over ectopic/false and outlier beats
with spline interpolation, to preserve the number
of beats of the initial detection.
Using the aforementioned procedure, it is assured
that less than 5% of the RR
i
s are edited. Accord-
ingly, the RPA signal can be constructed from the
ECG amplitudes at R-peak instants. The construc-
tion of MSV is explained comprehensively in (Nopo-
nen et al., 2012). Initially, a 50ms window is defined
symmetrically around detected R-peak locations. It
is followed by the collection of all QRS complexes
within the window in a matrix and a definition of a
statistical mean shape as a template for the scale vari-
ation measure. The candidate QRS complexes are
projected into the template and the scale difference
between them is considered as MSV signal.
Finally, we use an 8Hz spline interpolation to have
uniformly sampled signal in further spectral analysis.
A sample of ECG segment as well as constructed and
interpolated signals are depicted in Figure 1.
29 30 31 32 33 34 35 36
Amplitude
-200
0
200
400
600
ECG
R peak
29 30 31 32 33 34 35 36
Time [ms]
400
600
800
Tachogram
Interpolated RRI
29 30 31 32 33 34 35 36
Amplitude
400
500
600
R-Peak Amplitude
Interpolated RPA
Time [s]
29 30 31 32 33 34 35 36
0.6
0.8
1
MSV
Interpolated MSV
Figure 1: A segment of ECG with constructed signals. Top
most sub-figure shows the ECG segment in blue and R-
peak annotations are expressed by red stars. The second
sub-figure shows original RRI samples. RPA signal is de-
picted in the third sub-figure and MSV time series in the
fourth sub-figure. In the last three sub-figures, the interpo-
lated samples are marked in red, and original values in blue.
2.2 Spectral Analysis
We are aiming to extract instant breathing frequency
from the constructed signals. Usually, breathing
rate of a healthy subject in normal condition varies
roughly between 10 to 36 breaths per minute (bpm),
while in our application where the subjects are ex-
ercising or performing activities, the breathing rate
might be over 60bpm. Therefore, we use a rela-
tively wide band-pass filter with low and high cut-off
frequencies of 0.15Hz and 1.2Hz corresponding to
9bpm and 72bpm. Figure 2 shows the frequency re-
sponse of the band-pass filter.
HEALTHINF 2017 - 10th International Conference on Health Informatics
90

Normalized Frequency (×π rad/sample)
0 0.1 0.2 0.3 0.4 0.5 0.6 0.7 0.8 0.9
Magnitude (dB)
-70
-60
-50
-40
-30
-20
-10
0
Phase (radians)
-135.478
-115.519
-95.559
-75.6
-55.641
-35.682
-15.723
4.236
Figure 2: The magnitude and phase response of the FIR
filter used to keep the spectral content of signals within the
possible respiratory frequency. 60dB and 1dB is adjusted
as the stop- and pass-band attenuation. Sampling frequency
is 8Hz and the x-axis is the normalized frequency.
2.2.1 AR Model
Physiological signals are principally non-stationary,
which requires specific tools for spectral analysis. In
this study, according to (Thayer et al., 2002; Or-
phanidou et al., 2013) recommendation, we have used
12th-order AR model on 20-second segments of data
which has 19 seconds overlap with adjacent windows.
This model considers an all-pole transfer function to
describe the frequency distribution of signal. The
higher the order of AR model, the more poles are used
for the signal description. A sample AR model out-
come is illustrated in Figure 3.
Time[s]
40 45 50 55
Time[s]
-0.5
0
0.5
1
Frequency [Hz]
0 1 2 3 4
PSD
0
0.2
0.4
0.6
0.8
Real Part
-1 0 1
Imaginary Part
-2
-1.5
-1
-0.5
0
0.5
1
1.5
2
1
2
2
1
Figure 3: A 20-second segment of interpolated and filtered
RRI signal is fed to the AR model and output zero-pole plot
is depicted in the right unity circle. Lower left sub-figure
illustrates the power spectral density (PSD) of the upper left
RRI time series. The local trends of the PSD labeled by 1
and 2 are constructed as a result of poles labeled by 1 and 2
in the z-plane. These two poles are higher in magnitude and
closer to unity circle which means they have stronger effect
on the construction of PSD curve.
To derive the respiratory frequency from the spec-
trum, in the case of a single source EDR using RRI,
RPA or MSV, we find the frequency bin having high-
est power spectral density. For instance in the lower
left sub-figure of Figure 3, the frequency value of sig-
nal marked as 1 is considered as the respiratory fre-
quency for this segment of data.
2.3 Fusion of PSDs
According to the EDR literature, the power spec-
tra of RRI, RPA and MSV signals within a short
time window are expected to contain energy at or
near the instantaneous respiratory frequency. In ad-
dition, the respiratory component is expected to usu-
ally be strong in the sense that spectral power levels
around the respiratory frequency are higher than the
background levels in each spectrum. However, the
spectra are expected to also contain other peaks ris-
ing from noise/artifacts, CLC, nonlinearities, and also
side lobes induced by amplitude and/or frequency
modulation by physiological feedback loops such as
the control of heart rate through RSA, for instance.
Due to the different nature of RRI, RPA, and MSV,
it can be assumed that the strength of the aforemen-
tioned other factors varies between their spectra, but
the respiration component should be present in all or
most of them. Thus, it makes sense to attempt to find
significant energy bands or peaks that are present in
all of the spectra. What is more, even when the res-
piratory component is present in all of them, the re-
dundant combination can be used to narrow down the
actual respiratory frequency as the resolving power of
individual spectra depends on the width/peakedness
of the spectral peak that can vary.
In this paper, we approach the issue via spectral
domain fusion that strengthens the joint spectral com-
ponents and diminishes the ones not shared with other
spectra. We hypothesize that the fusion will be ad-
vantageousin instantaneousbreathing rate estimation.
Let’s assume that the spectrogram of constructed sig-
nals can be expressed as:
P
sig
=
p
sig
1,1
p
sig
1,2
··· p
sig
1,n
p
sig
2,1
p
sig
2,2
··· p
sig
2,n
.
.
.
.
.
.
.
.
.
.
.
.
p
sig
m,1
p
sig
m,2
··· p
sig
m,n
(1)
where sig could be RRI, RPA or MSV signal. Every
column in the spectrogram corresponds to the PSD of
signal in a specific 20-second time window which has
one second difference with the consecutive columns
of matrix and every row, to the lied energy at specific
frequency band. In the fusion matrix, we compute
the product of these arrays element-by-element. It
should be noted that these PSDs contain the same
number of values. Thus, the fusion spectrogram can
be stated as:
Spectral Data Fusion for Robust ECG-derived Respiration with Experiments in Different Physical Activity Levels
91

P
fus
=
p
rri
1,1
.p
rpa
1,1
.p
msv
1,1
p
rri
1,2
.p
rpa
1,2
.p
msv
1,2
··· p
rri
1,n
.p
rpa
1,n
.p
msv
1,n
p
rri
2,1
.p
rpa
2,1
.p
msv
2,1
p
rri
2,2
.p
rpa
2,2
.p
msv
2,2
··· p
rri
2,n
.p
rpa
2,n
.p
msv
2,n
.
.
.
.
.
.
.
.
.
.
.
.
p
rri
m,1
.p
rpa
m,1
.p
msv
m,1
p
rri
m,2
.p
rpa
m,2
.p
msv
m,2
··· p
rri
m,n
.p
rpa
m,n
.p
msv
m,n
(2)
P
fus
basically gives a joint spectrogram which
considers the agreement between individual spectro-
gram trends as well as their strength. The frequency
bin where the maximum energy is settled at each time
instant, is selected as the estimated respiratory fre-
quency. In case there is a correlation between at least
two of the signal’s PSDs with sufficient strength, the
fusion PSD also offers the same trend in the fusion
spectrum. However, if there is no correlation between
PSDs, the fusion spectrum is affected by the PSD with
higher energy. In other words, the fusion method intu-
itively considers the signal with stronger component
as suggested in (Orphanidou et al., 2013) and also de-
cides in a cooperative manner.
1550 1600 1650 1700 1750 1800
Time[s]
0
0.5
1
1550 1600 1650 1700 1750 1800
0
0.5
1
1550 1600 1650 1700 1750 1800
0
0.5
1
Frequency [Hz]
0.1
0.2
0.3
0.4
0.5
0.6
0.7
0.8
0.9
1
1550 1600 1650 1700 1750 1800
0
0.5
1
Figure 4: A sample 100-second spectrogram of the con-
structed signals plus the fusion spectrogram. All the spec-
trograms are normalized at each time instant for better visu-
alization. The top most sub-figure illustrates RRI, the sec-
ond top is RPA and the third row shows the MSV normal-
ized spectrogram and the bottom sub-figure is the normal-
ized fusion spectrogram.
It is conceivable that in specific cases and time in-
stants other combinations of spectrograms – such as
the joint product of a certain pair of them – may yield
better performance than the product triplet. Neverthe-
less, we expect the presented approach, in which the
element-wise multiplication is taken over all the three
spectrograms, to perform better on average. Thus, in
the following, we consider only the fusion (2) that
combines RRI, RPA, and MSV spectrograms.
In Figure 4, the normalized spectrograms of a
sample RRI, RPA and MSV signals taken at the same
time are depicted. The normalized fusion spectro-
gram is illustrated in the last sub-figure. Wide distri-
bution of energy in some parts of individual spectro-
grams is visible, while the fusion spectrogram (bot-
tom sub-figure) earns the common component be-
tween the individual spectrums and is considerably
narrower.
2.4 Database
Since, in this study, we are aiming to evaluate the per-
formance of our instantaneous respiratory frequency
estimation methods during uncontrolled ambulatory
measurements where the subjects can freely perform
their daily activities, we have collected 67 subjects
(30 female and 37 male) aged from 18 to 60 years
old during household and sport activities. The overall
general physiological characteristics of subjects are
stated in Table 1.
Table 1: General characteristics of subjects participated in
this experiment.
Characteristic mean min max
Height (cm) 175 160 195
Weight (Kg) 75.4 45.6 122.8
Age (Years) 37.9 18 60
BMI (Kg/m
2
) 24.51 14.72 35.5
The ECG signal is recorded using an available
commercial electrode belt in the market and up-
sampled to 1kHz for HRV analysis and the spirometer
data is collected at the rate of one sample per second.
The household activities are comprised of four
minutes of floor sweeping (FS) followed by four min-
utes of table cleaning (TC). The sports activity part of
the protocol consists of 10 minutes of cycling (CY)
on an ergometer, followed by four minutes of Tennis
playing (TN) in a gym hall. During these activities,
both spirometer and single-channel ECG data are col-
lected. The relative intensity level of four activity pro-
tocols is given in Table 2 as the overall percentage of
maximal heart rate (HR
max
) of subjects in that specific
activity.
Table 2: Overall intensity of activity protocols as a percent-
age of HR
max
.
Activity Protocol mean min max
FS 52 35 73
TC 50 34 77
CY 66 48 83
TN 81 63 90
HEALTHINF 2017 - 10th International Conference on Health Informatics
92
Time [s]
142 144 146 148 150 152 154 156 158 160
-2
-1
0
1
2
RRI
RPA
MSV
Frequency [Hz]
0 0.2 0.4 0.6 0.8 1 1.2
PSD
0.5
1
1.5
2
RRI
RPA
MSV
Fusion
Ref
Real Part
-1 0 1
Imaginary Part
-1
-0.5
0
0.5
1
12
Real Part
-1 0 1
Imaginary Part
-1
-0.5
0
0.5
1
12
Real Part
-1 0 1
Imaginary Part
-1
-0.5
0
0.5
1
12
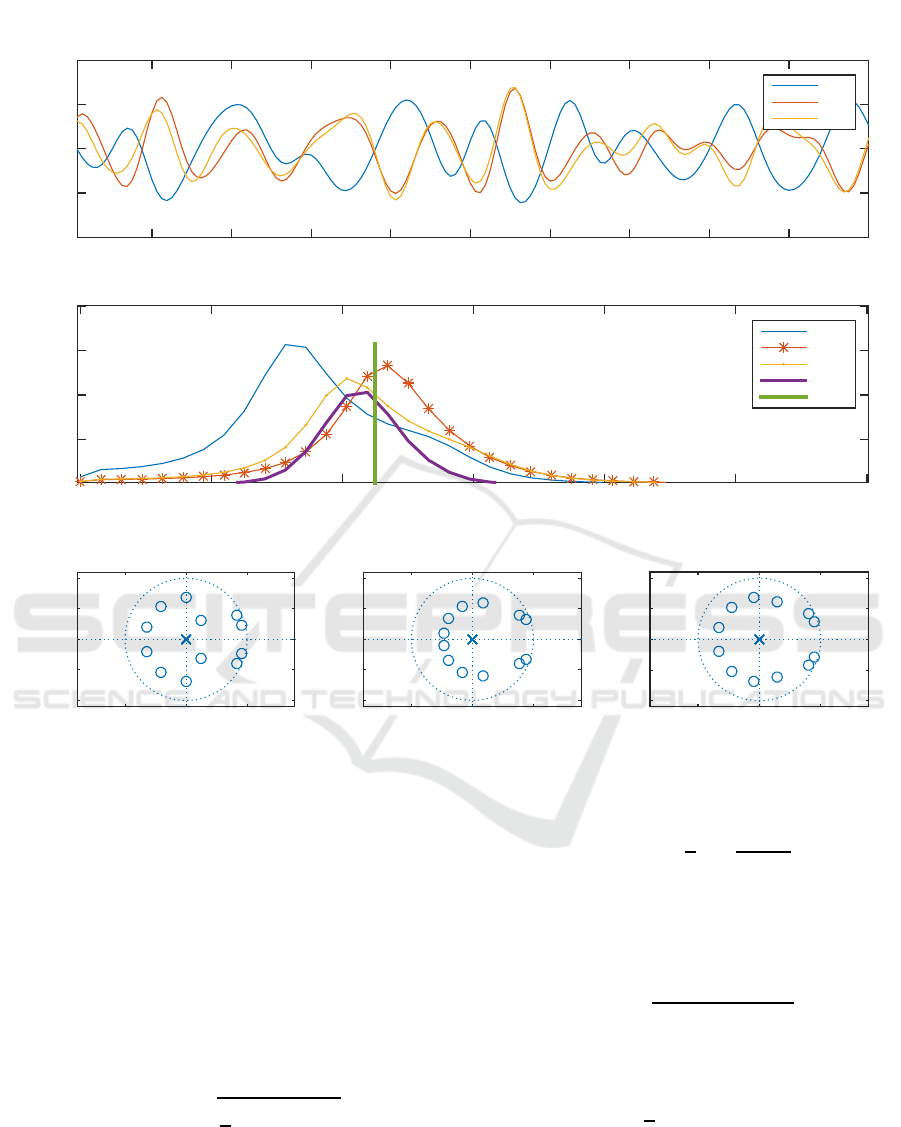
Figure 5: A 20-second sample household activity data including interpolated and filtered RRI, RPA and MSV signal as well
as their PSD in the middle sub-figure. The last sub-figure shows RRI, RPA and MSV z-plane, respectively, from left to right.
3 RESULTS
3.1 Performance Measures
Let’s assume that our estimated breathing frequency
is expressed as x and the original respiratory fre-
quency as y and n is the number of samples, in order
to assess our estimation results, the following metrics
are computed:
• Root Mean Square Error:
RMSE =
s
1
n
n
∑
j=1
(x
j
− y
j
)
2
(3)
• Mean Absolute Percentage Error: MAPE weights
frequency of respiration. Basically, it considers a
larger error margin in higher breathing rate esti-
mation.
MAPE =
1
n
n
∑
j=1
|
x
j
− y
j
y
j
| (4)
• Concordance Correlation Coefficient: It is a reli-
able measure to evaluate the agreement between
two sets of signals. It can be computed using
R
c
=
2S
xy
S
2
x
+ S
2
y
+ ( ˆy− ˆx)
2
(5)
where ˆx and ˆy are the average frequency of esti-
mated and original signals and
S
xy
=
1
n
n
∑
j=1
(x
j
− ˆx)(y
j
− ˆy) (6)
and S
x
and S
y
are the standard deviation of x and
y, respectively.
Spectral Data Fusion for Robust ECG-derived Respiration with Experiments in Different Physical Activity Levels
93

3.2 Quantitative Results
Figure 5 illustrates a 20-second sample data. It shows
the signals, their frequency components distributions
and specification of poles. In the middle sub-figure,
three PSDs as well as computed fusion PSD are de-
picted. Reference respiratory frequency is also ex-
pressed by a straight green line. Instant breathing
rate estimation using PSD is corresponded to the fre-
quency where maximum energy is settled.
Table 3 summarizes the results of the methods
used in four activity protocols. The data shows that
the fusion method outperforms the individual meth-
ods in all the four protocols considering different met-
rics. The performance of EDR derived from RRI
signal (RSA-based breathing frequency estimation) is
the weakest compared to other two individual signals
particularly in sport activities. It might be due to the
reason that RRI signal is more vulnerable to CLC or
movement artifacts during high intensity exercise.
Table 3: Acquired overall results in four different activity
protocols.
Spect Metric
Activity
FS TC CY TN
RMSE 6.2 5.4 5.3 8.3
RRI MAPE 19.0 18.0 16.0 18.0
Rc 0.23 0.19 0.39 0.33
RMSE 5.0 4.5 3.4 6.9
RPA MAPE 16.0 15.0 10.0 15.0
Rc 0.2 0.18 0.57 0.39
RMSE 4.7 4.4 3.7 6.4
MSV MAPE 15.0 14.0 11.0 13.0
Rc 0.25 0.19 0.5 0.43
RMSE 4.6 4.1 2.9 6.4
Fusion MAPE 14.0 13.0 8.8 13.0
Rc 0.28 0.24 0.57 0.45
4 CONCLUSION
Ambulatory measurement of instantaneous respira-
tory frequency can be achieved via ECG surrogate
signal processing. However, the performance of
breathing rate estimation during uncontrolled condi-
tion when the subject is free to move and perform
his/her daily activities is in question and not well-
studied. This paper proposed a spectral fusion tech-
nique which combines the information from individ-
ual sources of EDRs, such as RSA-based (RRI sig-
nal) and morphological-based (RPA and MSV sig-
nals), to boost the performance of estimation us-
ing computationally-efficient methods. In essence,
the presented method considers the agreement be-
tween the individual estimators and their joint spec-
tral power. Overall, our fusion method outperforms
the individual methods considering all the metrics and
experimented activity protocols.
REFERENCES
Correa, L. S., Laciar, E., Torres, A., and Jane, R. (2008).
Performance evaluation of three methods for respi-
ratory signal estimation from the electrocardiogram.
In 2008 30th Annual International Conference of the
IEEE Engineering in Medicine and Biology Society,
pages 4760–4763. IEEE.
Cysarz, D., Zerm, R., Bettermann, H., Fr¨uhwirth, M.,
Moser, M., and Kr¨oz, M. (2008). Comparison of res-
piratory rates derived from heart rate variability, ecg
amplitude, and nasal/oral airflow. Annals of biomedi-
cal engineering, 36(12):2085–2094.
Moody, G. B., Mark, R. G., Bump, M. A., Weinstein, J. S.,
Berman, A. D., Mietus, J. E., and Goldberger, A. L.
(1986). Clinical validation of the ecg-derived respira-
tion (edr) technique. Group, 1(3).
Moody, G. B., Mark, R. G., Zoccola, A., and Mantero, S.
(1985). Derivation of respiratory signals from multi-
lead ecgs. Computers in cardiology, 12(1985):113–
116.
Nomura, K., Takei, Y., and Yanagida, Y. (2003). Compar-
ison of cardio-locomotor synchronization during run-
ning and cycling. European journal of applied physi-
ology, 89(3-4):221–229.
Noponen, K., Tiinanen, S., and Sepp¨anen, T. (2012). De-
riving respiration from the electrocardiogram by serial
comparison with statistical mean shape. In 2012 Com-
puting in Cardiology, pages 809–812. IEEE.
Novak, V., Hu, K., Vyas, M., and Lipsitz, L. A. (2007).
Cardiolocomotor coupling in young and elderly peo-
ple. The Journals of Gerontology Series A: Biological
Sciences and Medical Sciences, 62(1):86–92.
Orphanidou, C., Fleming, S., Shah, S. A., and Tarassenko,
L. (2013). Data fusion for estimating respiratory rate
from a single-lead ecg. Biomedical Signal Processing
and Control, 8(1):98–105.
Sch¨afer, A. and Kratky, K. W. (2008). Estimation of breath-
ing rate from respiratory sinus arrhythmia: compari-
son of various methods. Annals of Biomedical Engi-
neering, 36(3):476–485.
Thayer, J. F., Sollers III, J. J., Ruiz-Padial, E., and Vila,
J. (2002). Estimating respiratory frequency from au-
toregressive spectral analysis of heart period. IEEE
Engineering in Medicine and Biology, 21(4):41–45.
Tiinanen, S., Noponen, K., Tulppo, M., Kiviniemi, A., and
Sepp¨anen, T. (2015). Ecg-derived respiration meth-
ods: Adapted ica and pca. Medical engineering &
physics, 37(5):512–517.
HEALTHINF 2017 - 10th International Conference on Health Informatics
94

Tiinanen, S., Tulppo, M., and Sepp¨anen, T. (2009). Rsa
component extraction from heart rate signal by inde-
pendent component analysis. In 2009 36th Annual
Computers in Cardiology Conference (CinC), pages
161–164. IEEE.
Widjaja, D., Varon, C., Dorado, A., Suykens, J. A., and
Van Huffel, S. (2012). Application of kernel prin-
cipal component analysis for single-lead-ecg-derived
respiration. IEEE Transactions on Biomedical Engi-
neering, 59(4):1169–1176.
Spectral Data Fusion for Robust ECG-derived Respiration with Experiments in Different Physical Activity Levels
95
