
Using HL7 and DICOM to Improve Operational Workflow Efficiency
in Radiology
Thusitha Mabotuwana and Christopher S. Hall
Radiology Solutions, Philips Healthcare, Seattle, WA, U.S.A.
Keywords: DICOM, HL7, Medical Informatics Applications, PACS, Radiology Analytics, Radiology Informatics,
Radiology Workflow.
Abstract: Radiology departments are increasingly asked to do more with less annual budget and to remain competitive
while managing bottom lines. Identifying opportunities to improve workflow efficiency is an important aspect
of managing a department and reducing associated costs. Workflow enhancement tools can be built by making
use of HL7 and DICOM messages that are directly related to various workflow steps. In this paper, we discuss
the importance of using both HL7 and DICOM to determine more accurate metrics related to granular
workflow operations, such as distinguishing between billing and operational exam volumes. Using a
production dataset, we also demonstrate how visualization can be used to provide better visibility into routine
radiology operations.
1 INTRODUCTION
For many years, a hospital’s radiology department
has functioned as a key profit center. In 2007,
radiology accounted for 37% of outpatient profit,
defined as revenue less direct costs, making imaging
the most valuable hospital outpatient service line (The
Advisory Board Company 2008). However, with
significant increases to healthcare related spending in
recent years, projected to be close to 20 percent of the
US GDP by 2024 (Centers for Medicare & Medicaid
Services), there has been a strong emphasis towards
moving away from the traditional fee-for-service
model to alternative reimbursement models.
In the traditional fee-for-service payment model,
providers are reimbursed by insurers for each service
provided. Unnecessary imaging alone is reported to
waste at least $7 billion annually in the US (peer60).
Since each service gets reimbursed, there is no major
incentive for hospitals to minimize costs associated
with these tests while the insurer has an open-ended
economic risk. On the other hand, with capitated
payment models, the economic risk shifts to the
hospital since the hospital only gets reimbursed a
fixed amount to treat a specific condition (Centers for
Medicare & Medicaid Services). With specific
healthcare reforms currently underway in the US,
there has been a strong focus toward integrated care
delivery while reducing costs – for instance, under the
new Accountable Care Organization payment model,
starting from 1
st
April 2016, hip and knee replacement
payments will be based not only on the procedures
performed, but on the quality of care delivered as well
(Centers for Medicare & Medicaid Services).
Similarly, starting from around 2011, various
radiology procedures have been getting paid under
‘bundled codes’ when two or more related studies are
performed together.
The American College of Radiology routinely
monitors changes to radiology-related payments and
recently reported that the bundled code payments are
falling short of the payment levels of the predecessor
codes and values; for instance, computed tomography
(CT) abdomen-pelvis without contract exams were
paid at $418.43 prior to using bundled codes; in 2013,
under the bundled payment model this was reduced to
$306.05 and in 2014, this was further reduced to
$241.79. With such changes to reimbursements, and
in an attempt to reduce costs associated with
unnecessary imaging, radiology has gradually been
shifting from one of the primary profit-centers for a
hospital to a cost-center. Radiology departments are
increasingly being asked to do more with less annual
budget and to remain competitive and manage bottom
lines. Radiology departments need to optimize quality
of care, patient experience, outcomes, efficiency and
throughput while reducing costs.
Mabotuwana T. and Hall C.
Using HL7 and DICOM to Improve Operational Workflow Efficiency in Radiology.
DOI: 10.5220/0006138900570065
In Proceedings of the 10th International Joint Conference on Biomedical Engineering Systems and Technologies (BIOSTEC 2017), pages 57-65
ISBN: 978-989-758-213-4
Copyright
c
2017 by SCITEPRESS – Science and Technology Publications, Lda. All rights reserved
57
An important aspect of managing a radiology
department is to have meaningful insights into the
routine operations. This could include fairly
straightforward metrics such as the total number of
billable exams and exams by modality over a
particular time period. However, to identify workflow
improvement opportunities it is important to gain
visibility into the more granular metrics, such as the
difference between billing and operational volume,
total patient encounter duration, imaging systems
utilization and number of scans by hour of day and/or
day of week.
In this paper we discuss a generic approach using
two established healthcare information exchange
standards, Health Level Seven (HL7) and Digital
Imaging and Communications in Medicine
(DICOM), to determine metrics important to the
operations in a radiology department. The main
contribution is the linking of HL7 and DICOM to
determine granular workflow steps and the discussion
around specific radiology workflow nuances.
2 METHODS
2.1 Background
Healthcare vendors have embraced the rapid uptake
of technology in healthcare and as a result, most
hospitals have clinical systems from different vendors
to accommodate the needs of various departments –
for instance, a computerized physician order entry
system (CPOE) may be used for order entry, a
hospital information system (HIS) for patient
registration, a radiology information system (RIS) for
radiology specific functions, an EMR for medical
records, a scheduler for scheduling appointments, a
billing system for accounting purposes, dictation
systems for creating reports and a picture archiving
and communication system (PACS) for imaging
related tasks. To provide integrated patient care, these
different clinical systems need to communicate with
each other. HL7 messaging standard is arguably the
most widely implemented standard for
interoperability in healthcare across the world and
allows for the exchange of clinical data between
disparate systems (HL7 2016). Similarly, DICOM
(The DICOM Standard) is the de facto standard for
exchanging medical images. Although system-to-
system direct communication may be possible,
hospitals often use an HL7 interface engine (HL7
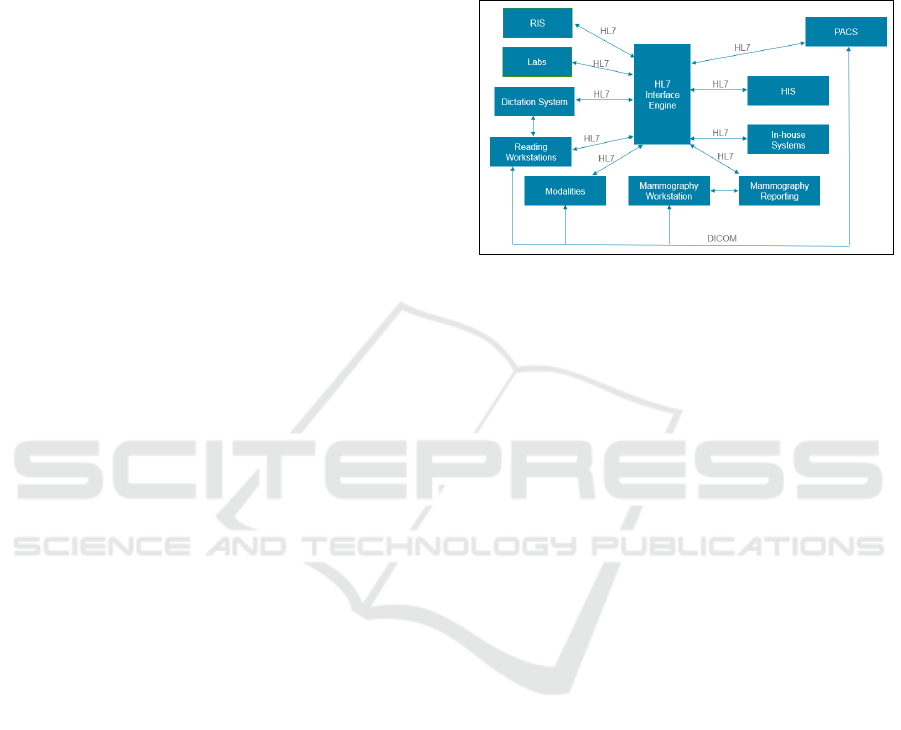
2016) to facilitate information exchange. Figure 1
shows a typical hospital configuration, with a focus
on radiology – often, mammography requires
dedicated workstations compared to other modalities,
such as X-ray (XR) and CT, and as such, is shown
separately. In-house systems would typically provide
some form of aggregated patient view that combines
information from RIS, HIS and laboratory
information system.
Figure 1: Overview of communication between various
clinical systems.
With recent incentives towards increased system
interoperability, facilitated by healthcare reforms
(e.g., Meaningful Use Stage 2 (HealthIT.gov 2015)),
hospitals have been moving towards enterprise
electronic health record systems (EHRs) to improve
patient care by facilitating sharing of patient data that
is typically distributed across multiple clinical
systems, and also improve workflow efficiency (e.g.,
EHRs have a single sign-on where disparate systems
will require multiple sign-ons for the same user).
However, most clinical systems are ‘closed-systems’
where the data is not directly accessible to external
parties, and often, even to hospital IT administrators.
As such, developing tools based directly on HL7 and
DICOM can have widespread applicability
irrespective of the individual hospital setting.
2.2 Reporting for Operational
Excellence
There are various systems already in place to provide
routine operational reports to radiology department
managers, often at a cost center level to which
budgets are allocated – definition of a cost center can
vary depending on the hospital, but for radiology, it is
usually one or more modalities. For instance, high
volume modalities such as CT would be a standalone
cost center whereas ultrasound (US), nuclear
medicine and vascular imaging could be combined
into a single cost center. Routine reports may not
always be sufficient for operational purposes; for
instance, it may be useful to know the machine
utilization of a shared US machine and using a cost
HEALTHINF 2017 - 10th International Conference on Health Informatics
58
center based approach will not capture all exams
performed on this resource. Additionally, there are
often exams which are split into two or more billing
codes although they occupy one scheduled slot.
Karami discusses a comprehensive list of metrics
important for radiology across seven main categories
(Karami 2014) while other investigators (Morgan,
Branstetter et al. 2008, Cook and Nagy 2014) have
discussed the importance of analytics and other
business intelligence software for radiology. The
underlying data source for systems that provide such
capabilities can be broadly categorized as:
1. Systems used directly in workflow – these
systems are used during routine operations and
would include systems such as the EHR, RIS,
HIS and PACS. Data is entered directly into
these systems.
2. Third-party software that subscribe to HL7
messages – these systems are often setup as a
‘listener node’ where a copy of all, or a
selected subset, of HL7 messages will be sent
to, often via the HL7 interface engine. Having
an interface engine is not so common for
DICOM since PACS is often the only
destination for images.
3. Third-party software that integrate with
systems used in workflow – these systems
often have closely-coupled integration with
systems used directly in workflow. For
instance, a new CT dose monitoring software
application may be installed in a hospital as a
new DICOM node and all CT machines can be
configured to forward a copy of DICOM
structured report (which is a way to analyze
dose-related data for CT) to this node.
Due to the specialized nature of clinical software,
most of the systems often consume only HL7 or
DICOM. However, as discussed later in the paper,
there are significant benefits to linking data from
these two sources for more accurate metric
calculation.
2.3 Overview of HL7
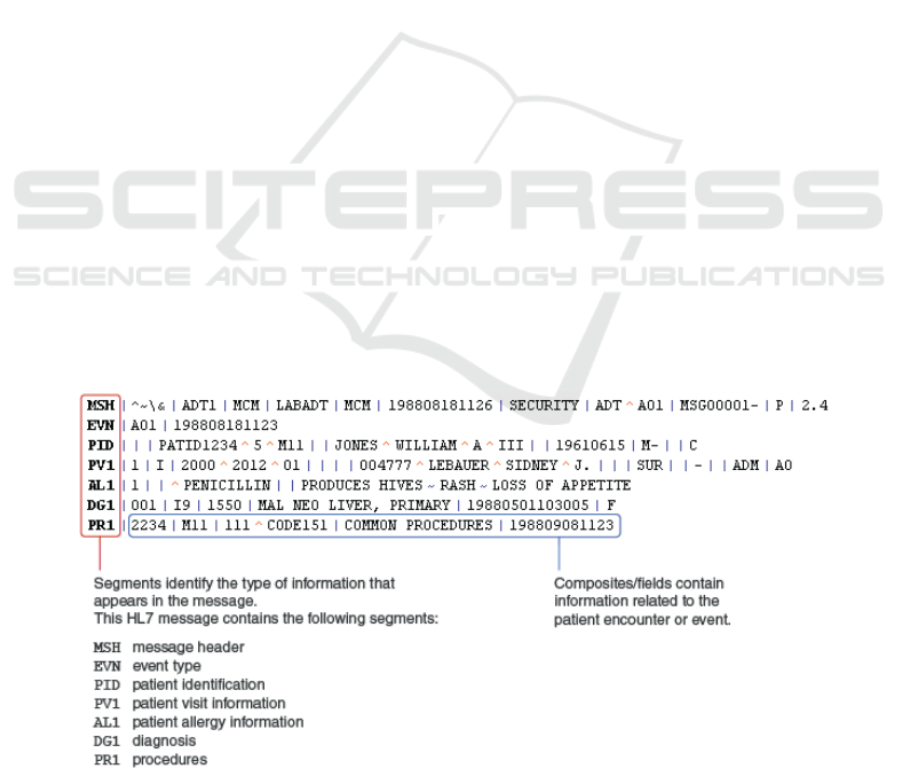
An HL7 message is composed of a series of segments
with each segment identifying the type of information
the message contains (e.g., patient demographics,
lab/observation result, diagnosis, insurance and next
of kin). In turn, each segment includes one or more
composites (also referred to as “fields”) that contain
the actual information (such as names and result
values). Composites can contain sub-composites (or
sub-fields) – for instance, patient name is a composite
within the ‘PID’ segment and can contain over six
sub-composites (such as family name, given name,
middle name and suffix). Composites are typically
separated by a “|” character, while sub- composites
are usually separated using “^”.
Each HL7 message starts with a message header,
corresponding to segment MSH, and defines the
message’s source, purpose, destination, and other
syntax specifics like composite delimiters. MSH field
9, denoted by MSH-9, is particularly important since
this specifies the type of message that is being
transmitted (such as ADT, ORM, ORU, ACK and so
on (HL7 2016)). The segments present in a given
message vary depending on the type of message that
is being transmitted. For instance, Figure 2 shows the
composition of an ADT message (used to convey
information related to patient admission, discharge
Figure 2: Components of an HL7 ADT message for a fictitious patient (Altova 2016).
Using HL7 and DICOM to Improve Operational Workflow Efficiency in Radiology
59
and transfers) containing seven segments (MSH,
EVN, PID and so on).
Similar to the number of segments within a
message type, the number of fields present within a
segment can vary as well. For instance, the PID
segment can contain over 30 different fields, although
it is common for the segments to terminate after the
last non-empty field (corresponding to value “C” in
Figure 2).
2.4 Overview of DICOM
DICOM is a specification for creation, transmission,
and storage of medical images and report data (The
DICOM Standard). In addition to the binary pixel
data, all DICOM files contain metadata related to
patient (e.g., name, gender and date of birth),
acquisition setup (e.g., type of equipment used and
settings such as source IP address and machine
name), and study (such as study
description). Metadata is contained in the DICOM
header which is essentially a list of key-value pairs –
the keys are standardized values in hexadecimal. As
an example, tag (0008,1030) corresponds to the study
description.
2.5 Typical Radiology Workflow and
Information extraction from HL7
and DICOM
At a high level, once a referring physician has ordered
an imaging exam, the exam gets scheduled (after
necessary pre-procedure steps are completed, such as
pre-authorization from insurance). Each imaging
exam will be associated with one imaging order.
When the patient arrives at the radiology department,
the front desk staff would typically ‘arrive’ the patient
in the EHR (could be the RIS or some other system
depending on the hospital configuration). At this
point, the technologist knows that the patient has
arrived for the scan (this could be by looking at a
‘technologist view’ in the EHR/‘modality worklist’,
or some other means, such as the front desk staff
printing out a ‘patient requisition form’ and handing
over to a technologist). When the technologist is
ready for the patient, he/she will go to the patient
waiting area and call for the patient. After explaining
the process, the technologist will start preparing the
patient for the scan, for instance, by giving oral
contrast if needed. Once ready, the patient will move
into the scanning room and around the same time, the
technologist will ‘start exam’ in the EHR. The
DICOM images get acquired at this point and sent to
a modality workstation. The RIS/EHR/PACS systems
typically work independent of the modality
workstation. At the end of the scan, the technologist
will review and push the images from workstation to
the PACS and then ‘end exam’ in the EHR. At this
point, the images are ready to be reviewed by a
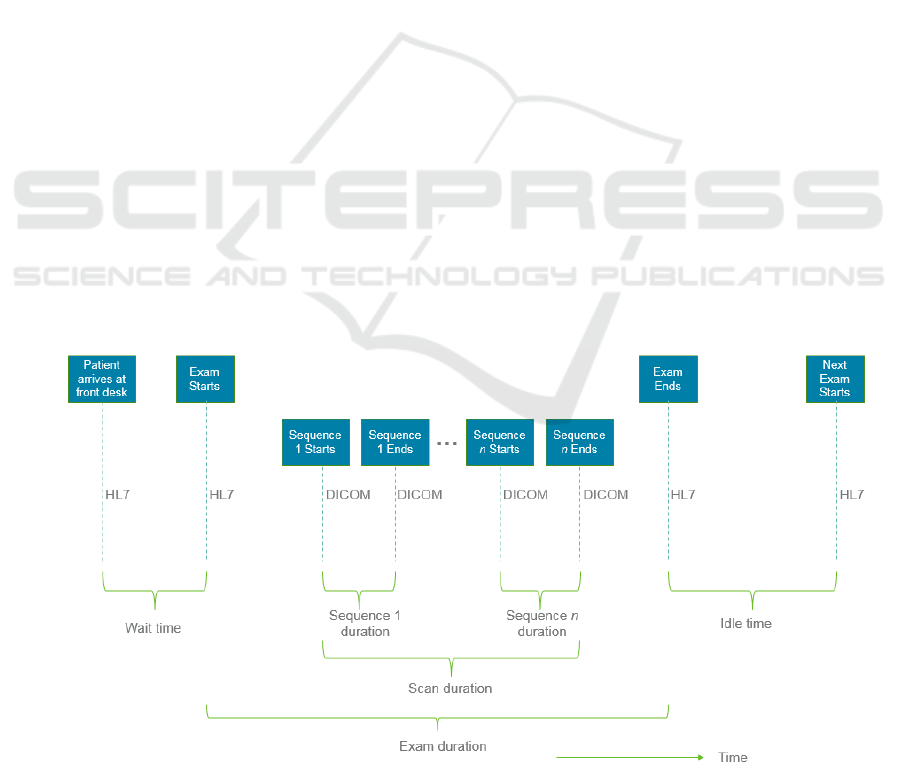
radiologist. All these workflow steps trigger HL7
messages. The end-to-end radiology workflow from
order-to-report is more extensive as discussed by
McEnery (McEnery 2013), but the image acquisition
process is where combining data from HL7 and
DICOM is most relevant. As such, we focus only on
this part of the workflow.
Figure 3: Status messages that get triggered during radiology workflow.
HEALTHINF 2017 - 10th International Conference on Health Informatics
60

Table 1: Events required to determine workflow metrics for a CT Abdomen-Pelvis exam.
Metric
Data Source
Event(s) / Segment
Comments
Patient wait time
HL7
ORM^001: ORC-5 (order status=ARRIVED);
ORM^001: ORC-5 (order status=BEGIN)
Value is difference between the two
events; e.g., 25 minutes
Total scan time
DICOM
Acquisition times from 1
st
and last image in
PACS using (0008,0032)
Value is difference between the two
timestamps of images; e.g., 18 minutes
Sequence time
DICOM
Acquisition times from 1
st
and last image in
PACS using (0008,0032) for each Series
grouped by series UID (0020,000E)
Value is difference between the two
timestamps of images for each series;
e.g., 4 minutes for Series 1; 7 minutes
for Series 2
Begin-to-End time
HL7
ORM^001: ORC-5 (order status=BEGIN);
ORM^001: ORC-5 (order status=END)
Value is difference between the two
events; e.g., 23 minutes
Arrive-to-End time
HL7
ORM^001: ORC-5 (order status=ARRIVED);
ORM^001: ORC-5 (order status=END)
Value is difference between the two
events; e.g., 48 minutes
Billing exam volume
HL7
Accession number count based on ORM^001:
OBR-3
For a CT Abdomen-Pelvis exam, 2
orders will be placed; exam volume is 2
Operational volume
DICOM
Accession number count using (0008,0050)
For a CT Abdomen-Pelvis exam, only 1
physical scan is performed.
Machine utilization
DICOM
Performed machine is identified using AE
Title tag (0073,1003)
Calculated using some interval (e.g.,
1hr) minus sum of total scan times per
AE Title
Technologist
productivity
HL7 + DICOM
ORM, OBR-34 – operator name; accession
from DICOM and HL7
Calculated using operational volume per
some interval (e.g., 1hr) per
technologist
The various status messages that get triggered during
the different steps of the radiology workflow are
shown in Figure 3. Table 1 shows a few important
metrics most radiology department track along with
the HL7/DICOM field(s) that can be used to calculate
the value.
A radiology exam is identified by a unique
accession number. This can be determined using the
value in HL7 ORM^001 OBR-3 segment or DICOM
(0008,0050) tag. Accession number is then used to
join between HL7 and DICOM data to determine the
accurate value using one or both data sources.
2.6 Dataset
Through a product co-creation agreement with an
integrated care delivery network, we had access to a
database that stored all HL7 and DICOM traffic that
was sent from the radiology department to the PACS
since June-2015. The database was within the
hospital premises in a secure data center with
restricted user access. All metrics computed were at
an aggregate level with no PHI exposed, and no data
left the hospital environment. As of 31-May-2016, the
database contained over 13 million HL7 messages
over 120 million DICOM records.
3 RESULTS
3.1 Workflow Considerations
Here we discuss seven important aspects that need to
be considered when specific metrics are calculated for
operational purposes, with a focus on the power of
combining data from HL7 and DICOM.
3.1.1 Billed vs Performed Exams
Study volume is essentially the number of unique
accession numbers. This is the fundamental
chargeable unit for a radiology department, and as
such, many clinical systems will produce this volume
report on a scheduled basis (typically weekly or
monthly). These reports are often driven by financial
reporting requirements, and as such, will contain only
the billing exam volume. As illustrated in Table 1,
this means that a CT abdomen-pelvis study where the
images are acquired in a single scan will get reported
as two billable exams since there will be two orders
associated with the scan. However, it is important to
know the operational study volume as well since this
can have a significant impact on metrics such as
number of exams performed on a machine and the
number of scans a given technologist has performed
Using HL7 and DICOM to Improve Operational Workflow Efficiency in Radiology
61

– it takes significantly longer, in fact nearly twice as
long, to perform two CT abdomen exams on two
patients (due to various changeover and
documentation times) than to perform two scans on
one patient. As a result, from an operations point of
view, it may not be accurate to say that one
technologist who has performed two billable exams
on the same patient has been as efficient as another
technologist who has performed two exams on two
different patients (assuming everything else is
comparable).
Distinguishing between billable and performed
exams may or may not have a significant impact
depending on the study mix performed at a given
institute. For instance, in our dataset, for a certain day,
there were 891 total billable exams based on HL7
messages whereas there were only 829 exams based
on DICOM. In general, the difference was between 5-
10%.
It should be noted that the ability to use the
accession count from DICOM to determine
operational volume depends on the particular
hospital’s workflow. Some hospitals, including the
one in our study, typically scan all images under a
single accession number, push them to the PACS, and
then either split, or link the images to the accession
numbers associated with the different orders.
Alternatively, the splitting can happen at the modality
workstation itself, in which case two accession
numbers (in the CT abdomen-pelvis example) will be
seen in DICOM. In this case, the reporting engine will
need to perform some logic, such as ‘same patient,
same acquisition times for different accession
numbers’ to determine which studies should be
merged for operational reporting purposes.
3.1.2 Exams with Multiple Modalities
Studies where multiple modalities are involved are
identified using the same accession number. A few
examples of such studies are PET-CT, PET-MR and
interventional radiology exams (which may often
involve XR and/or ultrasound and/or CT). In each
instance, the complete exam will often be billed under
a single accession number, although from an
operations point of view, two (or more) resources
were utilized to perform the exam. Images acquired
from different modalities can be determined using
DICOM Source AE Title tag. These exams need to be
correctly accounted for when determining relevant
metrics (such as operational volume, technologist
productivity and machine utilization).
3.1.3 Shared Resources
It is common practices for different departments
within radiology to share resources. For instance, a
PET/CT machine may be used mainly for PET scans,
but due to low PET volumes, the CT department may
often make use of this resource to perform certain CT
exams during busy periods. If PET and CT are
different cost centers, PET and CT volumes will be
shown separately for each departments, but for
machine utilization, both volumes need to be
accounted for.
3.1.4 Manual vs Automated Timestamps
Care must be taken when calculating various
turnaround times using timestamps. For instance, per
Figure 3, scan duration is calculated using times from
the DICOM header. These times will often be reliable
since these are machine generated timestamps. On the
other hand, depending on the clinical system, exam
start and end HL7 messages may be trigged manually.
This flexibility is provided often for valid practical
reasons, for instance, after acquiring all images for a
CT exam, a technologist may have time to ‘end exam’
in the system only after scanning a new emergency
patient (i.e., back-time the value for the previous
exam). Similarly, ‘start exam’ time may be entered
manually and may depend on the individual
technologist – some technologists may consider the
start of exam to be when they call the patient from the
waiting room, some may consider the start to be when
the patient walks into the scanning room, while others
may consider start of the exam when the patient is on
the scanner itself. As such, it is important to
standardize the terminology associated with granular
workflow steps. If the workflow can be standardized
so that all technologists start the exam when they go
to get the patient from the waiting room, then the time
difference between ‘patient arrived’ and ‘exam start’
HL7 messages will accurately reflect patient wait
time while the difference between ‘exam start’ HL7
message and ‘first DICOM image’ timestamp will
show the overhead associated with getting the patient
on the scanner (which could be significant for obese
and/or immobile patients) and adjusting the scanner
settings prior to image acquisition.
3.1.5 Same Information in HL7 and
DICOM
Some data can be available in both HL7 and DICOM.
Either source can be used if the value in both sources
is the same (such as the accession number), but there
could be instances where same data is entered slightly
HEALTHINF 2017 - 10th International Conference on Health Informatics
62
differently depending on the clinical system in use.
For instance, when a technologist completes an exam
in the EHR/RIS, the resulting HL7 ‘end exam’
message will contain the complete operator name. On
the other hand, the technologist also needs to enter the
name into the modality workstation; however, if all
reporting is EHR/RIS driven, technologists will often
enter only their initials into DICOM since this
information is not used anywhere. Therefore, it is
important to identify the right data source and merge
data from either HL7 or DICOM after identifying the
study based on accession number.
3.1.6 Site-specific Business Logic
It is important to give priority to any site-specific
business logic since these are used in routine
operations. For instance, at the DICOM level, the
modality for X-ray may be CR or DR (indicating
analog vs digital X-ray respectively) whereas
operational managers may consider all of them to be
XR. Similarly, cancelled exams and historical data
imports should not count towards exam volume,
although HL7/DICOM traffic related to such exams
may be visible on the network. It is important to
accurately capture and implement such site specific
business logic when making inferences from raw
data.
3.1.7 Workflow Related Nuances
Given the diversity and complexity of various
radiology exams, there could be various workflow
specific nuances. For instance, certain MR exams
may require post-processing of images, which can
take up to an hour (post-processing usually happens
on a separate machine while the technologist is start
scanning the next patient). Radiologists can typically
start reading exams as soon as a technologist has
ended an exam. If a technologist ends the exam after
post-processing is complete, and uses the current time
as the end exam time, then it would appear as if the
exam took a long time to complete. On the other hand,
if the technologists back-times the study end time to
when the exam truly ended (ignoring all the post-
processing time), it would appear as if the exam has
been waiting in the reading queue for a long time
which affects the report-turnaround time. As such, it
is important to agree upon how to interpret the
turnaround times in context.
3.2 Identifying Workflow
Improvement Opportunities
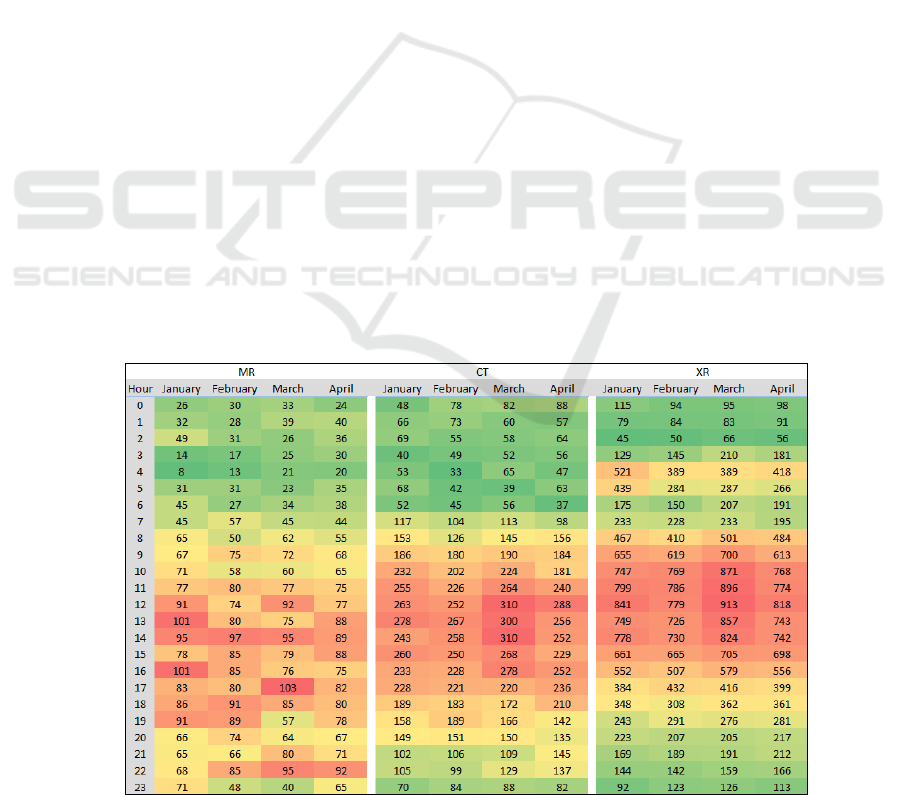
Using HL7 end exam messages, we determined the
monthly study volumes (Figure 4) as well as the
volume by day of week and hour of day (Figure 5) for
MR, CT and XR.
For CT and XR, the heatmap representation
indicates the times when most scans are completed –
as expected, this is during normal business hours –
Monday to Friday between 8am to 6pm. On the other
hand, the MR heatmap suggests that there is some
unusually high activity happening later in the day,
between 10 and 11 pm for the months of March and
April.
Upon investigation, the MR technologists
confirmed that they routinely end exams only towards
the end of the day, typically during the shift change.
Figure 4: Monthly exam volume by hour of day.
Using HL7 and DICOM to Improve Operational Workflow Efficiency in Radiology
63
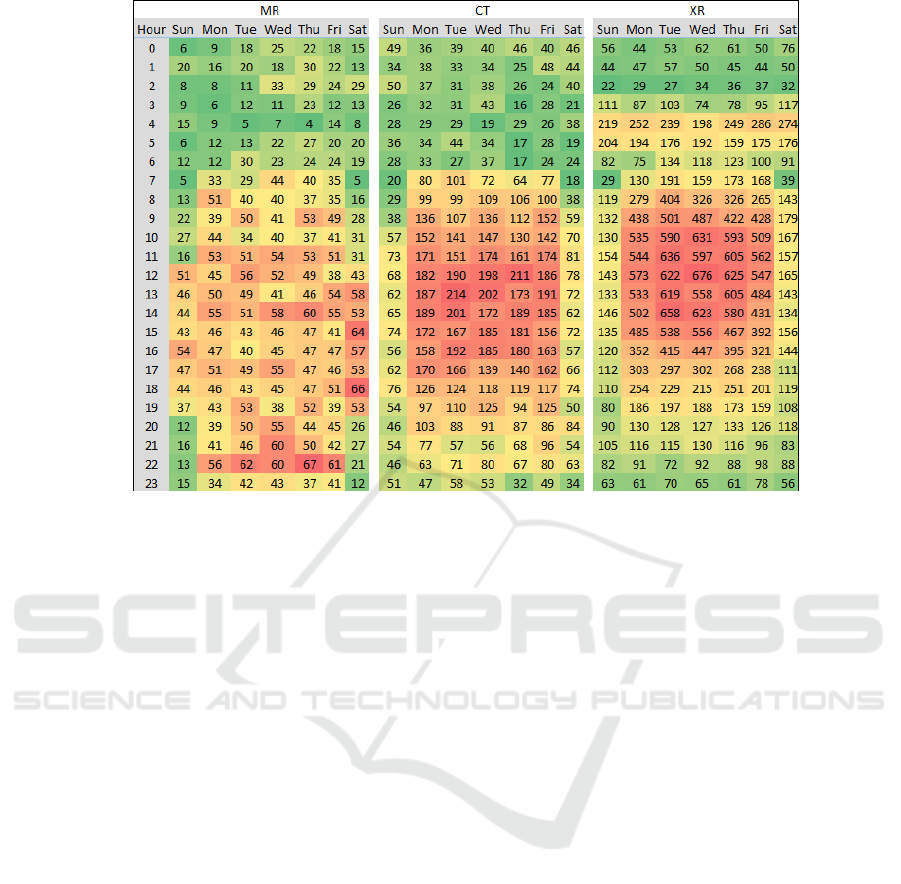
Figure 5: Exam volume by day of week and hour of day.
4 DISCUSSION
In this paper we have discussed the importance of
using both HL7 and DICOM to determine various
metrics related to the operations of a radiology
department. While using a single data source may be
a good approximation, it is important to take an
integrated approach in order to get better visibility
into more granular operations as well as determine
more accurate values for the metrics of interest.
A radiology department needs to create clear
definitions of metrics; even the seemingly obvious
terms such as “start of exam” need to be explicitly tied
to workflow steps and the electronic measurements
using HL7 and DICOM. This “data governance” is an
important aspect of the data analytics and process
improvement approach. Data governance should
define clearly the metrics, agree on the measurement
methodology, understand the exceptions cases where
the methodology might be imperfect, and serve as a
governing body to increase the acceptance of the
process improvement initiatives.
In the context of the MR workflow, we have
discussed a specific example where technologists
were routinely ending exams towards the end of the
shift. This may be acceptable for practical reasons,
but at the same time, this affects the data quality,
which in turn affect the various metrics that are based
on this data. As such, it is important for radiology
administrators and Department Chairs to proactively
set forth suitable guidelines and educate the
technologists on the importance of adhering to such
guideline. Providing visible feedback to the
technologists on a regular basis on the performance
of the department may help improve compliance to
such requests.
Despite having access to a large dataset, the
current study has one main limitation – the dataset is
from a single institution, and as such, the DICOM
tags we have used may not always be generalizable.
Although vendors are expected to follow the
standard, they often use private tags (to exchange
vendor-specific information that is not covered by the
DICOM standard) instead of public tags, and
sometimes populate different public tags instead of
the commonly used tags; as such, the mapping may
need to be modified depending on the site.
Having access to tools to provide visibility into
granular workflow operations is crucial for the
success of radiology departments. However, as
discussed, developers of such tools need to keep in
mind the various nuances associated with hospital
workflows in order for such tools to be meaningful
and widely adopted by all stakeholders.
HEALTHINF 2017 - 10th International Conference on Health Informatics
64

REFERENCES
Altova. (2016). "HL7 Technology Overview." Retrieved
Sep 7, 2015, from http://www.altova.com/
HL7_technology_primer.html.
Centers for Medicare & Medicaid Services.
"Comprehensive Care for Joint Replacement Model."
Retrieved Sep 17, 2016, from https://innovation.cms
.gov/initiatives/cjr.
Centers for Medicare & Medicaid Services. "Health Care
Payment Learning and Action Network." Retrieved
Sep 15, 2016, from https://www.cms.gov/newsroom
/mediareleasedatabase/fact-sheets/2015-fact-sheets-
items/2015-02-27.html.
Centers for Medicare & Medicaid Services. "NHE Fact
Sheet." Retrieved Sep 17, 2016, from https://www.cms
.gov/research-statistics-data-and-systems/statistics-
trends-and-reports/nationalhealthexpenddata/nhe-fact-
sheet.html.
Cook, T. S. and P. Nagy (2014). "Business intelligence for
the radiologist: making your data work for you." J Am
Coll Radiol 11(12 Pt B): 1238-1240.
HealthIT.gov. (2015). "Meaningful Use Definition &
Objectives." Retrieved Sep 7, 2015, from
http://www.healthit.gov/providers-
professionals/meaningful-use-definition-objectives
HL7. (2016). "HL7 Interface Engine." Retrieved Sep 8,
2015, from http://www.hl7.com/interface-engine.html.
HL7. (2016). "HL7 Messaging Standard Version 2.7."
Retrieved Sep 7, 2015, from http://www.hl7.org
/implement/standards/product_brief.cfm?product_id=1
46.
Karami, M. (2014). "A design protocol to develop
radiology dashboards." Acta Inform Med 22(5): 341-
346.
McEnery, K. (2013). Radiology Information Systems and
Electronic Medical Records. IT Reference Guide for
the Practicing Radiologist, American College of
Radiology.
Morgan, M. B., B. F. t. Branstetter, D. M. Lionetti, J. S.
Richardson and P. J. Chang (2008). "The radiology
digital dashboard: effects on report turnaround time." J
Digit Imaging 21(1): 50-58.
peer60. "Unnecessary Imaging: Up to $12 Billion Wasted
Each Year." Retrieved Sep 17, 2016, from
http://research.peer60.com/unnecessary-imaging/.
The Advisory Board Company. (2008). "Imaging
Marketing Strategy: Lessons from Progressive Centers
on Securing Share." Retrieved Sep 2, 2016, from
https://www.advisory.com/-/media/Advisory-
com/Research/IPP/Research-Study/2008/Imaging-
Marketing-Strategy/17272_IPP_Imaging_Marketing_
Strategy.pdf.
The DICOM Standard. "DICOM Homepage." Retrieved
Sep 2, 2016, from http://dicom.nema.org
/standard.html.
Using HL7 and DICOM to Improve Operational Workflow Efficiency in Radiology
65
